- English (UK)
.jpg?height=93&quality=100)
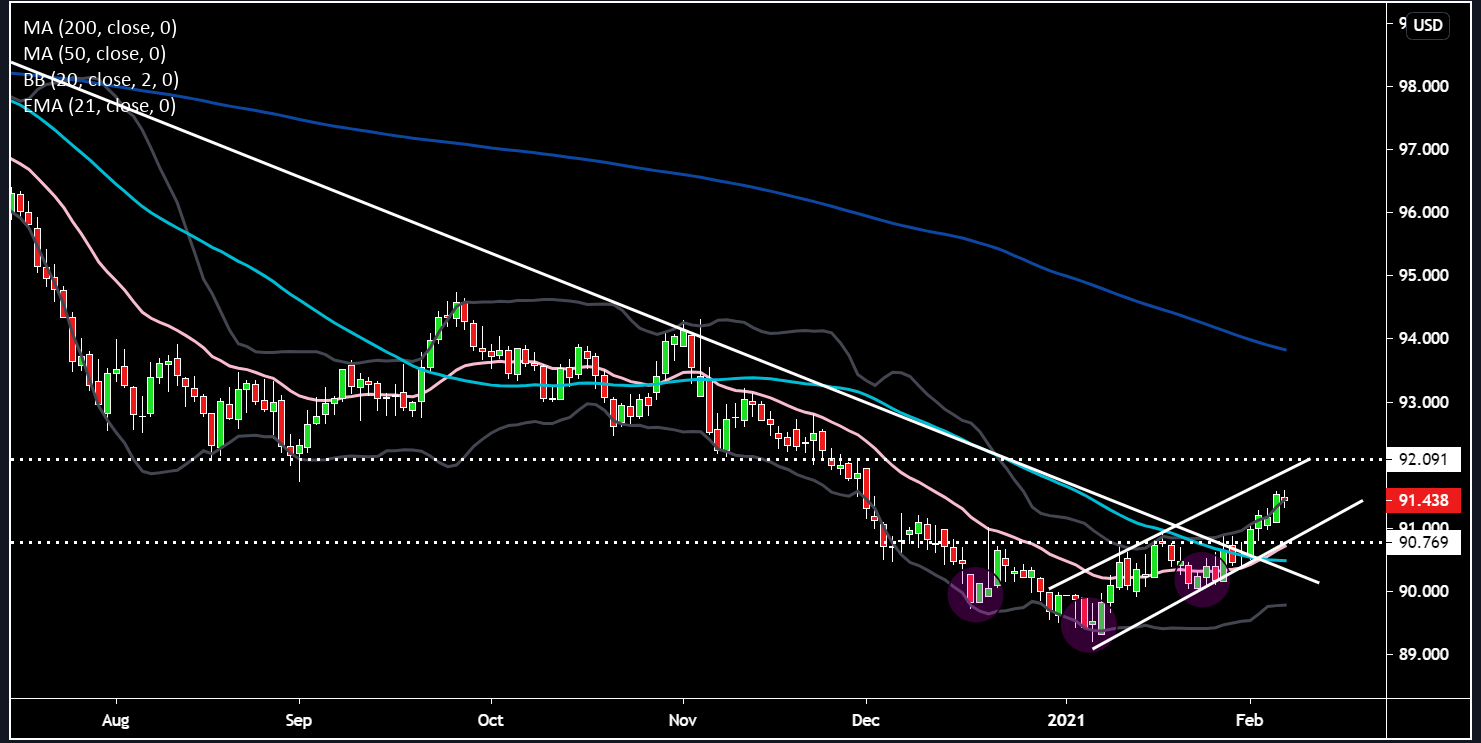
DXY
The dollar continues to flex its muscles. It has gained over the last 5 days on the back of a rise in yields and a switch to a “US growth exceptionalism” narrative. In 2017 it was tax cuts and deregulation, in 2021 it’s stimulus and better virus prospects. Earnings season in the US has illustrated the resiliency of the US economy as 80% of companies have beaten expectations on EPS and 75% on revenue. Today this theme could be strengthened when we receive the NFP numbers (consensus expects +105k). The DXY index has a heavy skew towards the EURUSD, which has been weak of late. Is that very chunky net short dollar position starting to work in the dollars favour? I think so, and the higher it moves the more positions have to be covered, causing a bullish dollar feedback loop.
Inspecting the chart indicates the inverted head and shoulders pattern seems to be playing out, complemented by a small ascending bullish channel. The pink 21-day EMA has made a bullish crossover with the light blue 50-day SMA. The downtrend line from March has been sliced through like butter. The next target for the dollar bulls is 92 which would coincide with the support line of the range we saw from August to November in 2020. Important levels to watch on pullbacks would be 91 (support line on small ascending bullish channel and previous resistance).
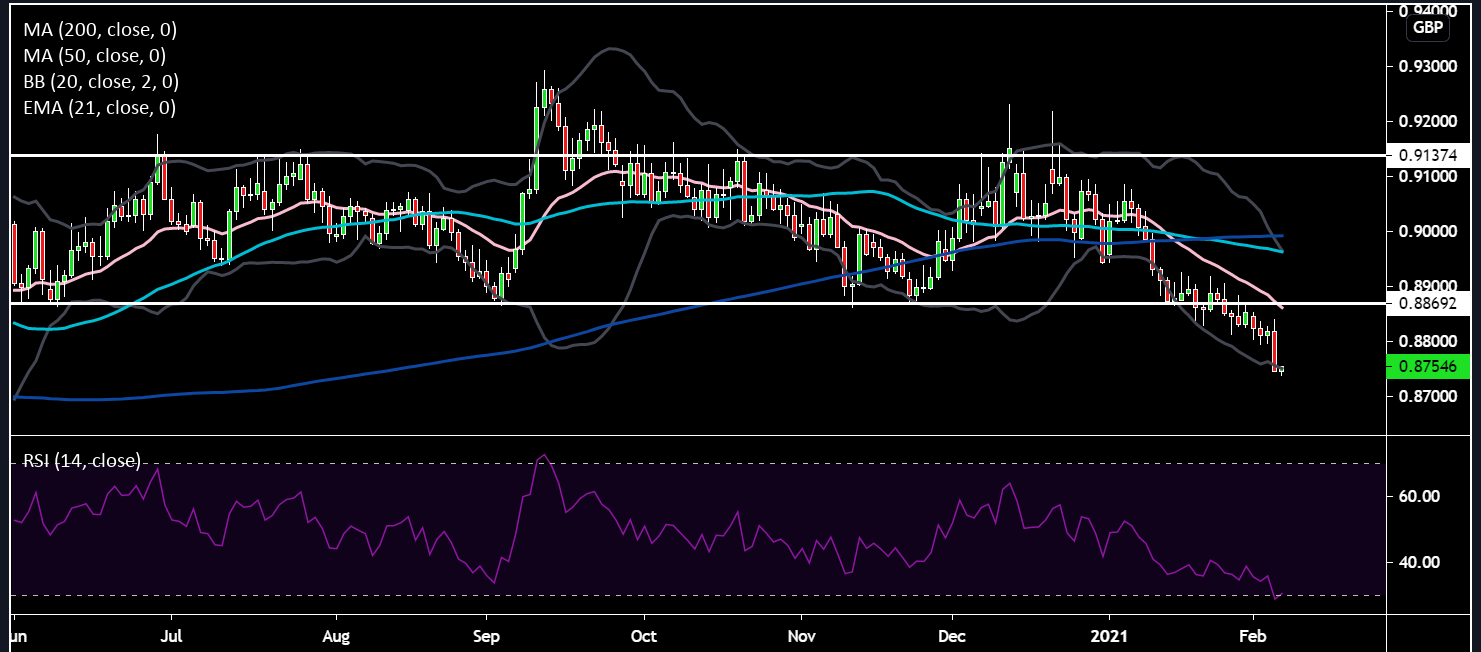
EURGBP
The consensus trade of euro strength at the beginning of the year seems to be in complete tatters as on both the GBP and USD cross the euro is struggling. It really boils down to a botched virus vaccination rollout. Lack of stimulus, as the recovery fund has not been deployed yet. An overly dovish central bank keeping front rates pinned. Throw in some Italian political turmoil and you have a potent bearish brew for the euro.
Taking a peak at the chart of EURGBP cross which for me looks like a prime candidate to take a short the rallies view. The pink 21-day EMA could be used as tool to help with those entry points as it acts like a dynamic overhead resistance. The technical picture really doesn’t inspire any positivity. The pink and light blue 21-day EMA and 50-day SMA have both made death crosses with the dark blue 200-day SMA are pointing downwards. The range in place since May has definitively broken to the downside and looks set to continue. The RSI does some to indicate oversold conditions which could lead to some brief respite for the euro, however, I don’t expect the higher price move to last for very long. Those that are bullish on Sterling would be wiser to express that through EURGBP as opposed to GBPUSD, due to dollar strength.
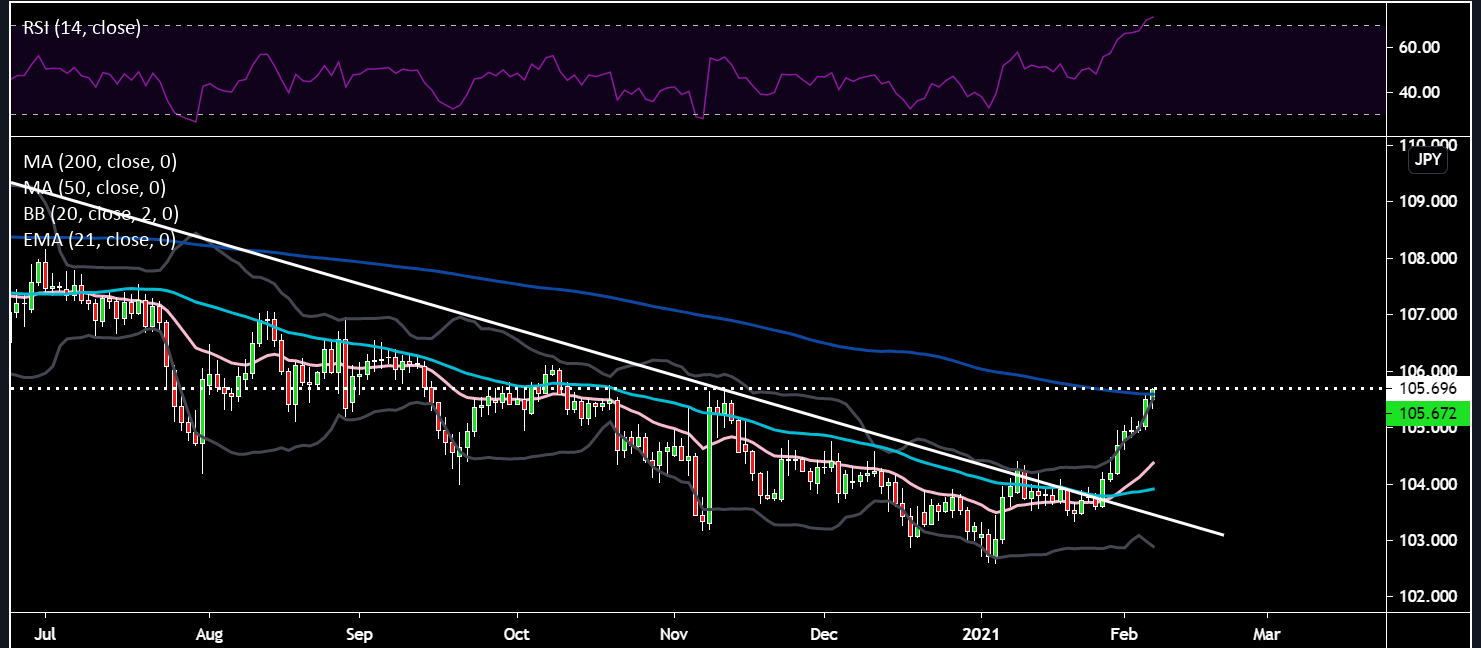
USDJPY
This cross has really impressed with some significant moves to the upside. Once that downtrend line from March was broken and validated USDJPY grew wings and just flew. The pink 21-day EMA has made a bullish crossover with the light blue 50-day SMA. As US yields tick up, Japanese investors will be licking their lips and hence helping create a bid for the dollar and leading to offers on the yen. Despite the bullish chart. There are some minor negatives to be aware of - overhead resistance now present in the form of the dark blue 200-day SMA and resistance at 105.7. The RSI is also in overbought territory at 73.17, which in the past has led to some selling. I still think this cross is a good candidate for a buy the dips approach.
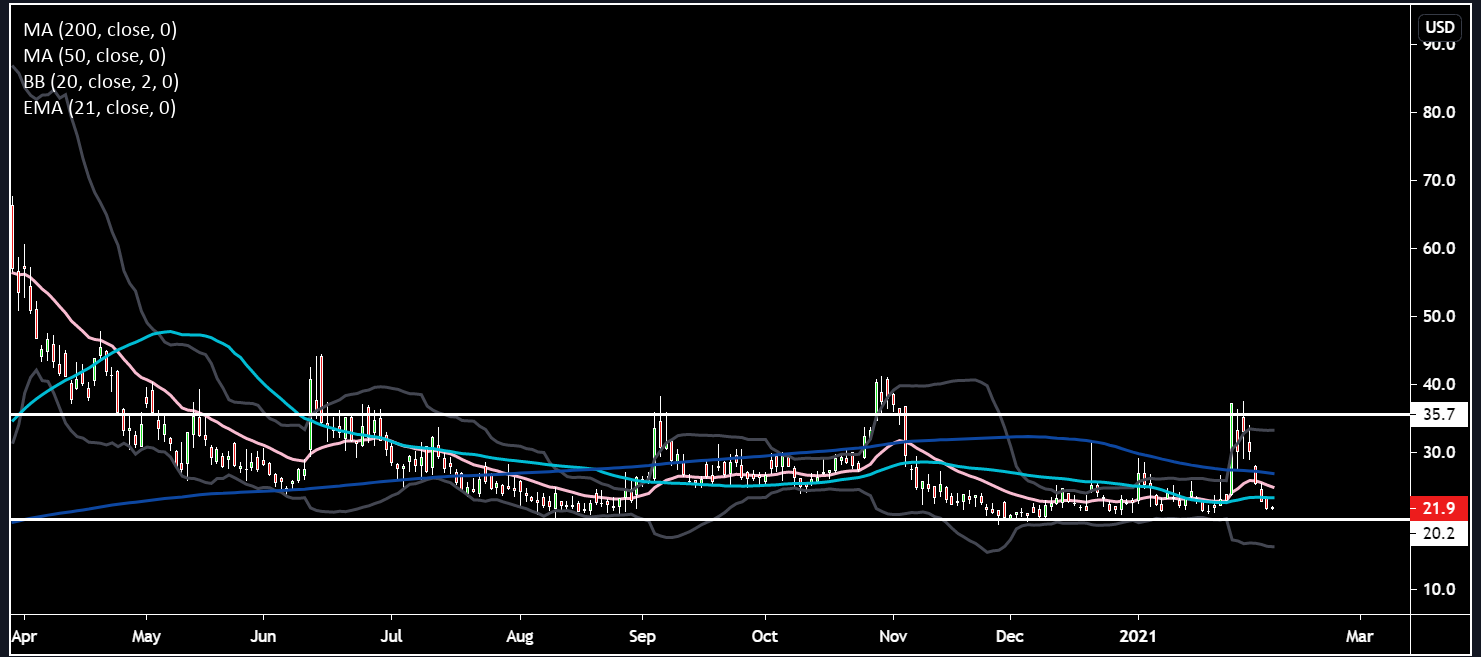
VIX
The fear gauge used by Wall Street has seen some serious vol crush in the past few days, down around 15 vols over the past 5 days. It is hovering right around the light blue 50-day SMA. This move has definitely helped risk assets like equities move higher. The big question remains, when will the VIX breakout of the range between 35-20 that began in May. If it’s a downside breakout which looks the higher probability outcome given the improving virus picture and economic outlook, then it’s lift-off time for risk assets.
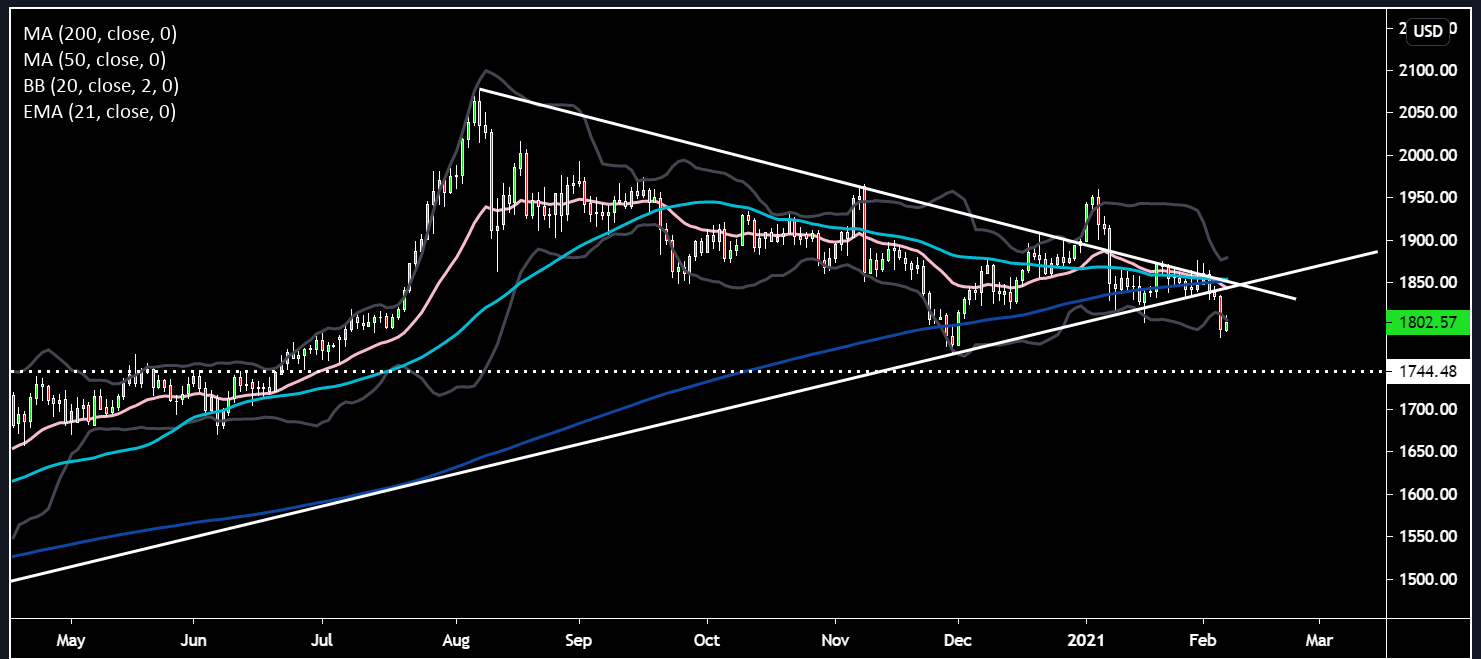
Gold
Last but not least, Gold took a big hit yesterday losing over 2%. For me there is a few drivers here. One, the risk picture is improving as evidenced by the collapse in VIX and rise in equity benchmarks causing outflows. Two, dollar strength keeping a lid on additional demand. Three, Silver has taken over as the sexy precious metals play on the back of the Wall Street Bets looking for their next squeeze target. The chart looks uninspiring. Price has broken to the downside of the large triangle pattern which had formed. The pink 21-day EMA has rolled over, crossing below the light blue 50-day SMA and the dark blue 200-day SMA. The 50-day SMA looks like it wants to cross below the 200-day SMA too. The uptrend line from the March lows will now act as overhead resistance with gold bugs needing to see that line reclaimed. If the November low ($1764) is taken out then $1750 is the next support level. Tough to call for sure but gold does look like another candidate moving towards a slow grind lower with the March downtrend line keeping a lid on things.
Related articles


Ready to trade?
It's quick and easy to get started. Apply in minutes with our online application process.
The material provided here has not been prepared in accordance with legal requirements designed to promote the independence of investment research and as such is considered to be a marketing communication. Whilst it is not subject to any prohibition on dealing ahead of the dissemination of investment research we will not seek to take any advantage before providing it to our clients.
Pepperstone doesn’t represent that the material provided here is accurate, current or complete, and therefore shouldn’t be relied upon as such. The information, whether from a third party or not, isn’t to be considered as a recommendation; or an offer to buy or sell; or the solicitation of an offer to buy or sell any security, financial product or instrument; or to participate in any particular trading strategy. It does not take into account readers’ financial situation or investment objectives. We advise any readers of this content to seek their own advice. Without the approval of Pepperstone, reproduction or redistribution of this information isn’t permitted.