- English (UK)
5 Charts: If the Fed is worried, should you be worried too?

I’ve gathered five charts to illustrate the unexpected risk-off reaction. The question begs: If the Fed is worried, should you and I be worried too?
Gold (XAUUSD)
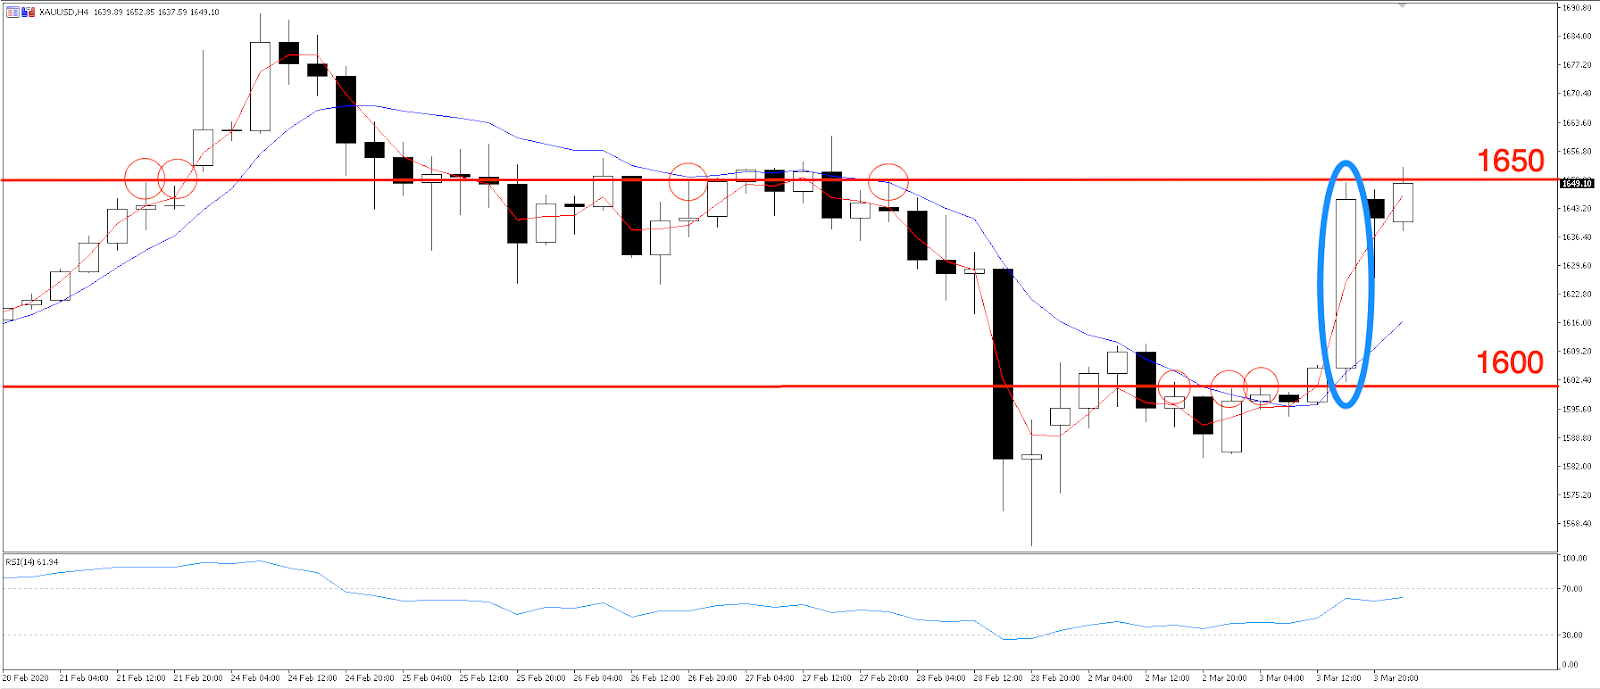
Gold made a huge move upwards and hit a high of 1649 USD after the Federal Reserve’s emergency rate cut decision.
You can see on the 4-hour chart that gold had been sitting shy of 1600 USD as markets awaited a joint central bank response to the virus fallout. The Fed expected the move would calm markets, which had cried out for serious easing, but instead the cut incited more panic and caused a flee to safe assets such as gold.
So is this move enough to hold gold above 1600 USD? And what takes it above 1650?
I’d expect gold to move within this 1600 to 1650 USD level until the next bout of news breaks the range. The outlook for gold remains to the upside, with cases climbing in South Korea and Italy, the global disruption might only be starting. Particularly concerning is the number of cases in the USA, which is now above 100 and has moved from the Pacific to Atlantic coast. A disruption in the world’s biggest economy would be a sure move to gold to push higher, and the USD lower.
Another opportunity for gold traders, albeit small compared to the global virus outbreak, is the US Democratic party nomination. The race between Biden and Sanders is too close to call for now, but with another round of states voting next week, we’ll begin to understand who the likely nominee will be. If Sanders takes a considerable lead, we’d expect investors to buy into gold as a hedge against the risk of anti-Wall Street administration.
So long as headlines remain quiet, gold could bounce between 1600 and 1650 until its next charge higher.
US500
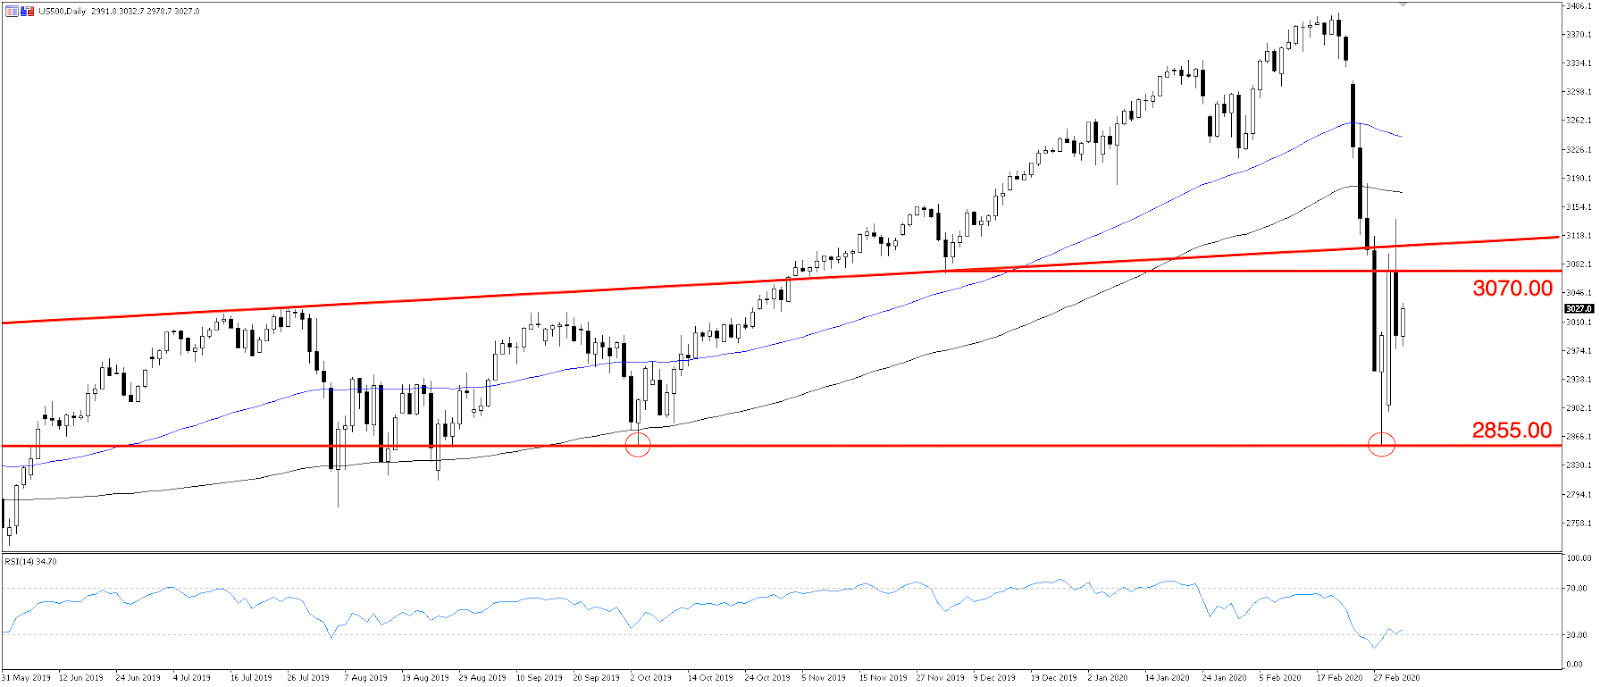
The benchmark S&P 500 index (US500) closed in the red yet again after two days of gains. Stocks tracked higher on the expectation that coordinated central bank action would support markets in crisis mode, but after getting what they wanted, markets seem to have reconsidered the usefulness of rate cuts.
An emergency cut in 1998 saw US stocks rally 50% in the following six months but was criticised for extending the dotcom bubble, which eventually crashed. Then the 2008 emergency cut did nothing to prevent the downturn and stocks fell another 50% before bouncing back. Of course this is not a liquidity crisis like the GFC, but a recovery does seem unlikely if the novel coronavirus only further disrupts global production.
The US500 remains below its 200 day moving average (black line), a crucial level where investors become hesitant to purchase stocks. Having wiped all gains since October, the US500 has strong support at the 2855 level, where the earnings risk premium kicks in. Resistance at 3070.00 looks solid too, so we could see some choppy action in this band until the newsflow takes a turn in either direction, good or bad.
If you’re genuinely worried about further drawdown in an equity index and looking for an opportunity to hedge that risk, Pepperstone CFDs offer a range of solutions to facilitate that hedge. Taking a position by shorting an equity index or even an individual share against the physical equity portfolio can help mitigate share losses if equity markets continue to tank.
USDJPY
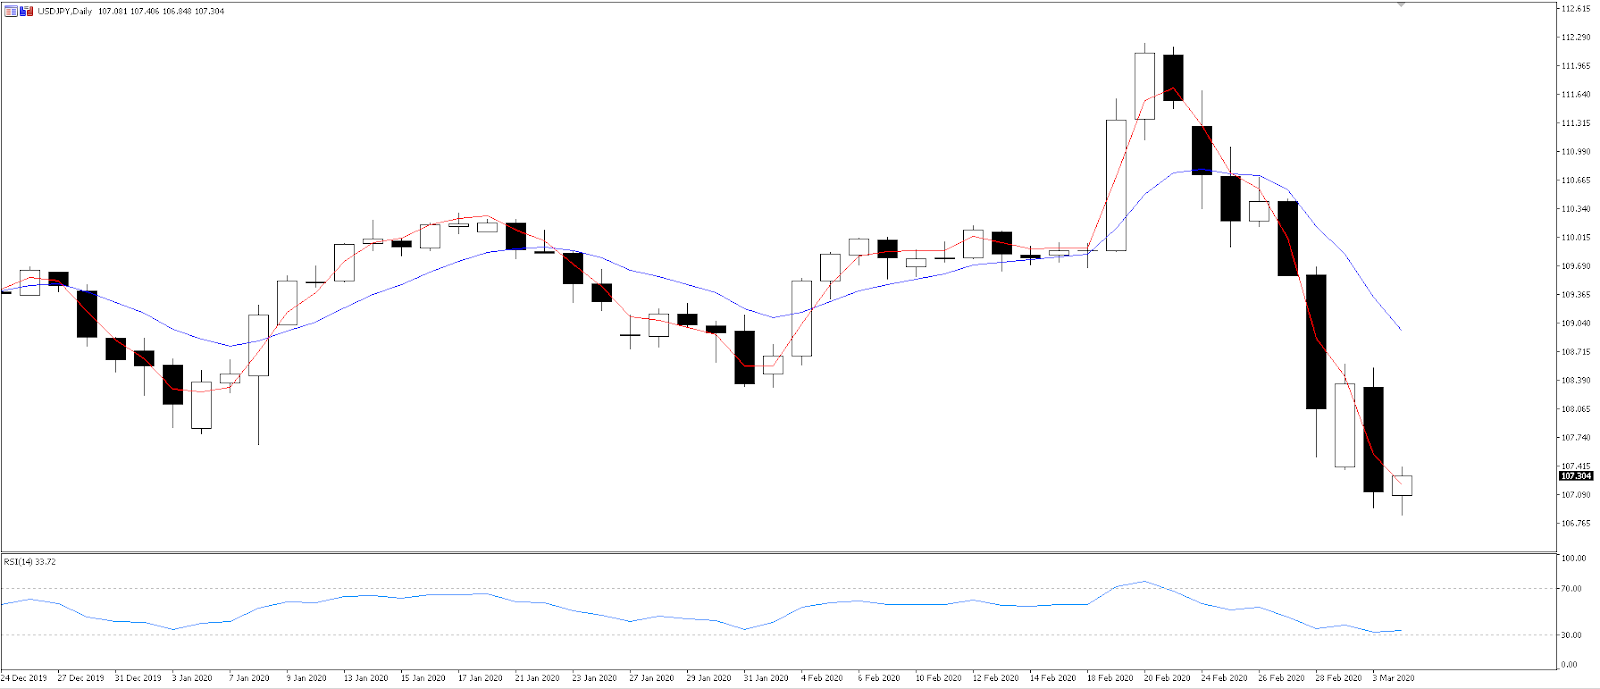
The strong downtrend since 21 February has taken USDJPY hard and fast from above 112.00 to 107.00. The pair has seen consecutive lower highs and only one day without a lower low since the downturn began.
Japan being on the verge of recession can’t hold the safe haven yen down. In early Asian trading, the yen hit a 2020 high (USDJPY down) as a flight to safety takes money out of the USD and into the JPY.
The USD suffered considerable losses after the 50bp rate cut and with more rate cuts priced in, threatens to be weakened further. Markets have fully discounted a 25bp rate cut for the 18 March FOMC meeting, and have priced a 70% chance of a second 50bp cut.
EURUSD
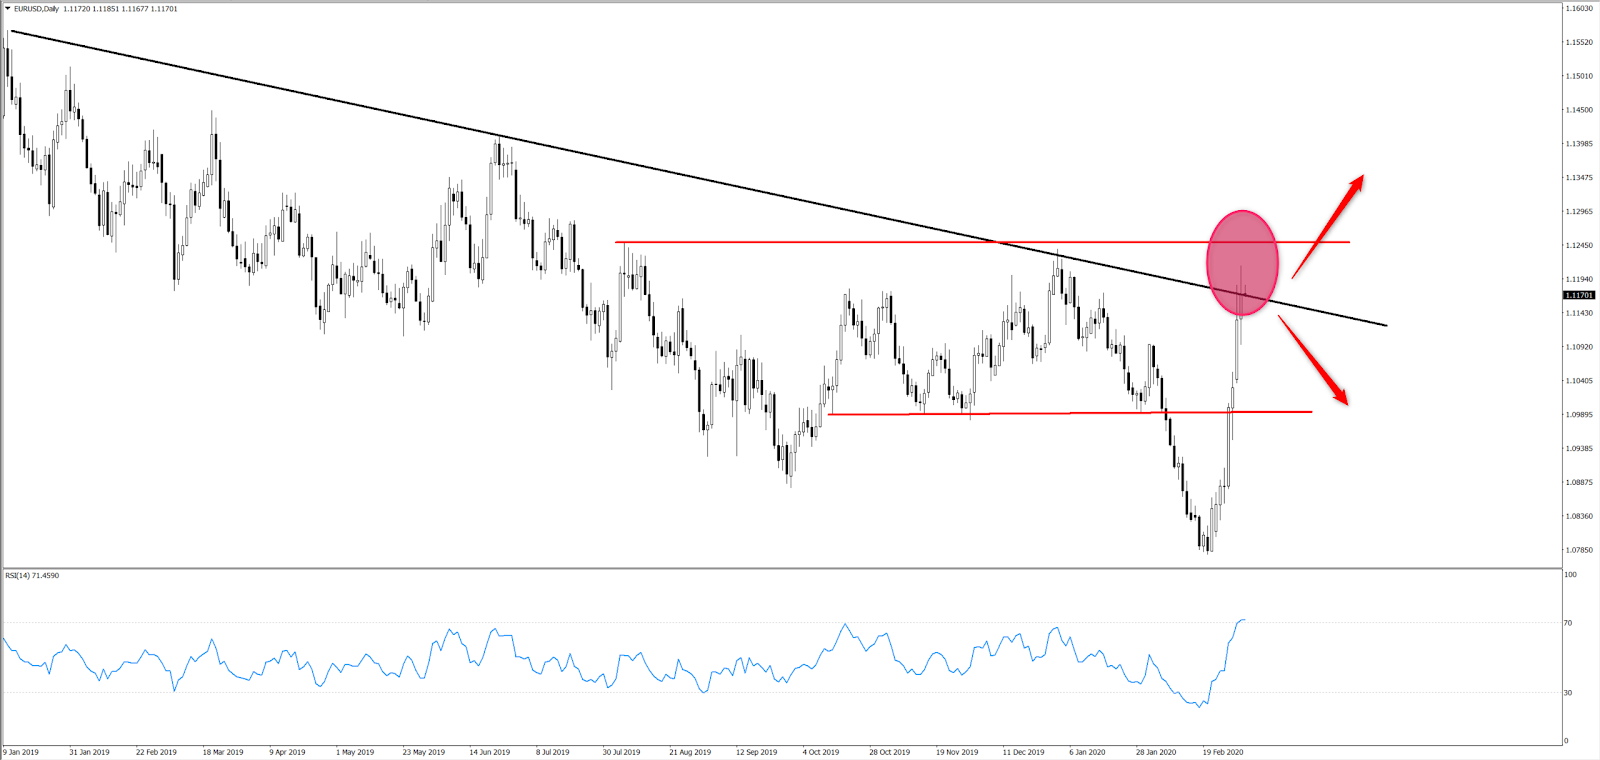
A compelling rally on the EURUSD daily chart is a telling story of USD weakness and a rebounding euro. The euro has benefitted not just from a weakening USD, but also carry trades being unwound as volatility picks up and investors buy back their funding currency, in this case the euro.
The pair has rallied to the long-term downtrend where it has met resistance at the 1.1170 level. A successful daily close above here would pave the way to 1.1200, which would be in line with USD weakening after the emergency 50bp rate cut and a possible second 50bp rate cut at the next Fed meeting. The US has ample room to cut rates but the Eurozone is already in negative rates and reluctant to go lower. From this angle, there’s more room for USD downside, from which the euro will benefit.
We see a key support level at 1.0990 should the virus spread further throughout Europe, with Italy already a hotspot.
US 10-year treasuries
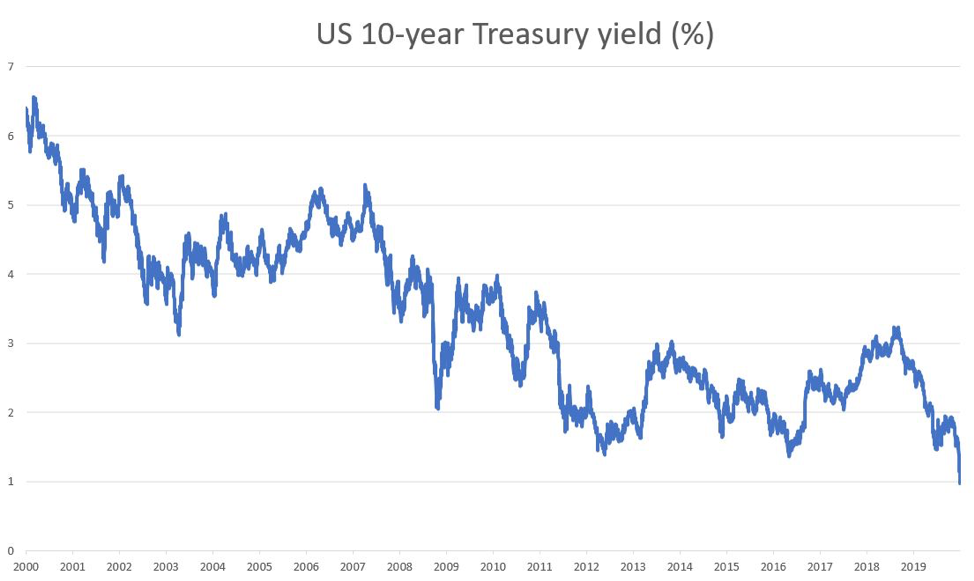
Following the Fed’s emergency rate cut, the US 10-year yield fell below 1% for the first time ever. A lot has shaken the US economy over time, but nothing has driven the 10-year yield this low before.
The move shows that US financial conditions are coming into line with those of Europe and Japan, where low and negative yields have been the status quo for some time. The move assisted USD weakening,
President Donald Trump, who has called for mass rate cuts as low as zero, will be happy with the news and pleased to see markets pricing more rate cuts for the FOMC meeting on 18 March.
Ready to trade?
It's quick and easy to get started. Apply in minutes with our online application process.
The material provided here has not been prepared in accordance with legal requirements designed to promote the independence of investment research and as such is considered to be a marketing communication. Whilst it is not subject to any prohibition on dealing ahead of the dissemination of investment research we will not seek to take any advantage before providing it to our clients.
Pepperstone doesn’t represent that the material provided here is accurate, current or complete, and therefore shouldn’t be relied upon as such. The information, whether from a third party or not, isn’t to be considered as a recommendation; or an offer to buy or sell; or the solicitation of an offer to buy or sell any security, financial product or instrument; or to participate in any particular trading strategy. It does not take into account readers’ financial situation or investment objectives. We advise any readers of this content to seek their own advice. Without the approval of Pepperstone, reproduction or redistribution of this information isn’t permitted.