Spread bets and CFDs are complex instruments and come with a high risk of losing money rapidly due to leverage. 72% of retail investor accounts lose money when trading spread bets and CFDs with this provider. You should consider whether you understand how spread bets and CFDs work, and whether you can afford to take the high risk of losing your money.
- English (UK)
Breaking down the components
Before we look at the EURUSDforecast for the remainder of 2022, we should look at the single currencies as a standalone product. This will highlight if the move lower in the major currency pair has mainly been driven by the EURO weakness or USD strength.
The DXY (USD basket)
Looking out to the DXY monthly timeframe, we have seen a rejection in July at the trend of higher highs. This trend line resistance could be seen to form part of a larger Ending Wedge pattern. This formation has an eventual bias to break to the downside.
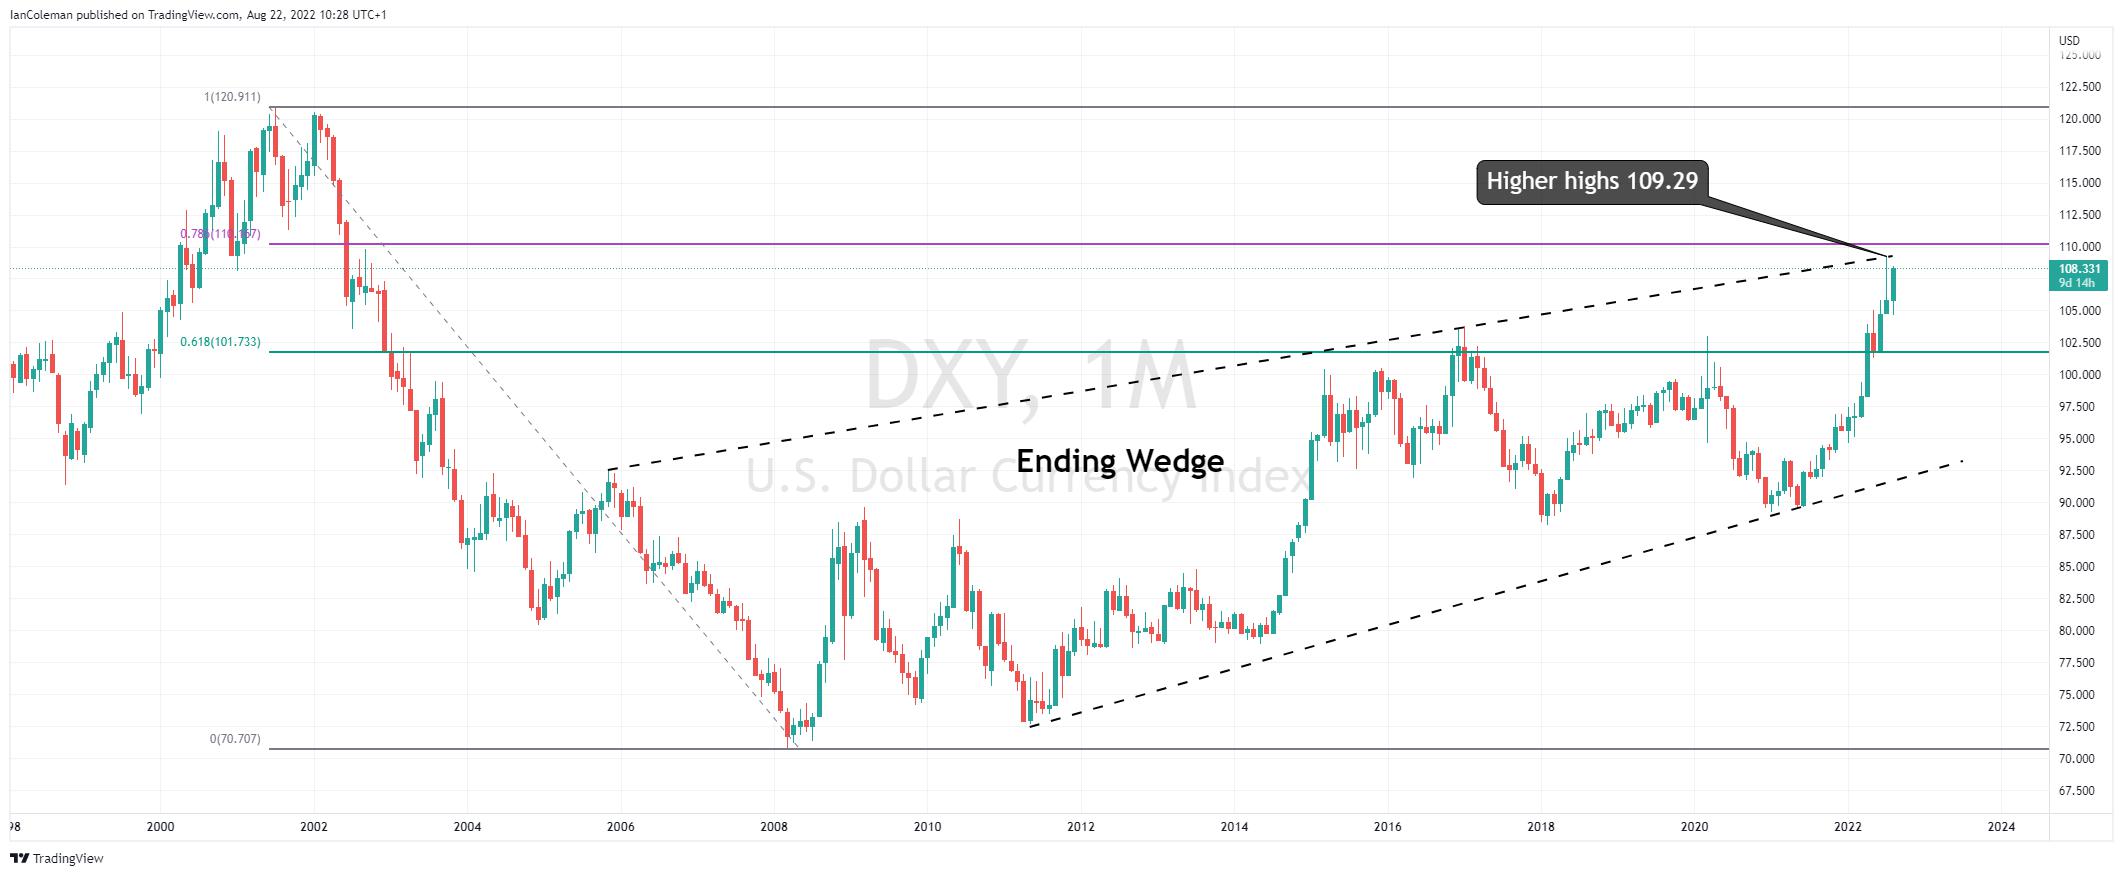
Figure 1 Trading View DXY Monthly Ending Wedge
The DXY daily chart and we are possibly forming a Cypher pattern known as a Butterfly formation. This offers Fibonacci confluence at 101.75.
It is common practice for the B-C leg to reach 88.6% of the A-B leg, often analysed as a double top. It should be noted that if the DXY index does NOT break the swing high from the 14th of July, then the pattern is still valid. This offers a mild bearish bias if 109.30 stays intact.
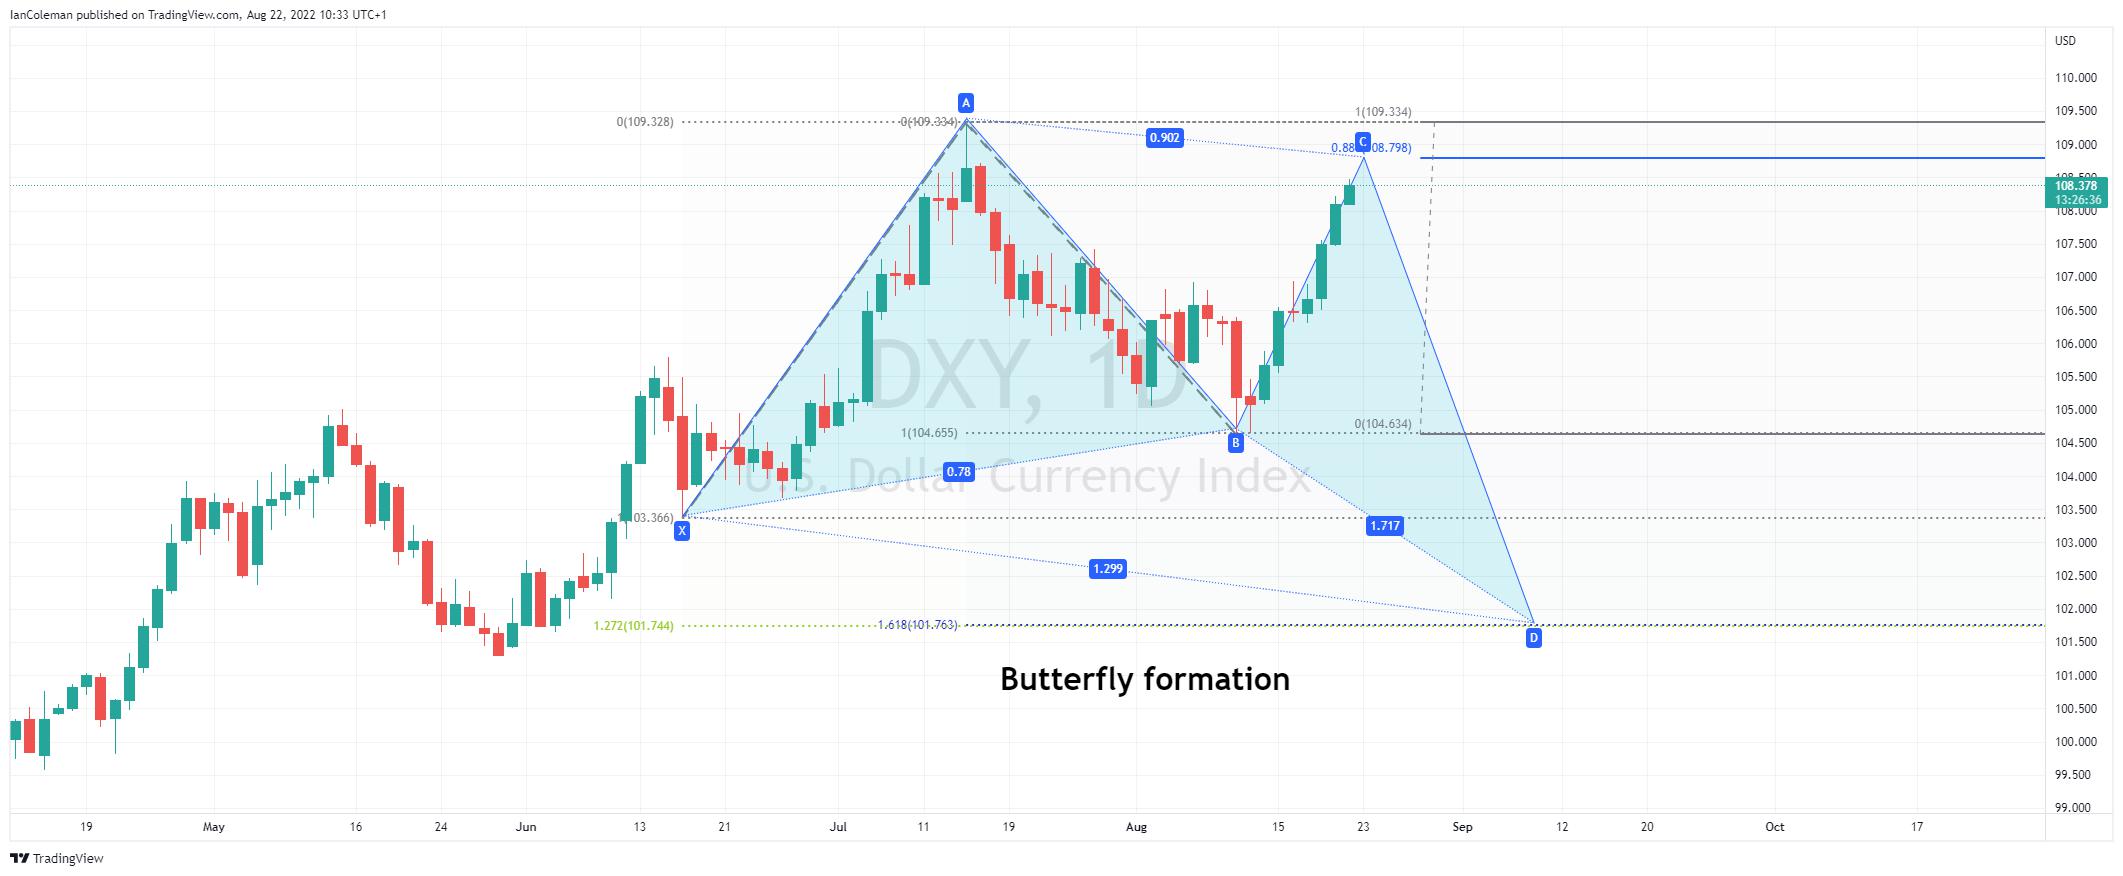
Figure 2 Trading View Daily Butterfly formation
The Euro basket
The Euro basket daily chart offers a mixed picture.
The bearish scenario is that we are moving lower in a Flag formation. The measured move target is 262.36.
The bullish scenario is that we are trading within a bullish Ending wedge, that has an eventual bias to break to the upside.
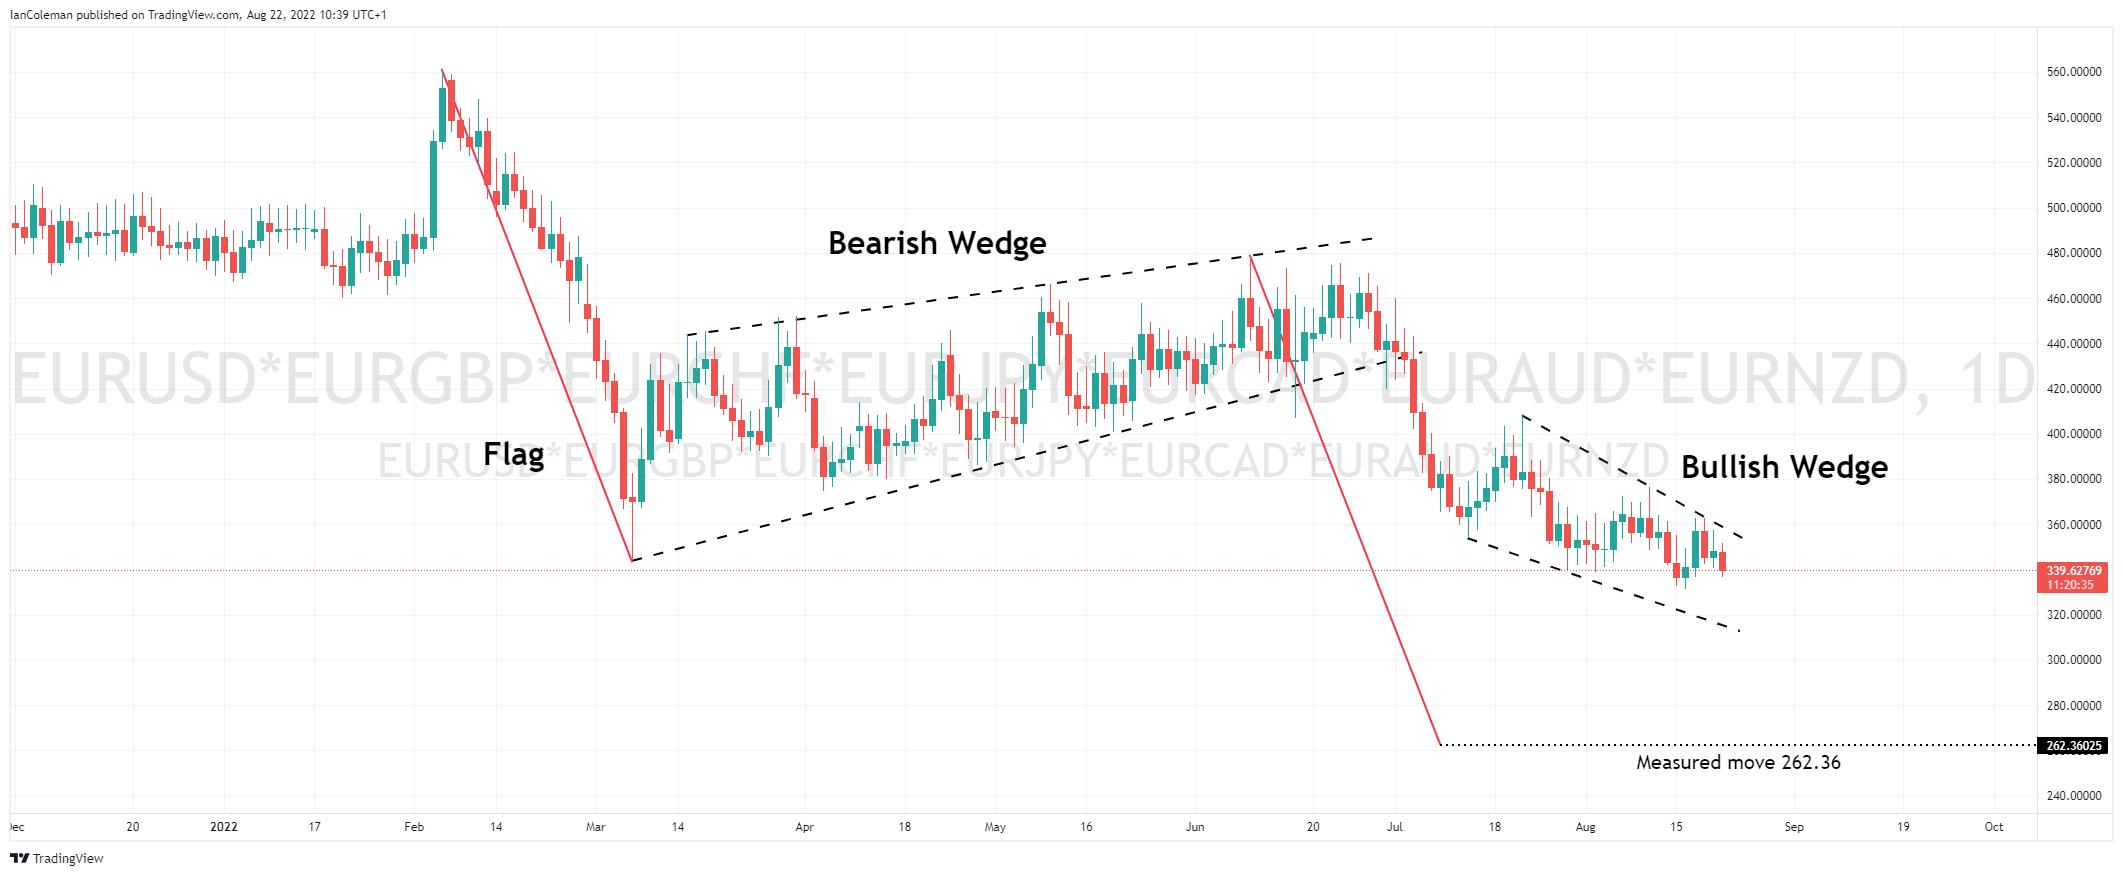
Figure 3 Trading View Euro Basket Mixed Picture
Breaking down the EURUSD forecast
The EURUSD monthly chart highlights a strong and impulsive rally from October 2000 to July 2008. This move can be broken down into a bullish 5-wave pattern with inside legs in 5-waves. From an Elliott Wave perspective, this is the end of a completed positive cycle.
With that in mind, the whole move lower from the 1.6038 peak could be assessed as being a complex correction, holding within a bearish channel formation.
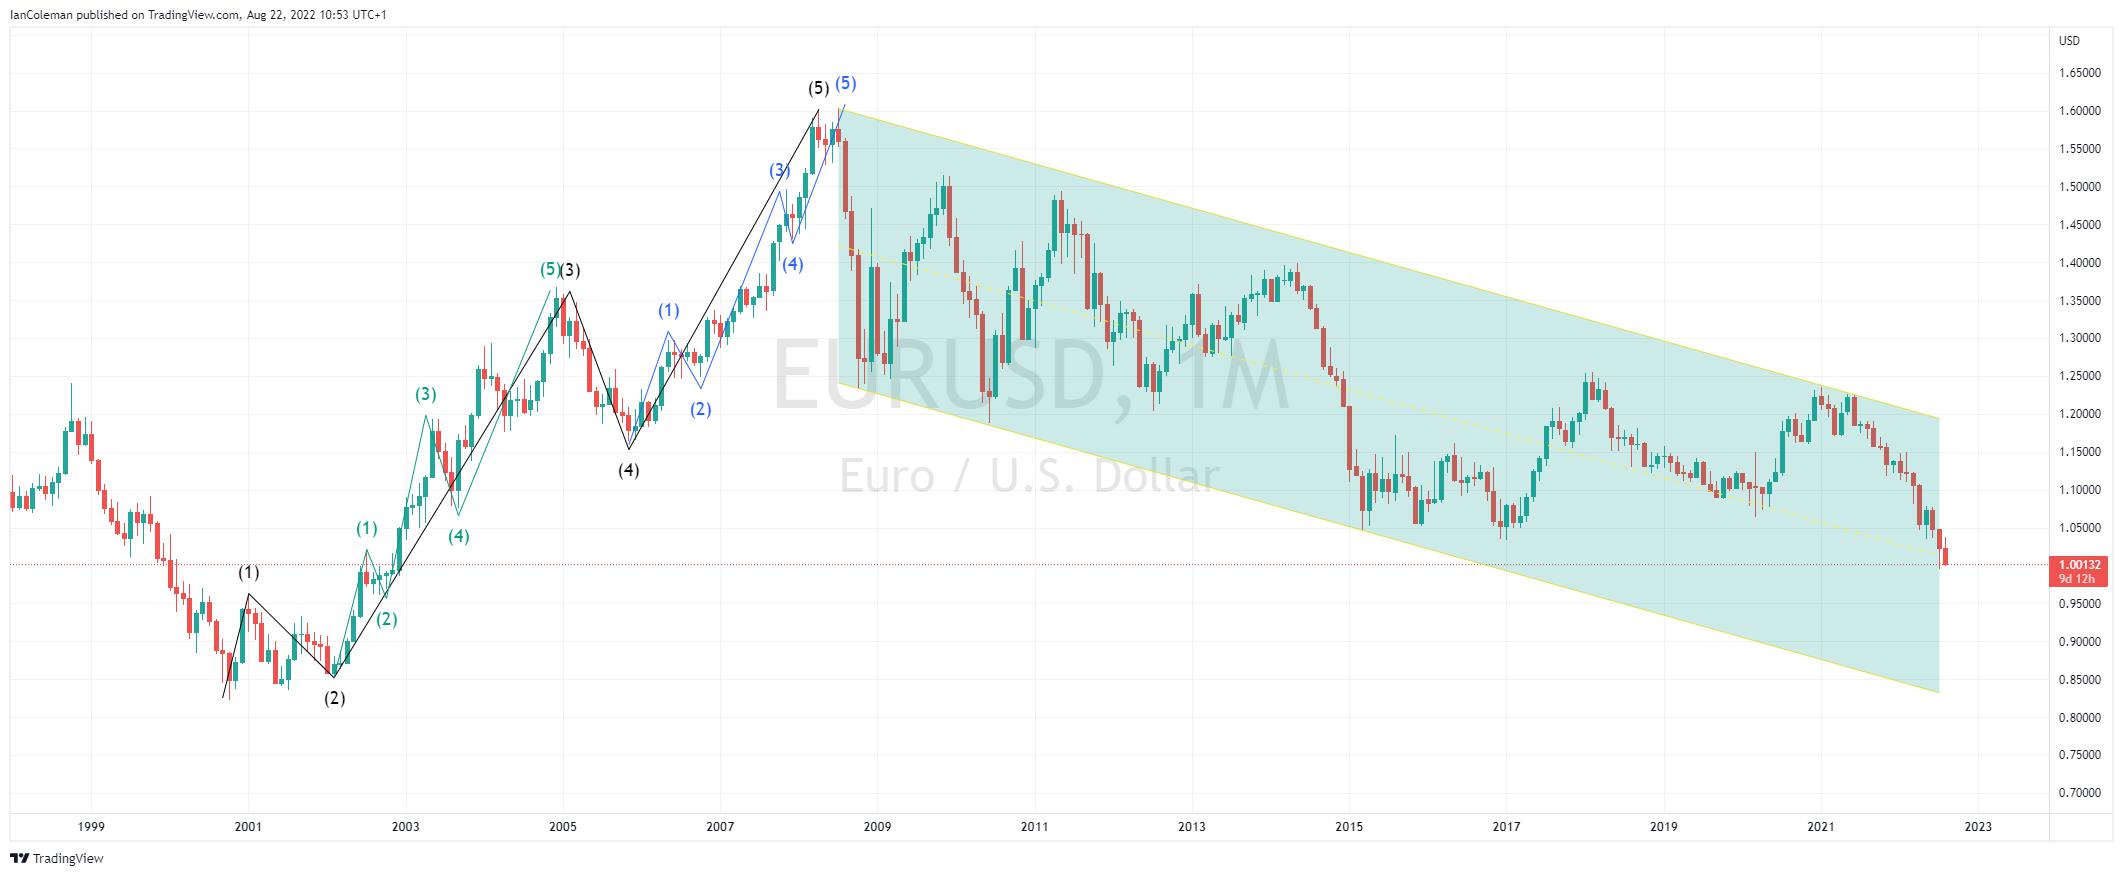
Figure 4 Trading View EURUSD positive Elliott Wave Count
Note how the downside moves can be counted in three waves (A-B-C). This choppy price action is common in corrective cycles.
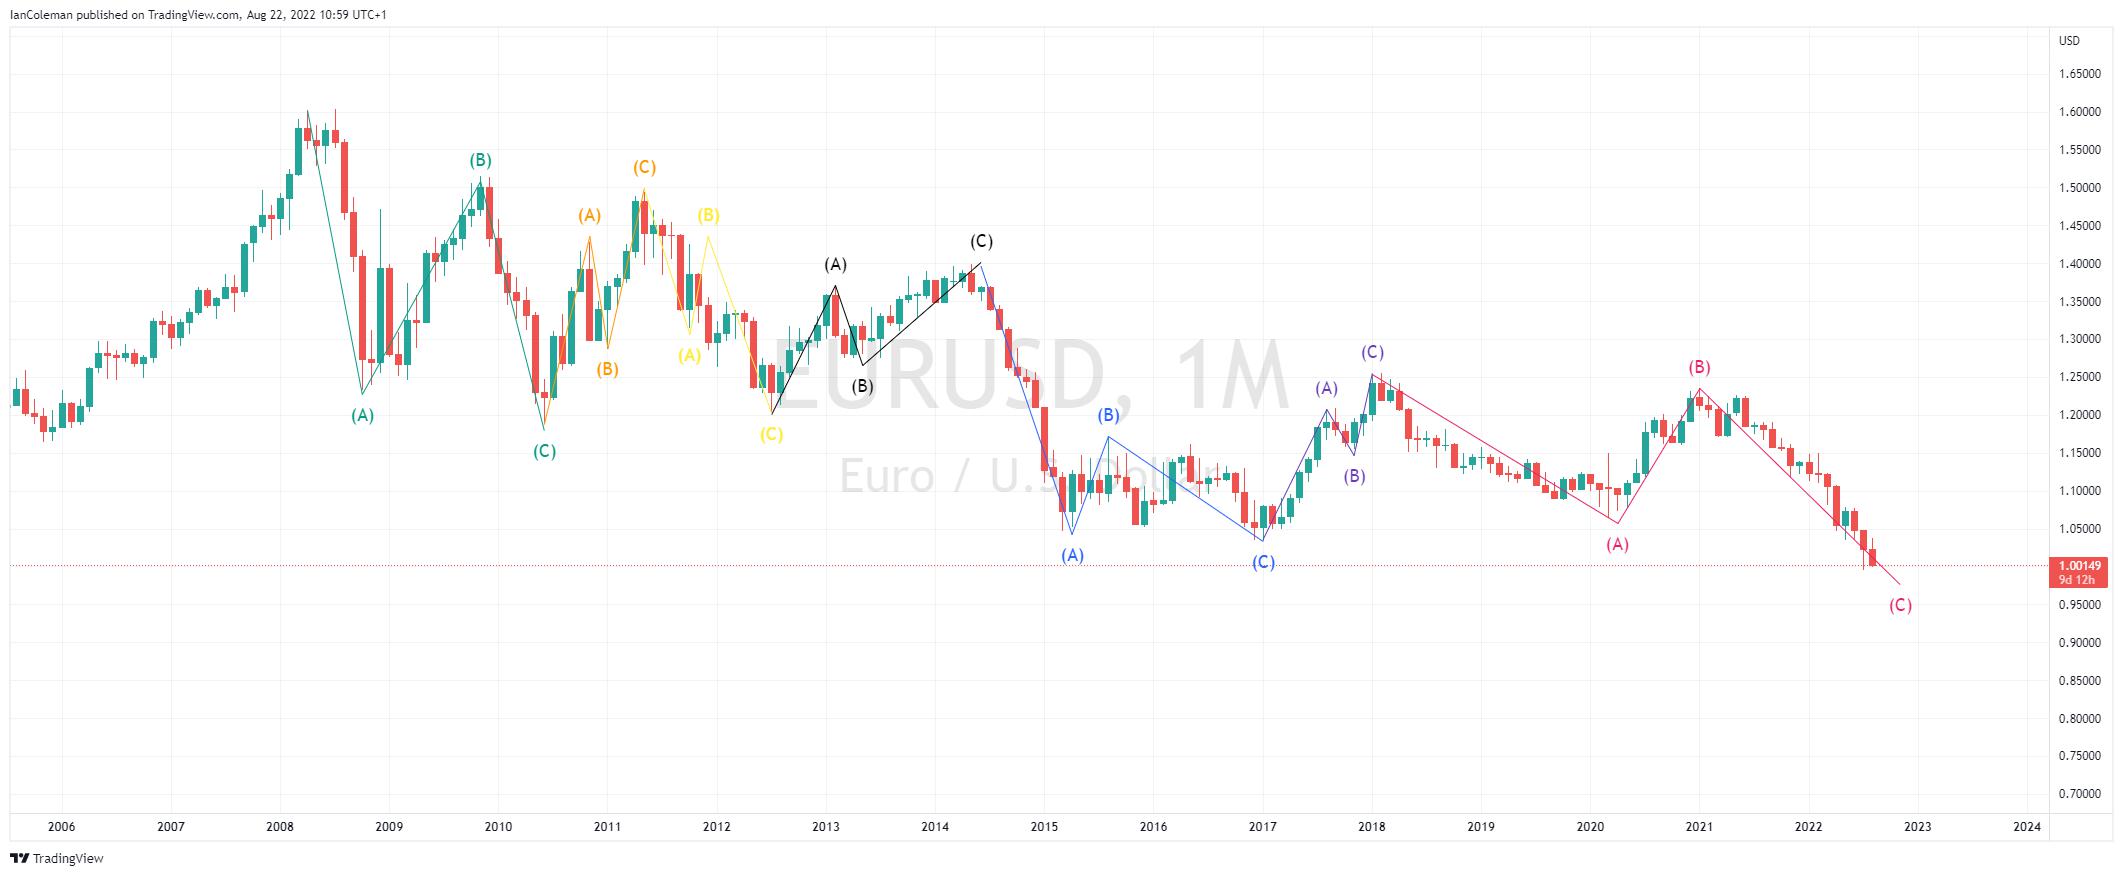
Figure 5 Trading View EURUSD complex correction
What was support, now becomes resistance. The previous swing low at 1.0462 (from 2015) is likely to form a substantial barrier and offer further downside pressure for the EURUSD forecast.
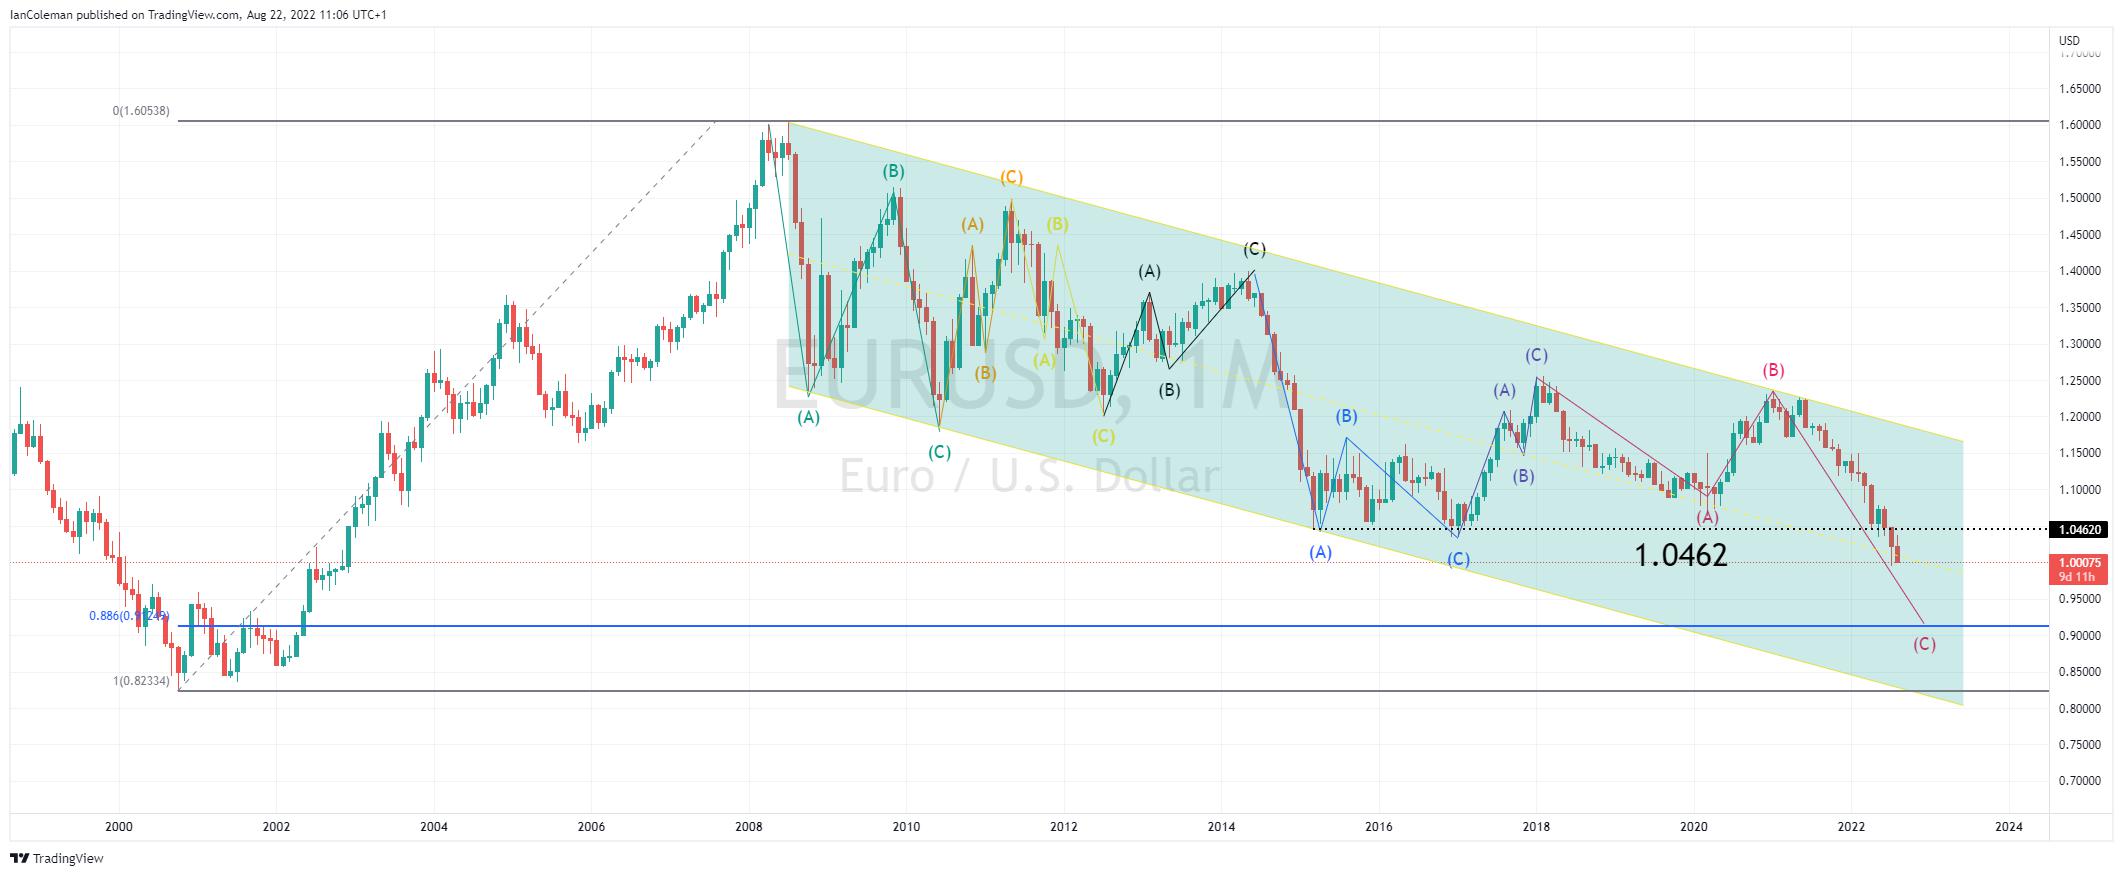
Figure 6 Trading View EURUSD 1.0462 barrier
Linking in with the DXY negative short term bias, there is scope for a correction higher in EURUSD.
A look at the 4-hour chart highlights a possible Gartley formation. If the swing low of 0.9952 holds, then we could see a correction higher to the Fibonacci confluence area of 1.0474-79.
This is just above the solid medium-term barrier at 1.0462.
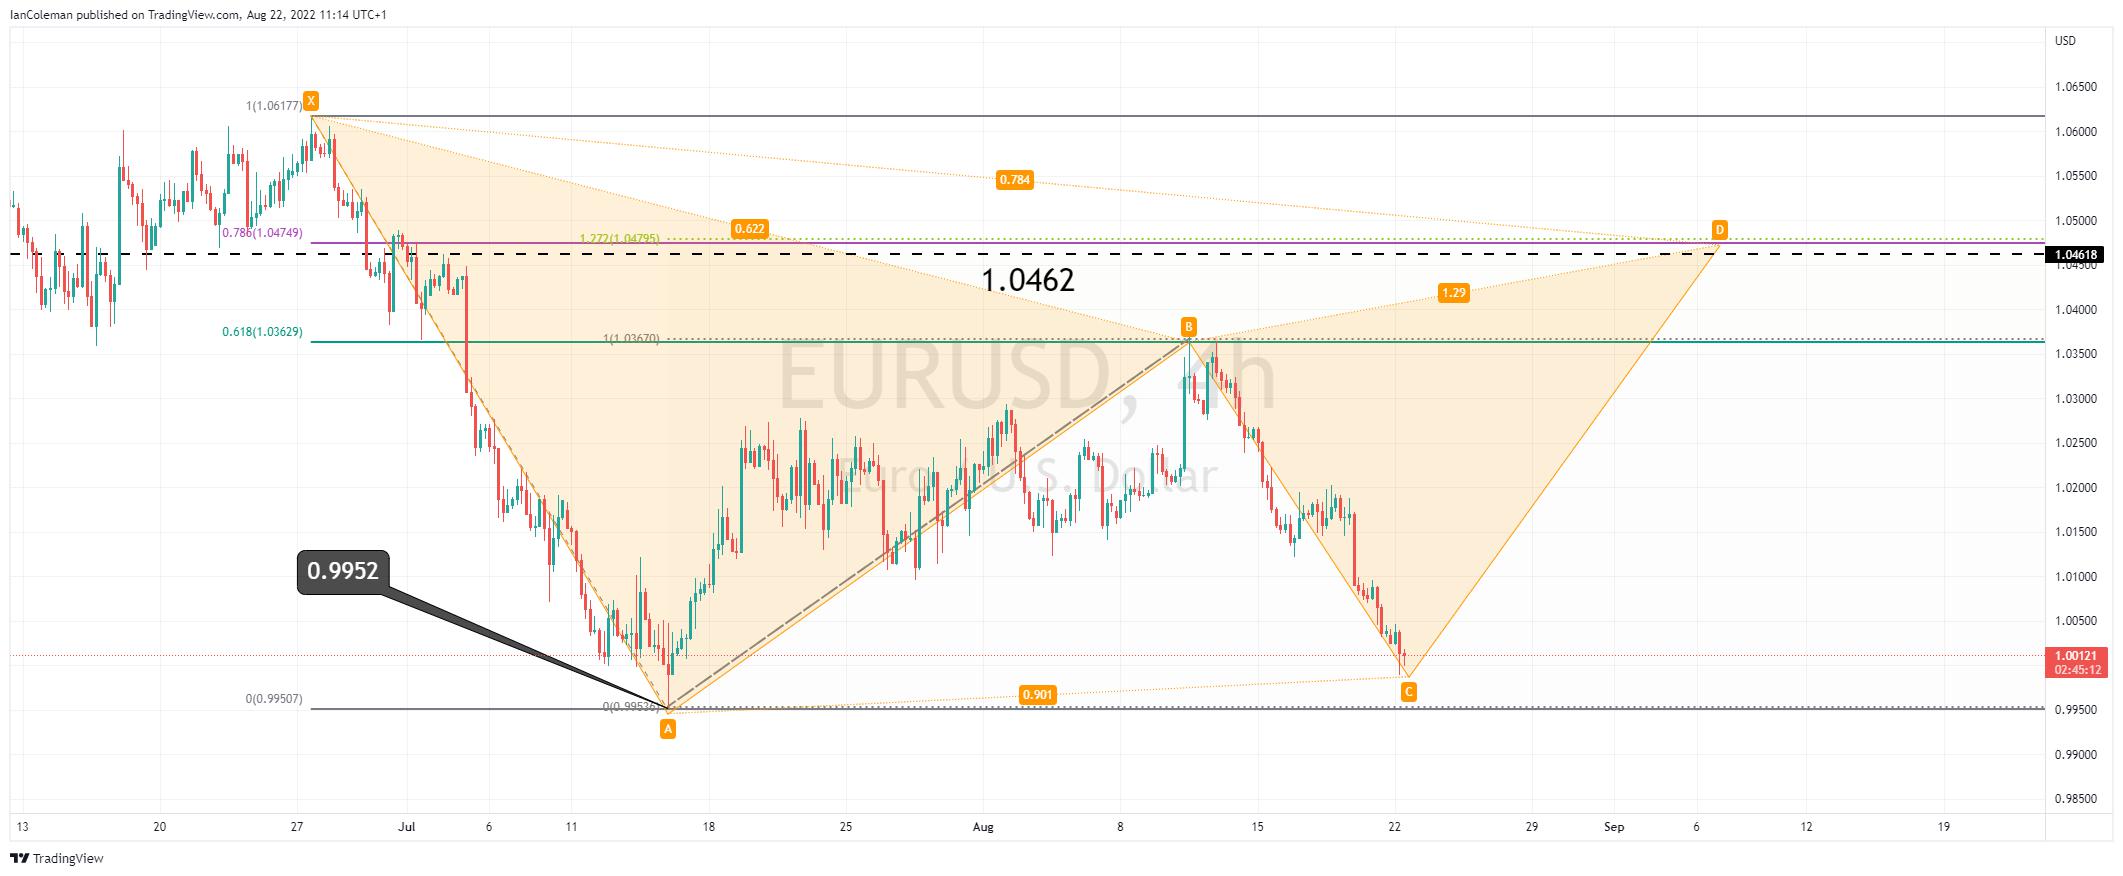
Figure 7 Trading View EURUSD Gartley formation
The material provided here has not been prepared in accordance with legal requirements designed to promote the independence of investment research and as such is considered to be a marketing communication. Whilst it is not subject to any prohibition on dealing ahead of the dissemination of investment research we will not seek to take any advantage before providing it to our clients.
Pepperstone doesn’t represent that the material provided here is accurate, current or complete, and therefore shouldn’t be relied upon as such. The information, whether from a third party or not, isn’t to be considered as a recommendation; or an offer to buy or sell; or the solicitation of an offer to buy or sell any security, financial product or instrument; or to participate in any particular trading strategy. It does not take into account readers’ financial situation or investment objectives. We advise any readers of this content to seek their own advice. Without the approval of Pepperstone, reproduction or redistribution of this information isn’t permitted.