Day trading strategies for Australian traders
At Pepperstone these strategies can only be traded using CFDs and margin forex contracts for margin forex. Day trading involves buying and selling financial instruments on the same trading day to take advantage of short-term price movements.
Written by: Ioan Smith | Expert Financial Writer
Day traders often build strategies using technical and fundamental analysis to enter and exit trades closing all positions on the same day to avoid overnight risk.
Why do traders choose day trading?
People choose day trading for a number of very different reasons.
- Quick Profits: Potential to make quick profits by capitalising on small price movements within a single trading day.
- Avoid Overnight Risk: Zero exposure to market movements or news events that could impact prices after market hours.
- Leverage: Ability to use leverage to enhance gains (and losses).
- Frequent Opportunities: Numerous trading opportunities on a daily basis as a result of volatility.
- Independence: Flexible work schedule and financial independence.
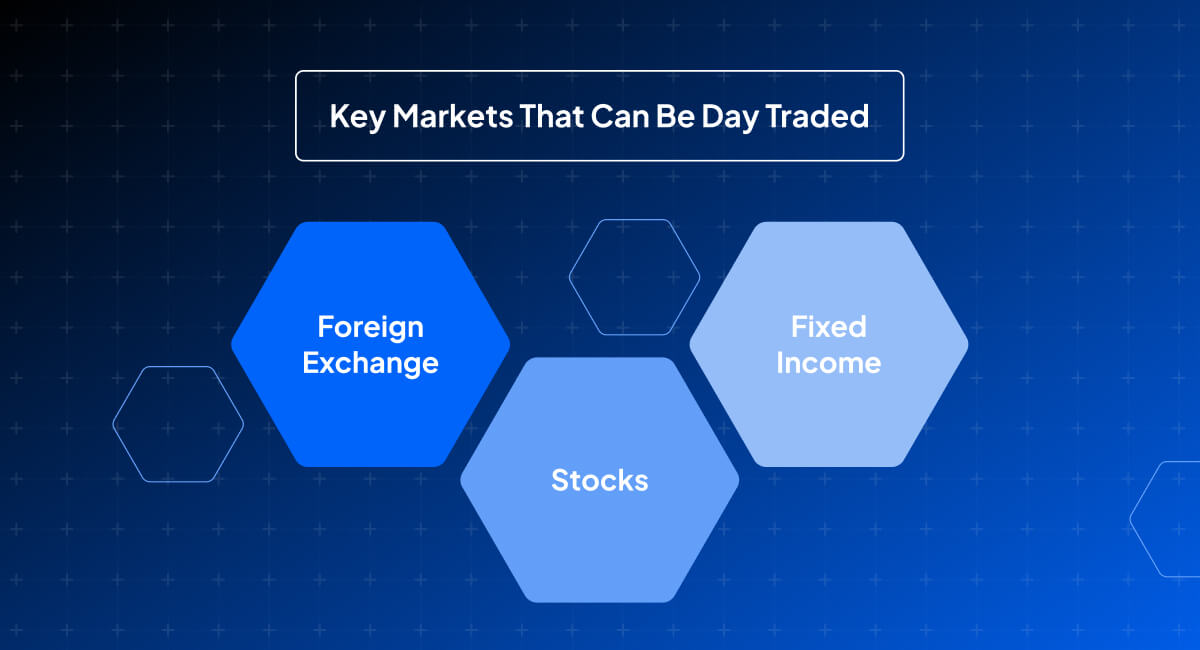
What markets can be day traded?
Day trading can be undertaken in various financial markets, each offering unique opportunities and characteristics. Day traders choose markets based on individual preferences, risk tolerance, and expertise. The key markets that can be day traded include:
- Share CFDs: Trading share CFDs of individual companies listed on share CFD exchanges.
- Day Trading Characteristics: High liquidity and varying degrees of volatility.
- Foreign Exchange: Currency pairs in the foreign exchange market like EURUSD, GBPUSD and USDJPY.
- Day Trading Characteristics: Very high liquidity, 24-hour market, easily impacted by economic data and geopolitical events.
- Fixed Income: Government and corporate bonds.
- Day Trading Characteristics: Lower volatility compared to share CFDs, influenced predominantly by interest rates and economic conditions.
How do I choose the best share CFDs for day trading?
Choosing the best share CFDs to day trade involves several key factors to maximise potential gains and manage risk effectively:
- Liquidity - Select share CFDs with high average daily trading volumes. This ensures sufficient liquidity, allowing trades to be entered and exited quickly without significant change in price. Higher liquidity typically results in tighter bid-ask spreads, reducing trading costs.
- Volatility - Focus on share CFDs with significant intraday price movement characteristics. Higher volatility offers more opportunities to profit from short-term price fluctuations, but is not guaranteed. Indicators like ATR (Average True Range) measure volatility. Share CFDs with higher ATR values are more volatile and thus suitable for day trading. The standard setting for ATR is 14, which means it will measure the volatility of a share CFD price based on the 14 most recent trading sessions. Using an ATR setting lower than 14 makes the indicator more sensitive and produces a less smooth moving average line.
- News Catalysts - Share CFDs with scheduled or recently released earnings reports often experience increased volatility and trading volume. Share CFDs in the news due to any corporate action like mergers, acquisitions, product launches or regulatory changes can trigger substantial price movements.
- Technical Patterns - Technical analysis identifies share CFDs forming recognisable patterns like breakouts, reversals, or consolidations which can offer potential entry and exit points. Indicators such as Moving Averages, RSI, MACD and Bollinger Bands help to identify trend direction and overbought or oversold conditions. (More below)
- Risk Tolerance - Choose share CFDs that align with risk tolerance and trading style. Higher volatility share CFDs can offer greater rewards but also come with increased risk.
What are common day trading strategies?
There are a number of common day trading strategies with each requiring specific skills and risk management techniques. Common day trading strategies include:
- Scalping - Making multiple small trades to capture tiny price movements often executed within minutes or seconds.
- Momentum - Trading assets showing strong upward or downward trends, often driven by news or earnings reports.
- Breakout - Entering trades when price moves outside a defined support or resistance level on increased volume in anticipation of continued extension.
- Reversal - Identifying potential price direction changes and trading against the trend.
- Range - Buying and selling at support and selling at resistance within a defined often predictable price range.
- News-Based - Trading based on market-moving news events.
See Pepperstone’s Day Trading Strategies (Beginner) for more information.
How do you develop a day trading strategy?
Developing a day trading strategy involves understanding market trends, using technical analysis tools, managing risk, and backtesting methods to create a disciplined approach for consistent day trading.
How do market cycles affect day trading?
Market cycles, like economic cycles, produce periods of expansion, peaks, contractions and troughs, all of which can significantly impact day trading.

Source: Economic cycles: Investing through boom and bust
Understanding these cycles can assist day traders adjust strategies to adhere to trading goals. Here’s how each phase can impact day trading:
Expansion (Bull Market)
- Key Characteristics: Rising share CFDs prices, increasing economic activity and strong investor confidence.
- Impact on Day Trading: More opportunities for long trades as share CFDs prices generally trend upward. Strong momentum and breakouts can also become more frequent.
- Strategy Adjustments: Dip buying and riding upward trends predominant themes. Momentum indicators and trend-following strategies are key considerations for this phase of the cycle.
Peak
- Key Characteristics: Market reaches its highest point, investor optimism peaks, but evidence of overvaluation and slowing growth begin to appear.
- Impact on Day Trading: Increased volatility as the market becomes uncertain. Potential for sharp reversals and erratic price movement.
- Strategy Adjustments: More cautious approach to initiating long positions. Profit taking and increased preparation for short opportunities. Technical indicators identify overbought conditions.
Contraction (Bear Market)
- Key Characteristics: Falling share CFD prices, declining economic activity and rapidly declining or negative investor sentiment.
- Impact on Day Trading: More opportunities for short trades as share CFD prices trend down. Increased volatility provides more trading opportunities, but also higher risk.
- Strategy Adjustments: Rallies are shorted and more breakdown opportunities arise. Technical indicators identify oversold conditions and potential reversals.
Trough
- Key Characteristics: Market hits its lowest point, economic indicators start to improve and investor sentiment begins to recover.
- Impact on Day Trading: Mixed opportunities as the market searches for a bottom. Potential for sharp reversals and volatile price swings.
- Strategy Adjustments: Increased caution with more time dedicated to screening for evidence of a market bottom. Range-bound trading strategies become more prevalent and increased preparedness to switch to long positions as the market starts to recover.
What tools are essential for day trading?
Day trading is fast-paced and very demanding, requiring a combination of tools to make informed decisions, execute trades efficiently and manage risks. All the tools listed below combine to help day traders analyse markets, execute trades efficiently, and manage investments effectively. The specific choice of tools can vary based on personal preferences, trading style, and the markets being traded.
Trading platform
- Features: Real-time data feeds, charting tools, order execution capabilities, and customisable interfaces. Alerts for specific trading signals or news events that might affect the market. Order management tools, including limit orders, stop orders, and trailing stops. Tools for setting stop-loss orders, monitoring risk-reward ratios and managing portfolio exposure.
- Example: MetaTrader 4/5. See Peppertsone’s Learn MetaTrader 5, in Five Minutes. Full MT5 Walkthrough
Brokerage account
- Features: Low commissions, fast order execution, and access to a wide range of markets and instruments. See Pepperstone’s suite of brokerage accounts to compare with the broader brokerage market.
Real-Time Market Data Feed
- Features: Real-time data on price movements, volume and other market metrics.
- Examples: Bloomberg, Reuters Eikon or broker data services.
Charting Software
- Features: Technical analysis tools, indicators and chart patterns.
- Example: TradingView
News Feed Services
- Features: Real-time news and alerts relevant to financial markets.
- Examples: Bloomberg News, CNBC, Reuters. To get access to news feeds with timely data releases. Free aggregation platforms like PiQ offer over 100 sources of information from the likes of Reuters and Bloomberg.
Economic Calendars
- Features: Scheduled economic events, earnings reports, and other significant market events.
- Examples: Pepperstone provides a free comprehensive calendar with user-friendly charts to help analyse trends.
Trade Journal
- Features: Record-keeping for trades, performance tracking and analysis of trading strategies.
- Examples: Manual spreadsheets, automated trading journals like Edgewonk or TraderSync or a free online trading journal such as TradeBench.
Internet Connection & computing equipment
- Stable and ultrafast internet speeds to ensure reliable access to trading platforms and data feeds.
- Powerful computers or laptops with enough processing power to handle multiple applications and real-time data.
Education and Research Resources
- Attend trading courses, webinars and study research reports to continuously improve trading knowledge and skills.
What are the most useful technical indicators for day trading?
Using technical indicators can help day traders make quick, informed decisions based on price movements and market conditions. Here are five of the most useful indicators to consider for day trading:
- Moving Averages (MA):
- Simple Moving Average (SMA), Exponential Moving Average (EMA)
- Method: Moving Averages smooth out price data to identify trends and potential support or resistance levels. The EMA, with its greater weight on recent prices, is particularly useful for day trading due to its responsiveness to recent price changes.
- Application: Identifies direction of a trend and generates buy or sell signals when shorter-term MAs cross longer-term MAs and vice versa.
- Relative Strength Index (RSI):
- A momentum oscillator that measures the speed and change of price movements and is measured on a scale of 0 to 100.
- Method: RSI helps identify overbought or oversold conditions. Values above 70 typically indicate overbought conditions, while values below 30 indicate oversold conditions.
- Application: Identifies potential reversals and confirms trends by comparing the magnitude of recent gains to recent losses.
- Moving Average Convergence Divergence (MACD):
- MACD Line, Signal Line, Histogram
- Method: MACD is a trend-following momentum indicator that shows the relationship between two moving averages of a security’s price. The MACD Line is calculated by subtracting the 26-day EMA from the 12-day EMA. The Signal Line is a 9-day EMA of the MACD Line.
- Application: Identifies bullish or bearish trends, as well as potential buy and sell signals via crossovers between the MACD Line and the Signal Line.
- Bollinger Bands:
- Middle Band (SMA), Upper Band, Lower Band
- Method: Bollinger Bands consist of a middle band (normally a 20-day SMA) and two outer bands that are usually 2 standard deviations away from the middle band.
- Application: When prices touch the upper band, it may indicate overbought conditions, while touching the lower band may indicate oversold conditions. Bands that are widening suggest increasing volatility, while narrowing bands indicate decreasing volatility.
- Volume:
- Measures the number of share CFDs or contracts traded in a security or market.
- Method: Analysing volume helps confirm trends and identify potential reversals. High volume often indicates strong interest and can validate price movements, while low volume might suggest a lack of conviction.
- Application: Volume can be used in conjunction with other indicators (like Moving Averages or RSI) to confirm signals and gauge the strength of price movements.
Many day traders use a combination of these indicators to increase the probability of making successful trades. For example, combining Bollinger Bands with RSI (see chart below) can help confirm trends and spot potential reversal points. It's also crucial to backtest any combination of indicators on historical data to ensure they fit the desired trading strategy and risk tolerance. Each indicator has its strengths and weaknesses, and their effectiveness can vary depending on the market conditions and the specific asset being traded.
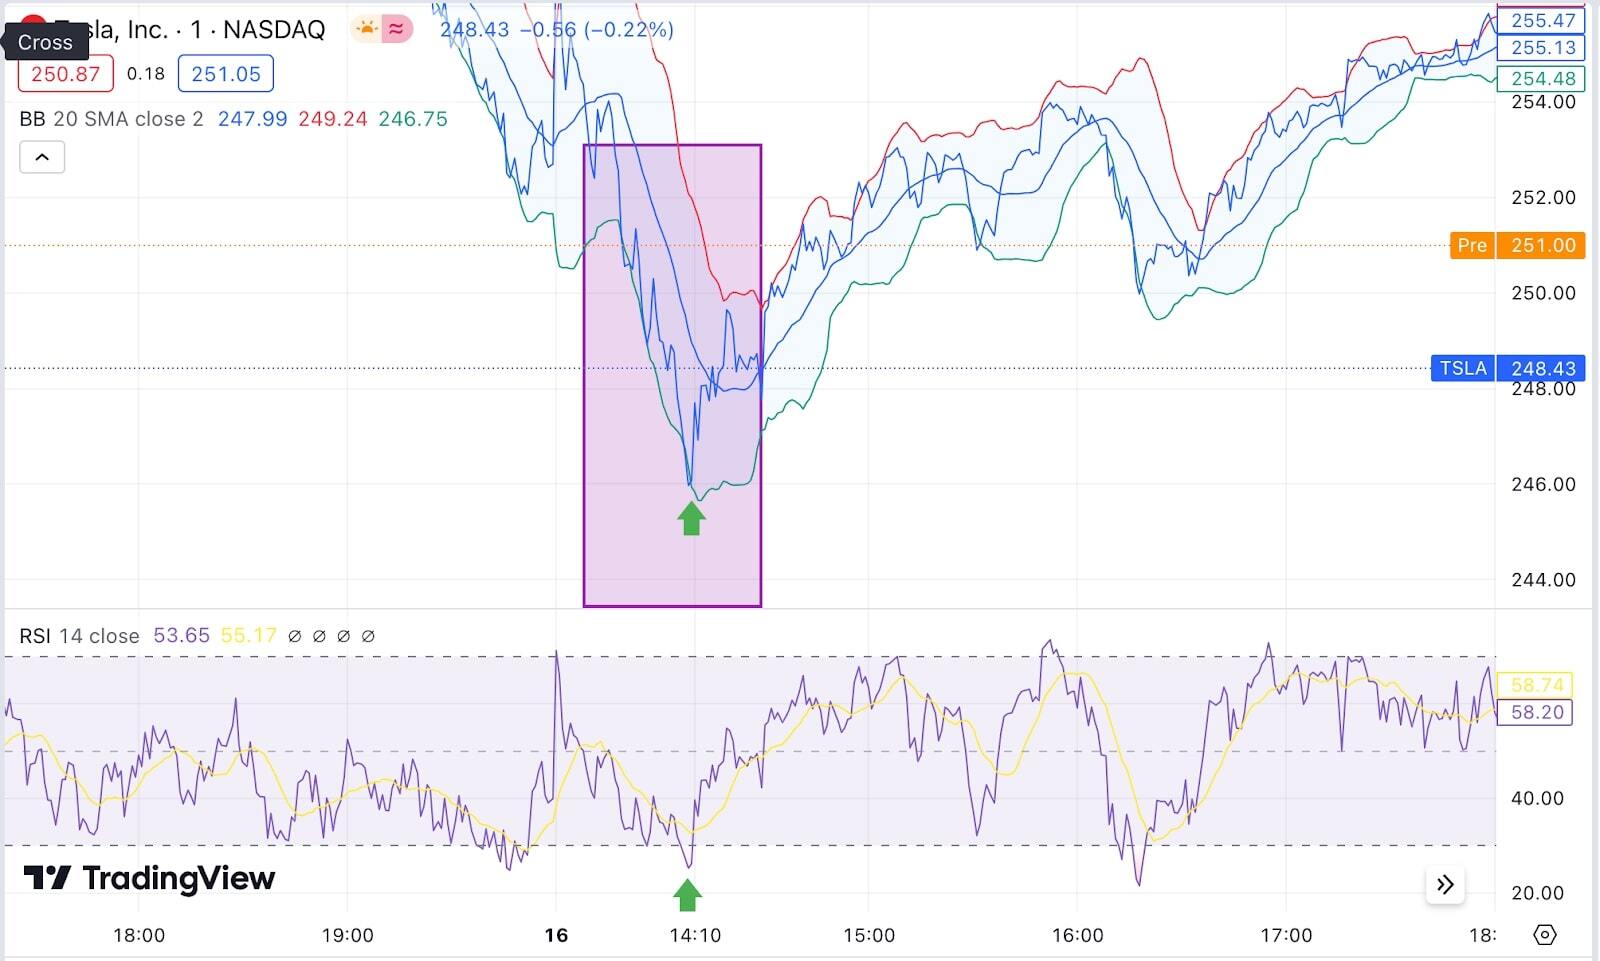
A more detailed guide to all the Trading Indicators mentioned above.
How do trading simulators work?
Trading simulators like Pepperstone’s own Trading Simulator are tools designed to help traders practice and refine trading strategies in a risk-free environment. The simulator allows traders to practice trading with virtual funds, enabling them to test strategies, learn how markets function, and get familiar with the trading platform without risking real money. It is typically available to users who have a Pepperstone account. It might be integrated into their trading platforms or offered as a standalone tool.
A key feature of a trading simulator is real-time market data allowing users to simulate trading under live market conditions. Some simulators also offer access to historical data so that users can test their strategies over different time periods. Simulators typically have a user interface similar to live trading platforms to help reduce the learning curve.
Performance tracking allows traders to review performance, identify strengths and weaknesses, and adjust strategies accordingly. Using a trading simulator is a valuable step in developing trading skills and testing strategies in a controlled environment.
How to manage risk in in day trading?
Risk management involves strategies to protect capital and minimise potential losses while maximising gains. Key techniques include setting strict stop-loss orders to limit individual trade losses, using position sizing to control the amount of capital risked per trade, and diversifying trades to avoid overexposure to a single asset.
Traders should also establish daily loss limits to prevent significant drawdowns, regularly review and adjust strategies, as well as maintain emotional discipline to avoid impulsive decisions. Effective risk management helps ensure long-term profitability and safeguards against market volatility and unpredictable price movements.
How to use stop-loss orders in day trading?
A stop-loss order helps avoid large losses by automatically selling the share CFD when it hits a predetermined price. This discipline is crucial in day trading, where rapid price movements can lead to significant losses if not managed properly.
Hypothetical example: TESLA INC, (TSLA)
Based on analysis, it is believed TSLA will RISE, so a BUY order for 100 shares is placed at $240.
- Stop-Loss Placement: Determine that a 3% loss for example is acceptable based on risk tolerance. For TSLA at $240, -3% would be $232.80. So the stop-loss order is set at $232.80. (A conditional order that will automatically trigger a sell order at market if the share CFD reaches or falls below $232.80)
- Execution:
- Initial Order: BUY 100 share CFDs of TSLA at $240.
- Stop-Loss Order: Stop-loss order to SELL IF the price falls to $232.80.
- Outcomes:
- If TSLA RISES to $250.00, the stop-loss order remains inactive. The stop-loss is adjusted to a higher level (e.g. $242.50) to lock in a small profit if the position is to remain open. Also known as a trailing stop.
- If TSLA FALLS to $232.80, the stop-loss order activates, and 100 share CFDs are SOLD at the prevailing market price. The loss limited to approximately 3% of initial investment.
.jpg)
How to manage emotions in day trading?
Managing emotions is essential to maintain discipline and avoid making irrational decisions. Key strategies to manage emotions effectively include:
- Trading Plan - Create a comprehensive trading plan that includes entry and exit criteria, risk management rules and trading goals.
- Benefit: A well-defined plan provides a structured approach, reducing emotional decision-making.
- Risk Management Rules - Establish clear and rigid rules for position sizing, stop-loss orders and maximum daily loss limits.
- Benefit: These rules enable strict adherence to the strategy and prevent large losses that can trigger an emotional reaction.
- Maintain a Trading Journal - Record each trade, including reasoning, execution and eventual outcome.
- Benefit: Reviewing trades helps traders learn from mistakes and reinforce disciplined behaviour.
- Take Regular Breaks - Schedule breaks throughout the trading day to step away from the screen.
- Benefit: Breaks help to maintain focus and prevent fatigue-induced emotional decision-making.
- Accept Losses as Part of Trading - Recognise that losses are inevitable and part of the overall day trading process.
- Benefit: Accepting losses helps avoid emotional reactions and stick to predetermined strategies.
Day trading FAQs
What is a day trading journal and why is it important?
A day trading journal is a record of all trades, including entry and exit points, rationale behind entering the trade and the final outcome. It is important for analysing performance, identifying patterns, and improving strategies by learning from both successes and mistakes.
How can I improve my day trading skills?
To improve day trading skills, focus should be on continuous learning through market analysis, backtesting strategies, and reviewing trading performance. Using a demo account to practice regularly, stay updated on market news, and refine risk management are all important. Emphasising discipline, emotional control, and learning from mistakes will enhance overall trading effectiveness.
What are the common mistakes made by beginner day traders?
Common mistakes by beginner day traders include overtrading, inadequate risk management, chasing losses, and lack of a clear strategy. Emotional trading, such as reacting impulsively to market fluctuations, and failing to maintain discipline or proper record-keeping also contribute to poor trading outcomes.
How does news impact day trading?
News impacts day trading by causing sharp price movements which can result in increased volatility. The reporting of economic data, corporate earnings and geopolitical events can lead to rapid changes in asset prices. Day traders should stay updated on news to anticipate and react to market shifts, using it to manage trades and mitigate risk.
What is the importance of liquidity in day trading?
Liquidity is crucial in day trading as it ensures swift entry and exit of positions without significantly impacting an asset's price. High liquidity means tighter bid-ask spreads, lower trading costs, and less slippage (the difference between expected and actual trade prices). Adequate liquidity also allows for easier execution of large trades and helps manage risk more effectively by enabling execution close to or at target prices.
What are the key factors to consider when choosing a trading platform?
When choosing a trading platform, consider the following factors:
- Ease of Use: Intuitive interface and user-friendly design to facilitate efficient trading and analysis.
- Features and Tools: Availability of advanced charting tools, technical indicators, and real-time data for effective analysis.
- Order Execution: Speed and reliability of trade execution to ensure timely order placement and minimise slippage.
- Fees and Commissions: Costs associated with trading, including commissions, spreads, and any additional fees, which impact overall profitability.
- Accessibility: Compatibility with numerous devices like desktops, mobile phones, tablets and operating systems, allowing for mobile trading.
- Integration: Ability to integrate with other tools and platforms for enhanced functionality and convenience.
- Regulatory Compliance: Platform should comply with relevant financial regulations to ensure trustworthiness and legality.
- Security: Robust security measures to protect personal and financial information.
- Customer Support: Quality and availability of customer service to address technical issues and provide assistance.
Disclaimer: The material provided here has not been prepared in accordance with legal requirements designed to promote the independence of investment research and as such is considered to be a marketing communication. Whilst it is not subject to any prohibition on dealing ahead of the dissemination of investment research we will not seek to take any advantage before providing it to our clients. Pepperstone doesn’t represent that the material provided here is accurate, current or complete, and therefore shouldn’t be relied upon as such. The information, whether from a third party or not, isn’t to be considered as a recommendation; or an offer to buy or sell; or the solicitation of an offer to buy or sell any security, financial product or instrument; or to participate in any particular trading strategy. It does not take into account readers’ financial situation or investment objectives. We advise any readers of this content to seek their own advice. Without the approval of Pepperstone, reproduction or redistribution of this information isn’t permitted.