Spread bets and CFDs are complex instruments and come with a high risk of losing money rapidly due to leverage. 72% of retail investor accounts lose money when trading spread bets and CFDs with this provider. You should consider whether you understand how spread bets and CFDs work, and whether you can afford to take the high risk of losing your money.
- English (UK)
Oil spikes 7% as traders react to new US and EU sanctions on Russia


Summary
- The Trump administration blacklisted Russian Oil giants Rosneft and Lukoil, the two largest Russian Oil producers.
- The EU adopted a raft of new sanctions aimed at hurting Russia’s energy infrastructure including a transaction ban on Rosneft and Gazprom.
- Impact: WTI spiked 7% to 62.624 high, Brent Jumped 6.2% to 66.173 high, Commodity/Energy sector heavy UK 100 Hit New Record at 9602
Why has oil been falling?
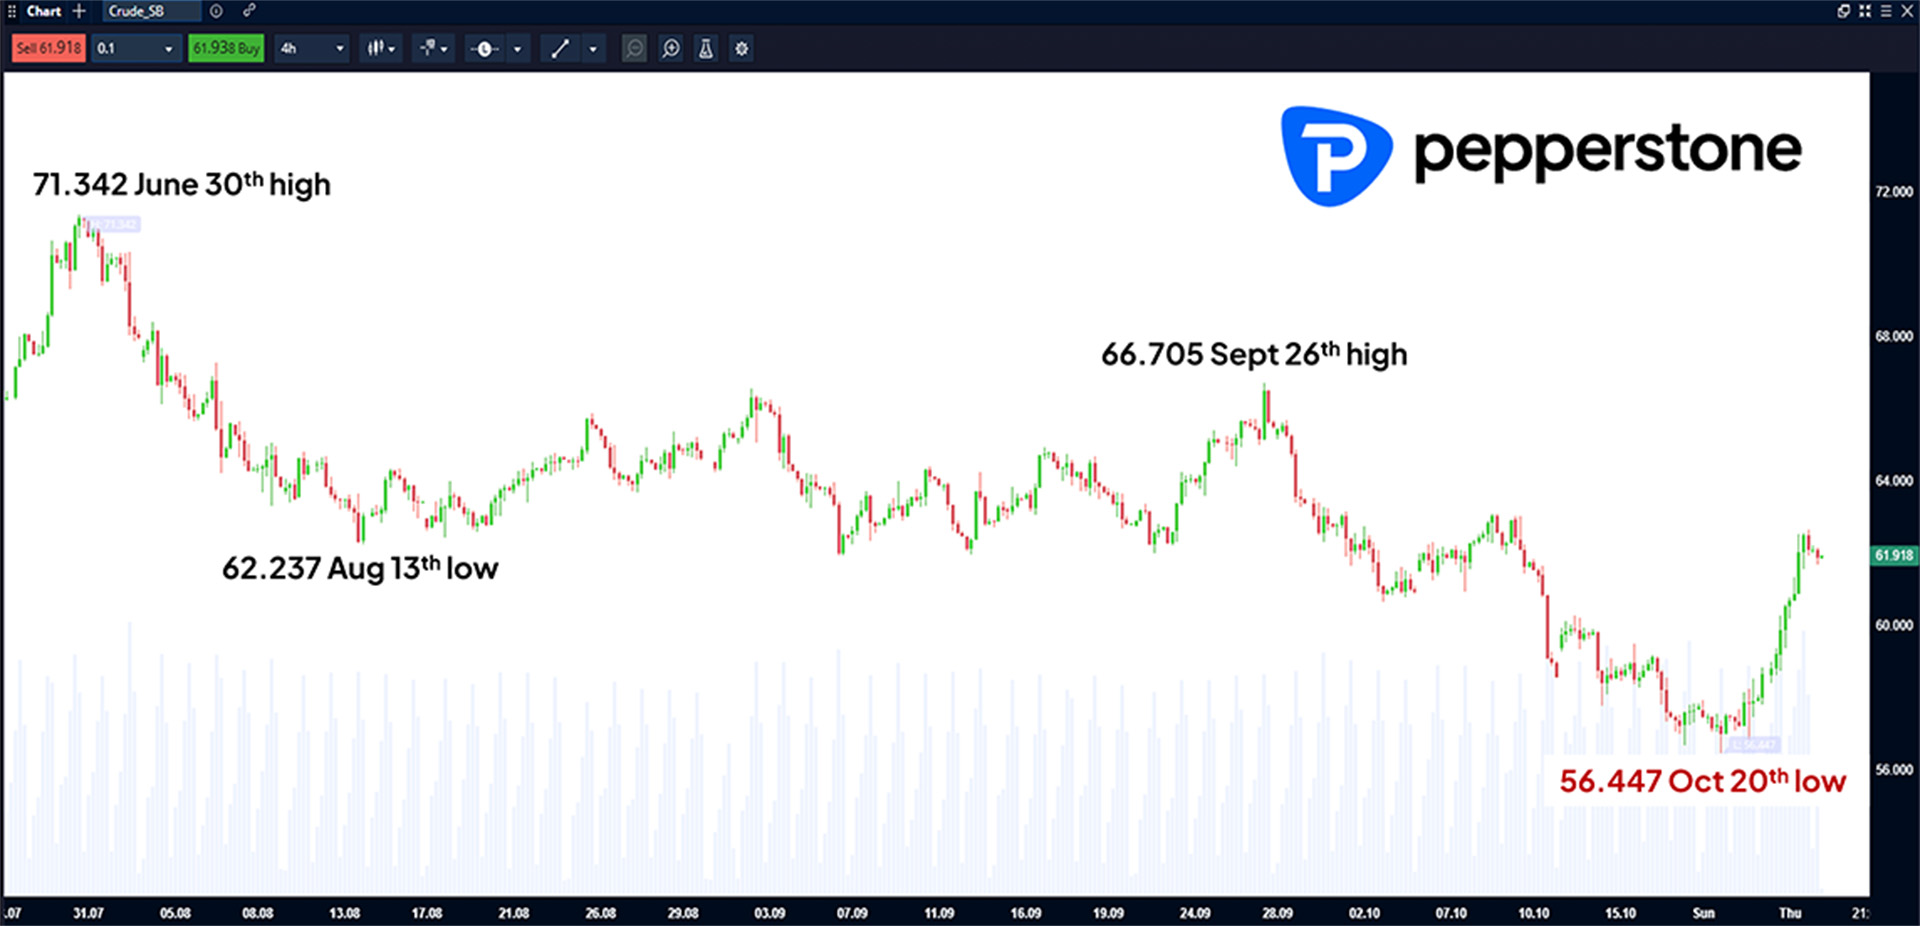
Oil producing countries, including the powerful OPEC+ alliance, which includes Saudi Arabia and Russia, have been steadily increasing production at a time when global demand has potentially stalled due to slower global growth and trade tensions. Traders have been selling rallies and accumulating larger short positions, helping Oil prices to trend lower since a peak of 71.342 was registered on June 30th. This down move culminated in a 6-month low being seen on Monday October 20th at 56.447. (see 4-hour WTI chart below).
What has happened to oil prices in the last 36 hours?
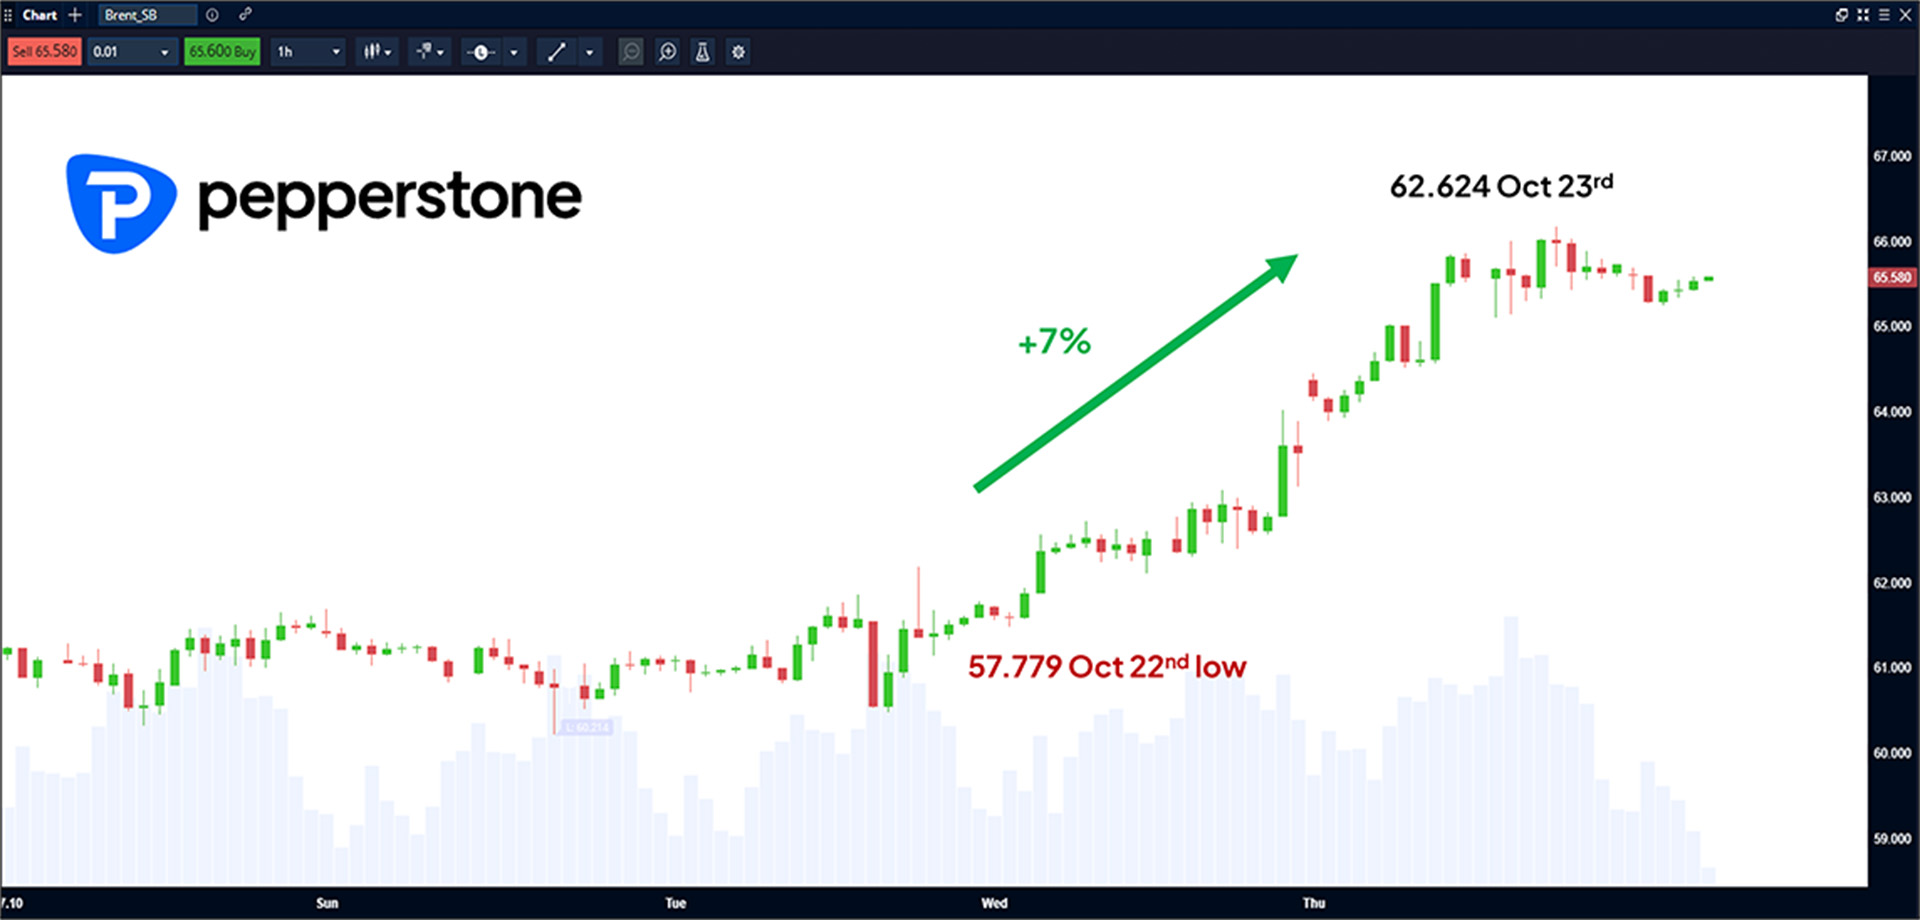
In a significant escalation of policy, the US and EU have applied new strict sanctions on major Russian oil producers and infrastructure suppliers to try and maximise pressure on President Putin and limit his ability to fund the war in Ukraine. These sanctions could severely restrict the supply of oil in the short-term. This new uncertainty has forced traders to cover weak short positions, leading to a spike of 7% in WTI from a low of 57.779 on Wednesday to a high of 62.624 late Thursday evening, while Brent rallied 6% from a low of 61.487 to a high of 66.173 over the same period. (see 1 hour WTI chart below).
What next for oil prices?
After the volatility of the last 36 hours WTI and Brent prices seemed to have stabilised and are both trading slightly lower this morning, however the sensitivity to short term headlines could remain.
WTI 4 hour chart:
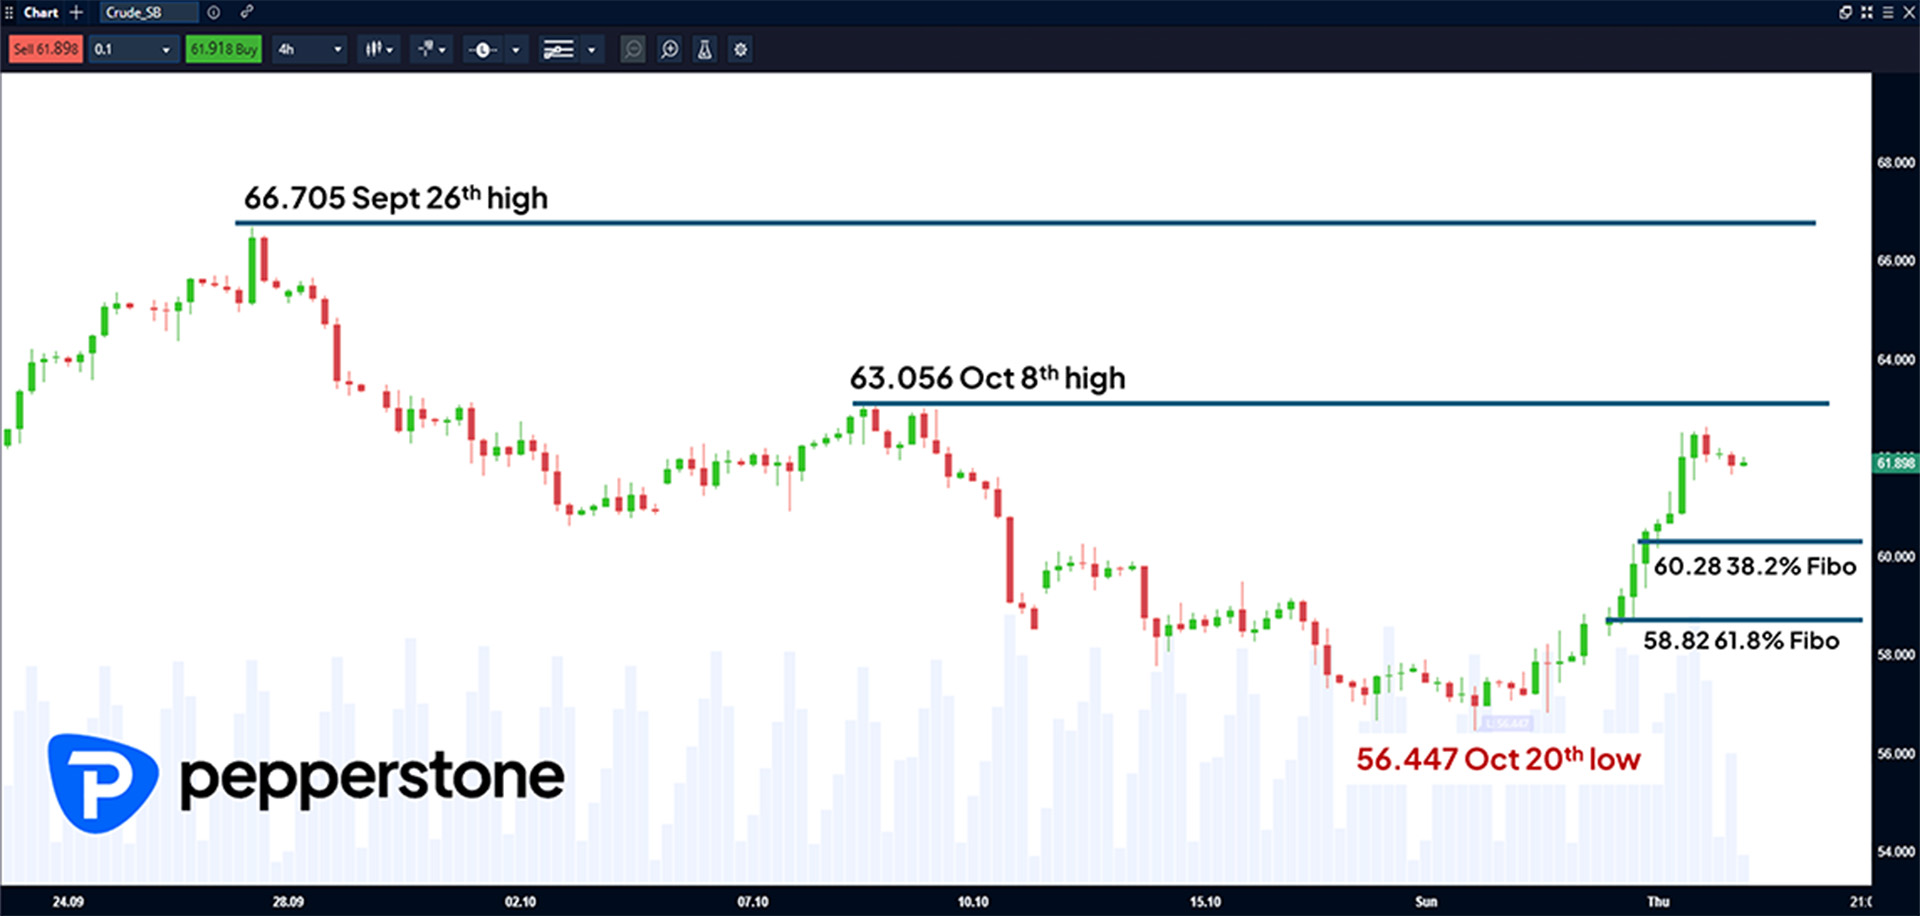
WTI prices topped out ahead of resistance provided by the October 8th high at 63.056. If this level were to break it could open the way for moves towards 66.705, the September 26th high.
On the downside short term support can be found at 60.28, which is the 38.2% Fibonacci retracement from the Monday 20th low to Thursday High. Below this level the 61.8% retracement of the same move stands at 58.82.
Brent technical levels:
Potential resistance: 66.863 (October 9th high), then 70.341 (September 26th high)
Potential support: 63.901 (38.2% retracement 4 hour chart) then 62.493 (61.8% retracement)
Have other markets been impacted by the oil price spike?
The sharp price spike in oil had a knock-on impact for the price of individual commodity and energy companies. The UK 100 is heavily weighted towards these sectors, and the oil spike helped it to briefly print a new record high of 9602.8 yesterday. (See 4-hour UK 100 chart below).
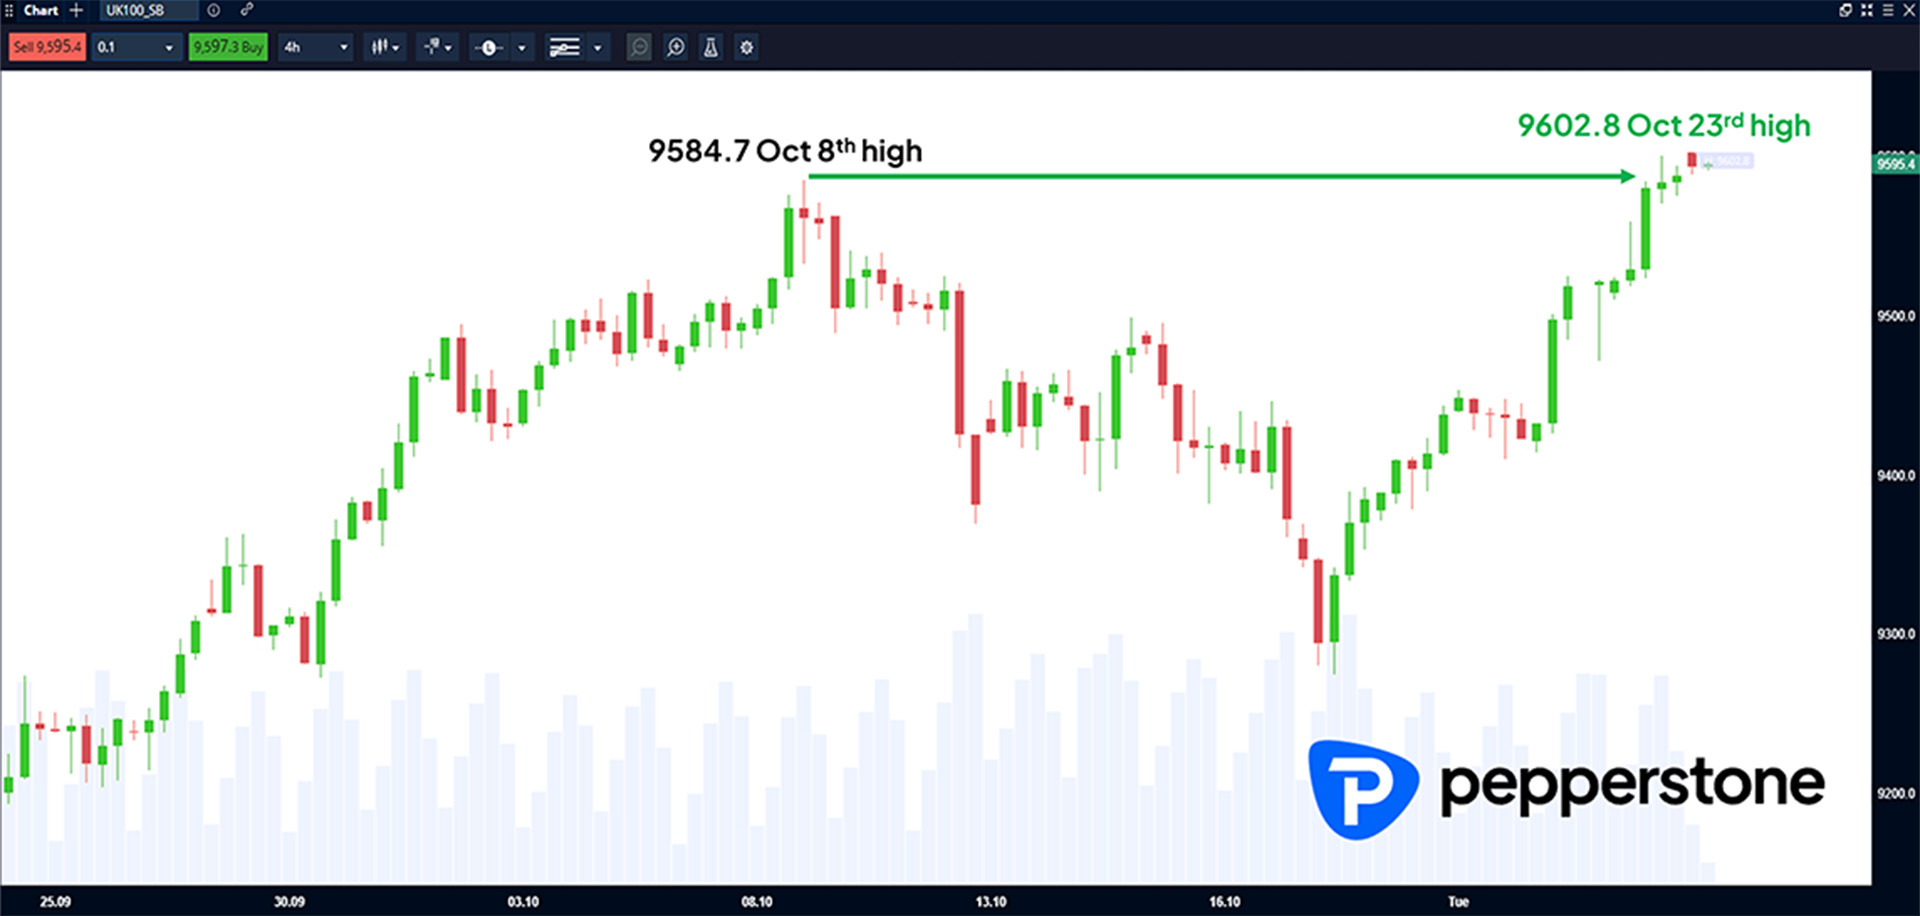
Looking forward, the UK 100 could be one to watch if oil prices extend their moves higher, especially if it can close back above Thursday record at 9602.8.
The material provided here has not been prepared in accordance with legal requirements designed to promote the independence of investment research and as such is considered to be a marketing communication. Whilst it is not subject to any prohibition on dealing ahead of the dissemination of investment research we will not seek to take any advantage before providing it to our clients.
Pepperstone doesn’t represent that the material provided here is accurate, current or complete, and therefore shouldn’t be relied upon as such. The information, whether from a third party or not, isn’t to be considered as a recommendation; or an offer to buy or sell; or the solicitation of an offer to buy or sell any security, financial product or instrument; or to participate in any particular trading strategy. It does not take into account readers’ financial situation or investment objectives. We advise any readers of this content to seek their own advice. Without the approval of Pepperstone, reproduction or redistribution of this information isn’t permitted.