• Home
  • Pro
  • Partners
  • Help and support
  • English (UK)
Pepperstone logo
Pepperstone logo
  • Ways to trade
    • Spread betting

      Bet on global price movements in £ per point

    • CFD trading

      Trade on 1000s of assets without owning them

    • Pricing

      Discover our tight spreads, plus all other possible fees

    • Risk management
    • Trading accounts
    • Demo trading
    • Trading hours
    • 24-hour trading
    • Maintenance schedule
  • Markets
    • Forex

      Get great rates on majors like EUR/USD, plus minors and exotics

    • Indices

      Enjoy 24-hour pricing on the UK100, US30 and more

    • Commodities

      Trade on metals, energies & softs, with oil spreads from 2 cents

    • Shares
    • ETFs
    • Currency indices
    • Dividends for index CFDs
    • Dividends for share CFDs
    • CFD forwards
  • Trading platforms
    • TradingView

      Trade through the world-famous supercharts with great pricing

    • MetaTrader 5

      Explore the apex in trading automation with our execution tech

    • The Pepperstone platform
    • MetaTrader 4
    • cTrader
    • Trading tools
  • Market analysis
    • Navigating markets

      Latest news and analysis from our experts

    • The Daily Fix

      Your regular round-up of key events

    • Meet the analysts

      Our global team giving your trading the edge

  • Learn
    • Trading guides

      Trading guides & educational materials

    • Webinars

      Grow your knowledge

  • About us
    • Who we are

      Pepperstone was born from the dream of making trading better

    • Company news
    • Company awards
    • Protecting clients online
    • Spread betting

      Bet on global price movements in £ per point

    • CFD trading

      Trade on 1000s of assets without owning them

    • Pricing

      Discover our tight spreads, plus all other possible fees

    • Risk management
    • Trading accounts
    • Demo trading
    • Trading hours
    • 24-hour trading
    • Maintenance schedule
    • Forex

      Get great rates on majors like EUR/USD, plus minors and exotics

    • Indices

      Enjoy 24-hour pricing on the UK100, US30 and more

    • Commodities

      Trade on metals, energies & softs, with oil spreads from 2 cents

    • Shares
    • ETFs
    • Currency indices
    • Dividends for index CFDs
    • Dividends for share CFDs
    • CFD forwards
    • TradingView

      Trade through the world-famous supercharts with great pricing

    • MetaTrader 5

      Explore the apex in trading automation with our execution tech

    • The Pepperstone platform
    • MetaTrader 4
    • cTrader
    • Trading tools
    • Navigating markets

      Latest news and analysis from our experts

    • The Daily Fix

      Your regular round-up of key events

    • Meet the analysts

      Our global team giving your trading the edge

    • Trading guides

      Trading guides & educational materials

    • Webinars

      Grow your knowledge

    • Who we are

      Pepperstone was born from the dream of making trading better

    • Company news
    • Company awards
    • Protecting clients online

S&P 500 finds its feet after 3% slide — will US equity traders chase the rally or sell into strength?

Chris Ashton
Chris Ashton
Guest Analyst
6 Nov 2025
Share
Cautious dip-buying emerges as the S&P 500 rebounds over 1% from its lows at 6724, with traders weighing whether the sharp 2-day sell-off marks the start of an AI-bubble unwind or a temporary shakeout before tech momentum resumes.


S&P 500

Summary

  • S&P 500 Rebound: The S&P 500 rallies over 1% from 2 week lows at 6724, briefly touching 6834 before topping out
  • Catalysts: Dip buying and resilient US economic data help to reverse some of the negative sentiment from the start of the week
  • Future Drivers: Q3 earnings, US government shutdown and Supreme Court scepticism over Trump's global tariff policy

What is driving the recent moves in the S&P 500?

The S&P 500 rebounded from a sell-off which saw the index drop 3% from a high of 6925.1 on October 30th to a low of 6724.6 on Wednesday November 5th.

S&P 500 4 hour chart:

S&P 500 4 Hour Chart
Preview


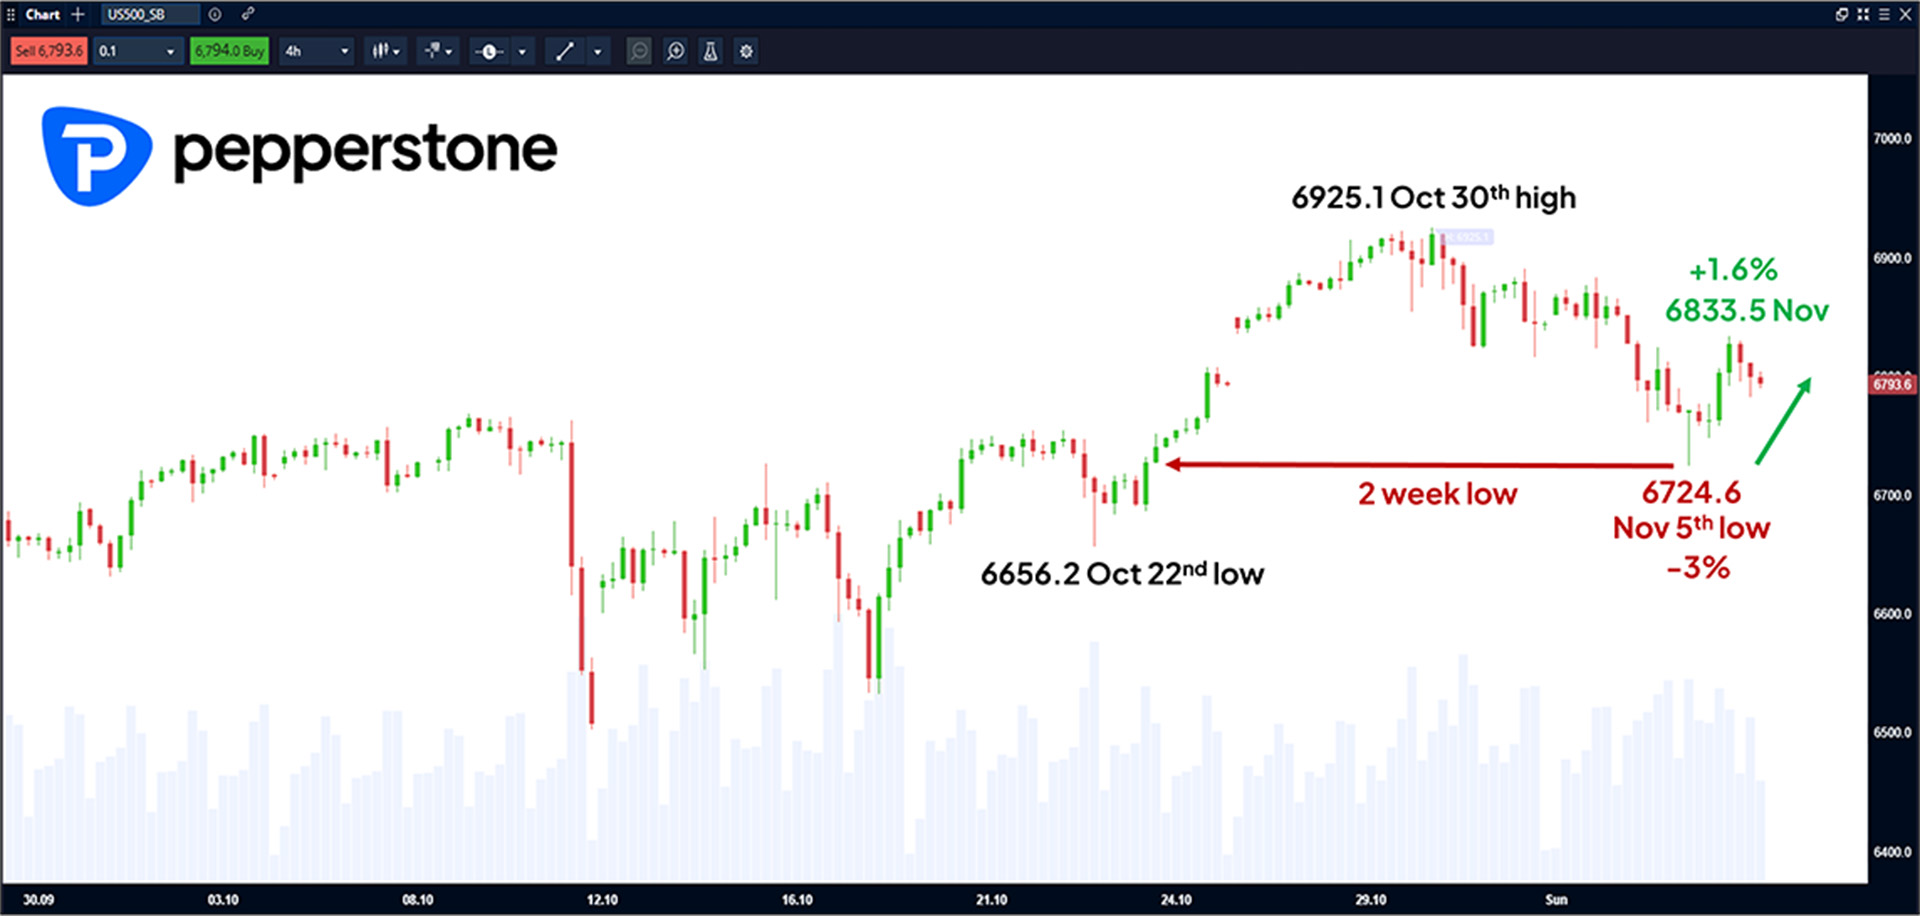
Traders cautiously rebought the dip supported by stronger than expected labour market data (ADP Private Sector Payrolls) and an ISM Services PMI reading that expanded at the fastest pace since March, providing some comfort that the US economy remains resilient with consumers still willing to spend. At one point, this rebound saw the S&P 500 gain as much as 110 points or 1.6% from its Wednesday low to trade as high as 6833.5 before fresh selling capped the move.

The sell-off at the start of the week was based on concerns over excessively high valuations of technology companies that have soared across 2025 on the back of investor excitement regarding the future revenue potential of AI. Those concerns were still evident yesterday evening after the market close, when chipmaker Qualcomm released sales and profits that topped analysts' estimates but still failed to impress investors, seeing its share price drop over 3.5%, tempering the short-term upside momentum for the S&P 500 and leaving traders guessing what may come next.


What could impact the next moves in the S&P 500?

Sentiment and confidence are a big factor driving prices in any market and the S&P 500 is no different. Sentiment remains fragile and traders may remain cautious into the weekend, with only a Bank of England interest rate decision due at 1200 GMT today, a speech from future Federal Reserve Chairman candidate Christopher Waller (Thursday, 2030 GMT) and then the US Preliminary Michigan consumer sentiment reading released tomorrow at 1500 GMT to focus on in terms of scheduled events.

The wider macro backdrop also remains uncertain with the US government shutdown now officially the longest in history and no indication that any progress towards an agreement is being made, with some reports suggesting this is costing the US economy around $15 billion per week (Bloomberg). While yesterday, the Supreme Court’s tough questioning of President Trump’s use of emergency powers to pursue his global tariff polices increased speculation that they could be curtailed later in the year. 

Technical update - S&P 500 4 hour chart:


S&P 500 4 Hour Chart
Preview

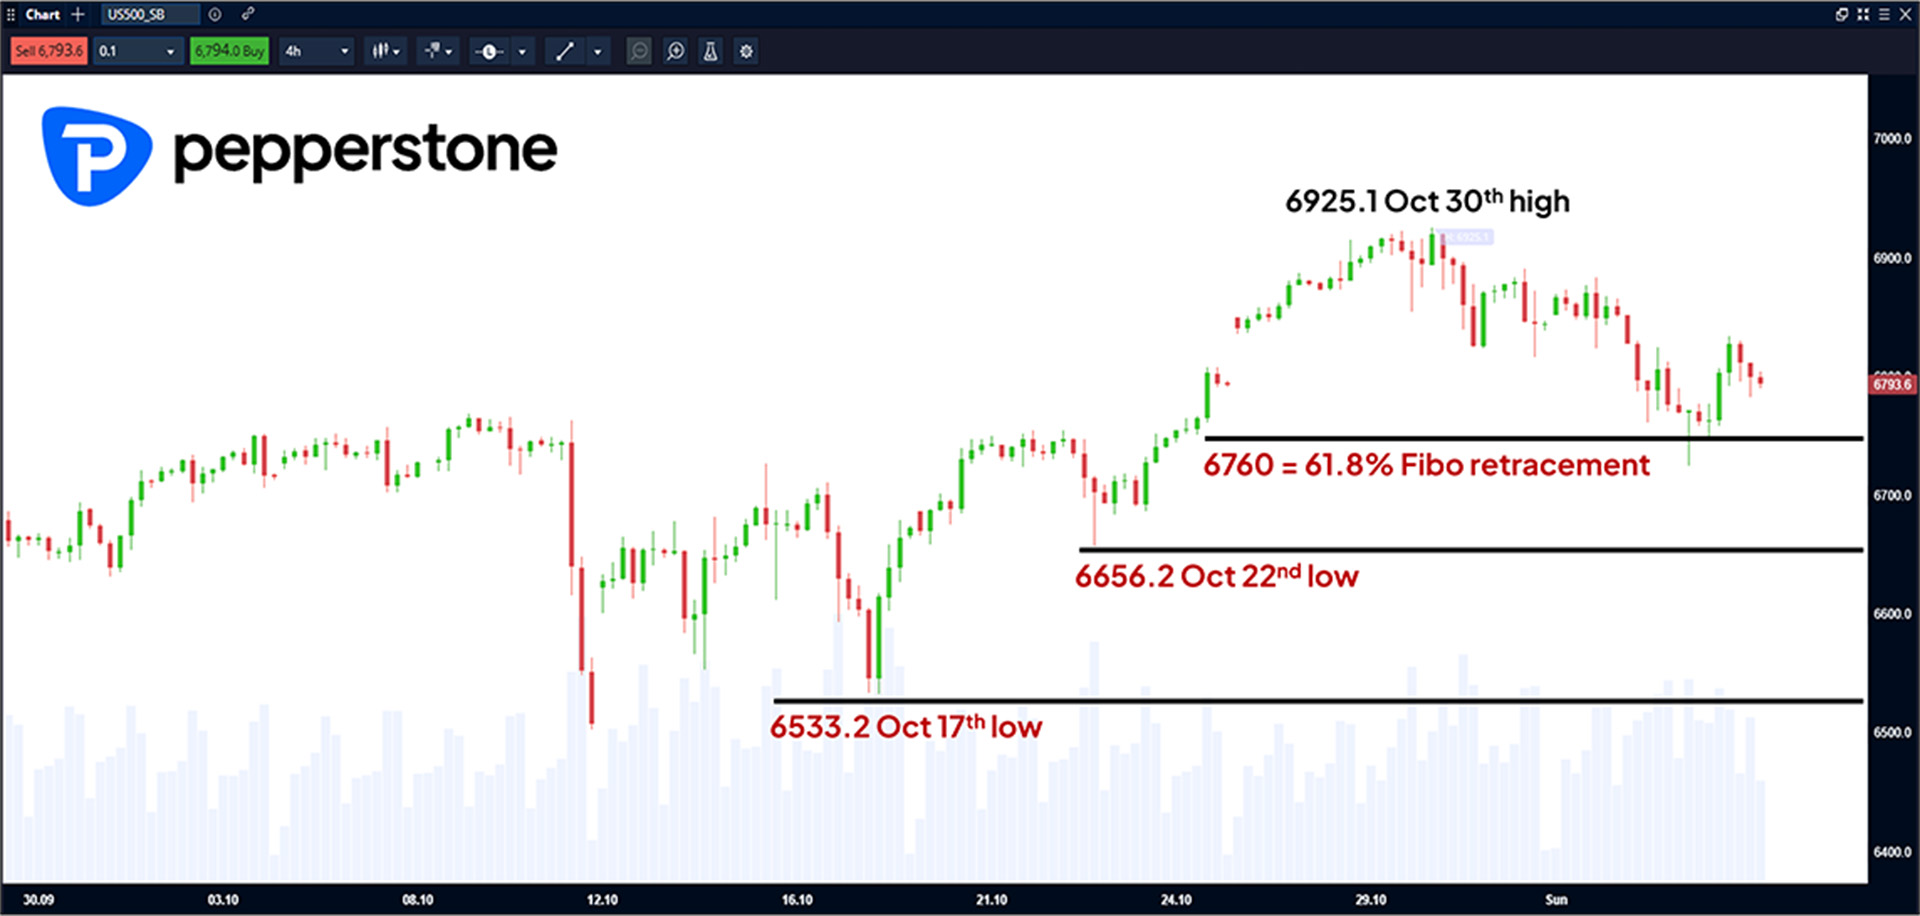
Support: While S&P 500 prices remain below 6833.5 (November 5th high) there is potential to retest the downside. The first support to monitor could be 6760, which is the 61.8% retracement of the upside strength from the October 22nd low to the October 30th high. So far this week, 6760 has held on a 4 hourly closing basis, although a close below this potential support could open up tests of 6656.2, which is the October 22nd low, even 6533.2 (October 17th low).

Technical update - S&P 500 chart:

S&P 500 4 Hour Chart
Preview

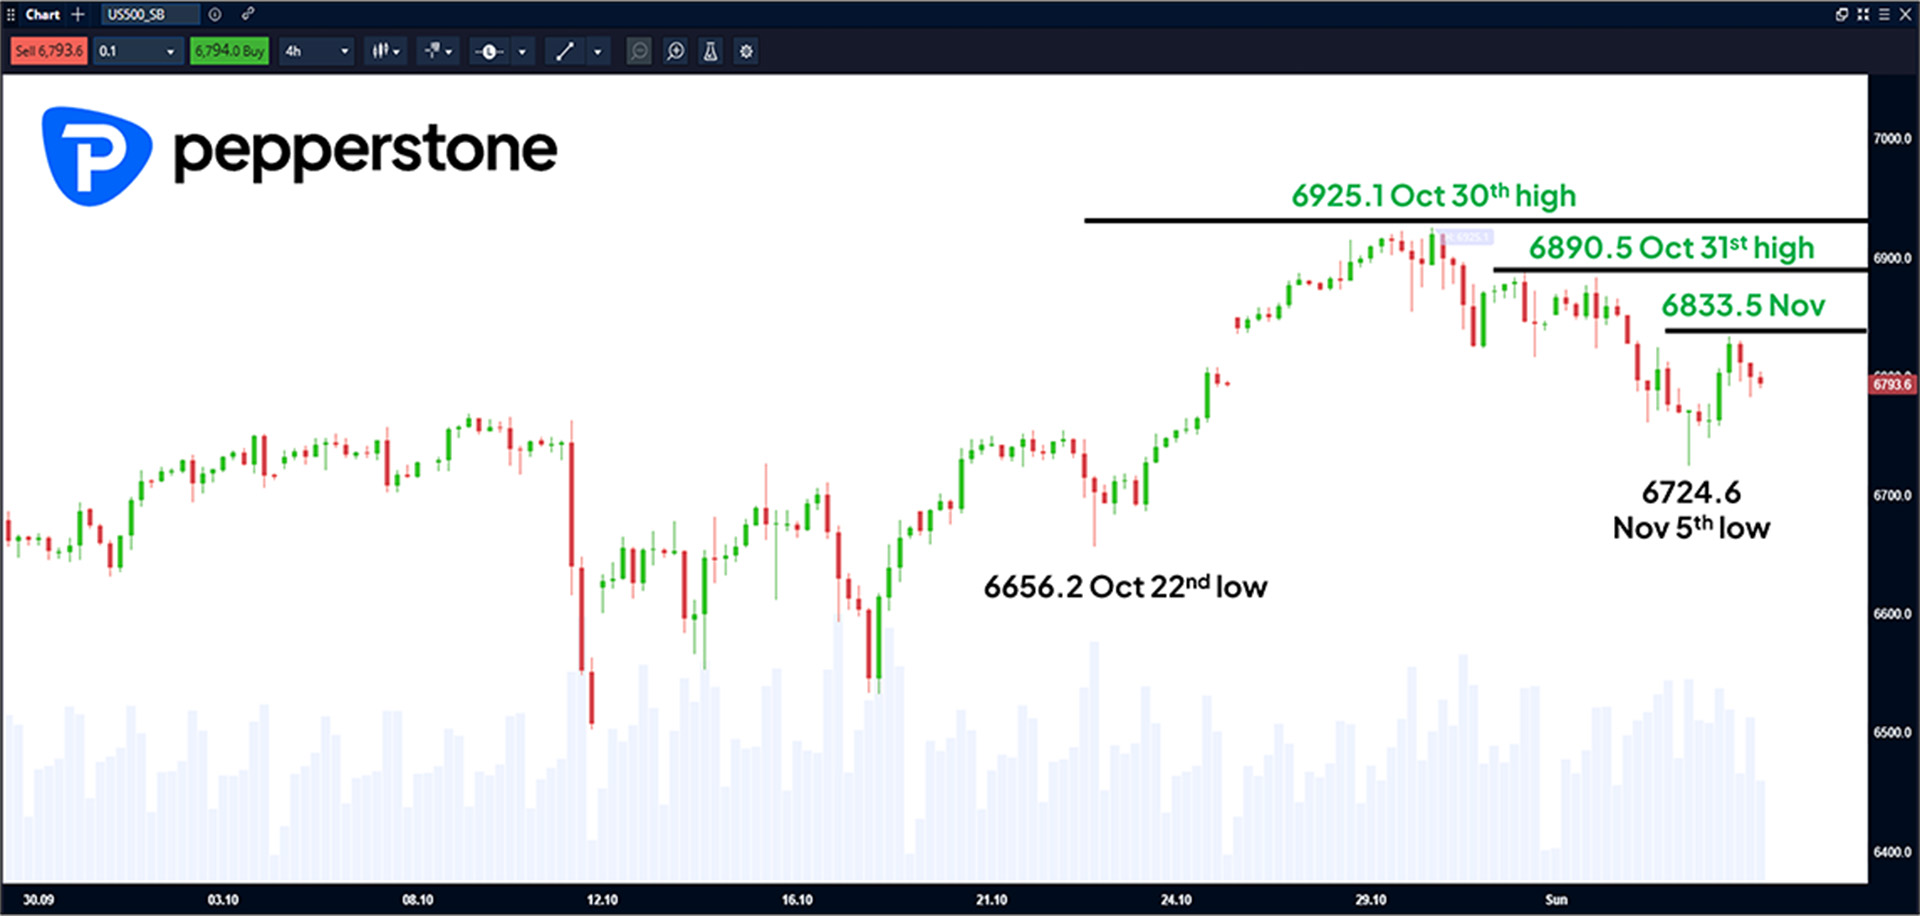
Resistance: Yesterday's high at 6833.5 capped the rebound and may be the first resistance level to monitor on any future rally across upcoming sessions. A break and close above 6833.5 could open up a deeper squeeze towards 6890.5, which is the October 31st high, with closes above this level opening the way for a potential retest of 6925.1, the record high set on October 30th.

The material provided here has not been prepared in accordance with legal requirements designed to promote the independence of investment research and as such is considered to be a marketing communication. Whilst it is not subject to any prohibition on dealing ahead of the dissemination of investment research we will not seek to take any advantage before providing it to our clients.

Pepperstone doesn’t represent that the material provided here is accurate, current or complete, and therefore shouldn’t be relied upon as such. The information, whether from a third party or not, isn’t to be considered as a recommendation; or an offer to buy or sell; or the solicitation of an offer to buy or sell any security, financial product or instrument; or to participate in any particular trading strategy. It does not take into account readers’ financial situation or investment objectives. We advise any readers of this content to seek their own advice. Without the approval of Pepperstone, reproduction or redistribution of this information isn’t permitted.

Other Sites

  • The Trade Off
  • Partners
  • Group
  • Careers

Ways to trade

  • Pricing
  • Trading accounts
  • Pro
  • Trading hours

Platforms

  • Trading Platforms
  • TradingView
  • MT5
  • MT4
  • cTrader
  • Trading tools

Markets and Symbols

  • Forex
  • Shares
  • ETFs
  • Indicies
  • Commodities
  • Currency indicies
  • CFD forwards

Analysis

  • Navigating Markets
  • The Daily Fix
  • Meet Our Analysts

Learn to trade

  • Trading guides
  • Videos
  • Webinars
Pepperstone logo
support@pepperstone.com
+448000465473+442038074724
70 Gracechurch St
London EC3V 0HR
United Kingdom
  • Legal documents
  • Privacy policy
  • Website terms and conditions
  • Cookie policy
  • Sitemap

© 2025 Pepperstone Limited
Company Number 08965105 | Financial Conduct Authority Firm Registration Number 684312

Risk warning: Spread bets and CFDs are complex instruments and come with a high risk of losing money rapidly due to leverage. 72% of retail investor accounts lose money when trading spread bets and CFDs with this provider. You should consider whether you understand how spread bets and CFDs work and whether you can afford to take the high risk of losing your money.

Trading derivatives is risky. It isn't suitable for everyone and, in the case of Professional clients, you could lose substantially more than your initial investment. You don't own or have rights in the underlying assets. Past performance is no indication of future performance and tax laws are subject to change. The information on this website is general in nature and doesn't take into account your or your client's personal objectives, financial circumstances, or needs. Please read our legal documents and ensure you fully understand the risks before you make any trading decisions. We encourage you to seek independent advice.

Pepperstone Limited is a limited company registered in England & Wales under Company Number 08965105 and is authorised and regulated by the Financial Conduct Authority (Registration Number 684312). Registered office: 70 Gracechurch Street, London EC3V 0HR, United Kingdom.

The information on this site is not intended for residents of Belgium or the United States, or use by any person in any country or jurisdiction where such distribution or use would be contrary to local law or regulation.