- English (UK)
USD Reversal and Key Event Risks: A Trader’s Week Ahead Playbook

We have learned valuable new intel on the Fed’s asymmetric reaction function, which will see traders' price a relatively higher 1-day volatility around the upcoming labour market reads, notably for the upcoming US nonfarm payrolls (NFP) on 3 October. Yet despite such a big week of data and some strong moves in US tech, levels of cross-asset volatility remain crushed. S&P500 20-day volatility is realising on just 7.2%, and not far from the YTD lows of 6.28%. It’s therefore not hard to see why the VIX can’t rise above 17% when the daily close-to-close percentage changes in the S&P500 are so tight. FX volatility is no different, with the aggregated G10 FX volatility measures (such as the JPM G10 FX vol) at 6.99% — the lowest level since July 2024 — while UST volatility (MOVE index) closed on Friday at 72.5%, its lowest level since January 2024.
Looking at the known event risk on the calendar for the week ahead, and with selling volatility and long carry strategies having been a highly profitable trade for many institutional players - notably on a risk-adjusted basis - it seems unlikely this week's risk events have the potential to reverse that stance. There seems to be no strong reason to believe the steady grind higher in US equity and gold won’t continue, with pullbacks remaining shallow and well supported.
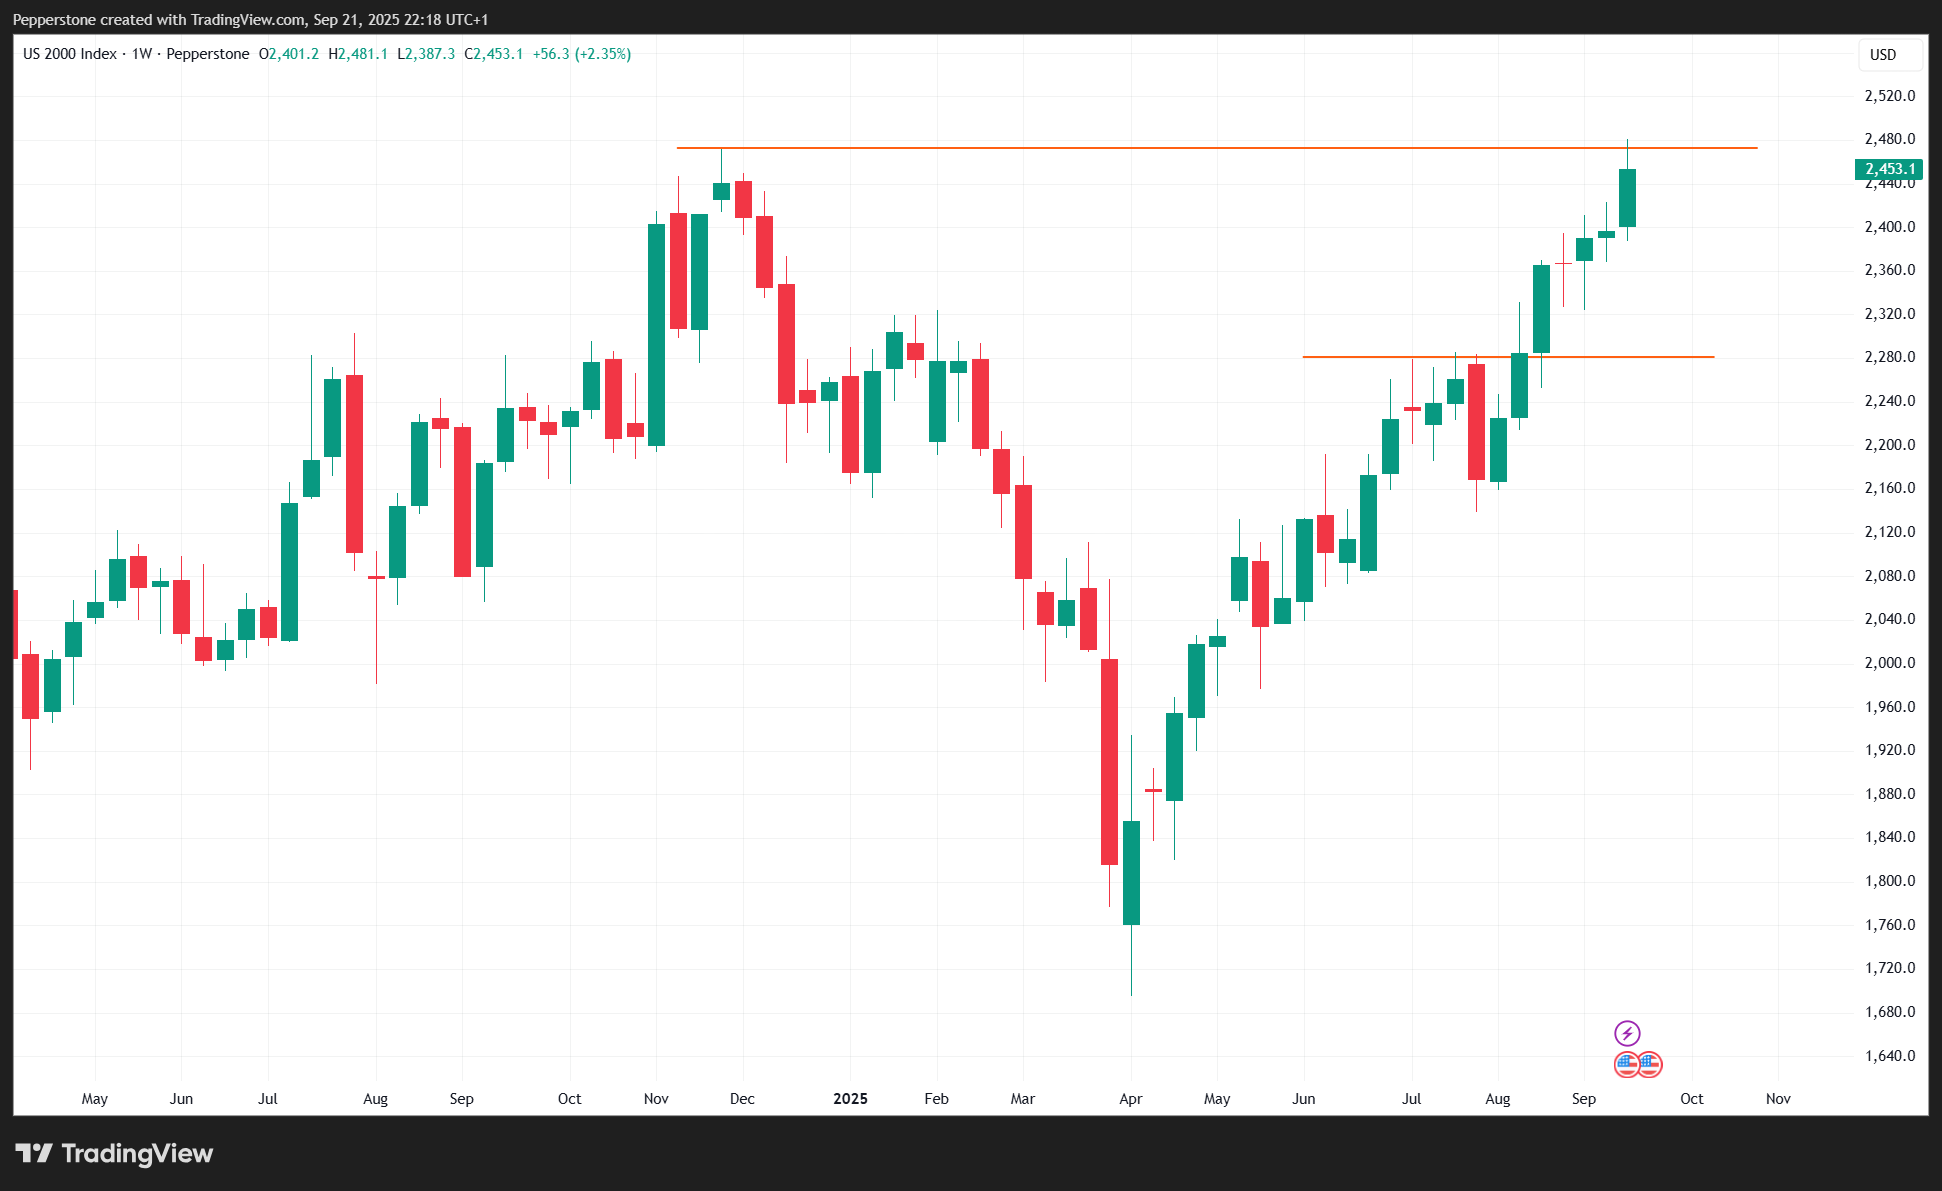
The Russell 2K is perhaps the one US equity index where the technical set-up does raise some concern, and I'd also be focused on risk to the HK50, notably if the USD upside does build and we saw the HK equity index break below last week's low of 26,280. While we saw a strong move last week in the US small-cap index (Russell 2K) and new ATHs on Friday, the buyers lacked the impetus to push the price for a weekly close above the former highs. The weekly chart offers clear high-level context in that regard, and while we could see the R2K index consolidate near-term in a 2460–2400 range, the bulls will need to step up if the uptrend from the April lows is to continue.
The trajectory of the USD is less clear-cut, and where the greenback trades in the near-term is subject of increased debate, and one needs to be open-minded to the idea that the positive USD price action seen late last week could build. With a deluge of UST supply coming to market this week and a big lineup of scheduled Fed speakers, UST yields could drive the USD flows. Traders will also look to US rates/swaps pricing to see if traders can push the implied ‘terminal’ Fed funds rate above 3%.
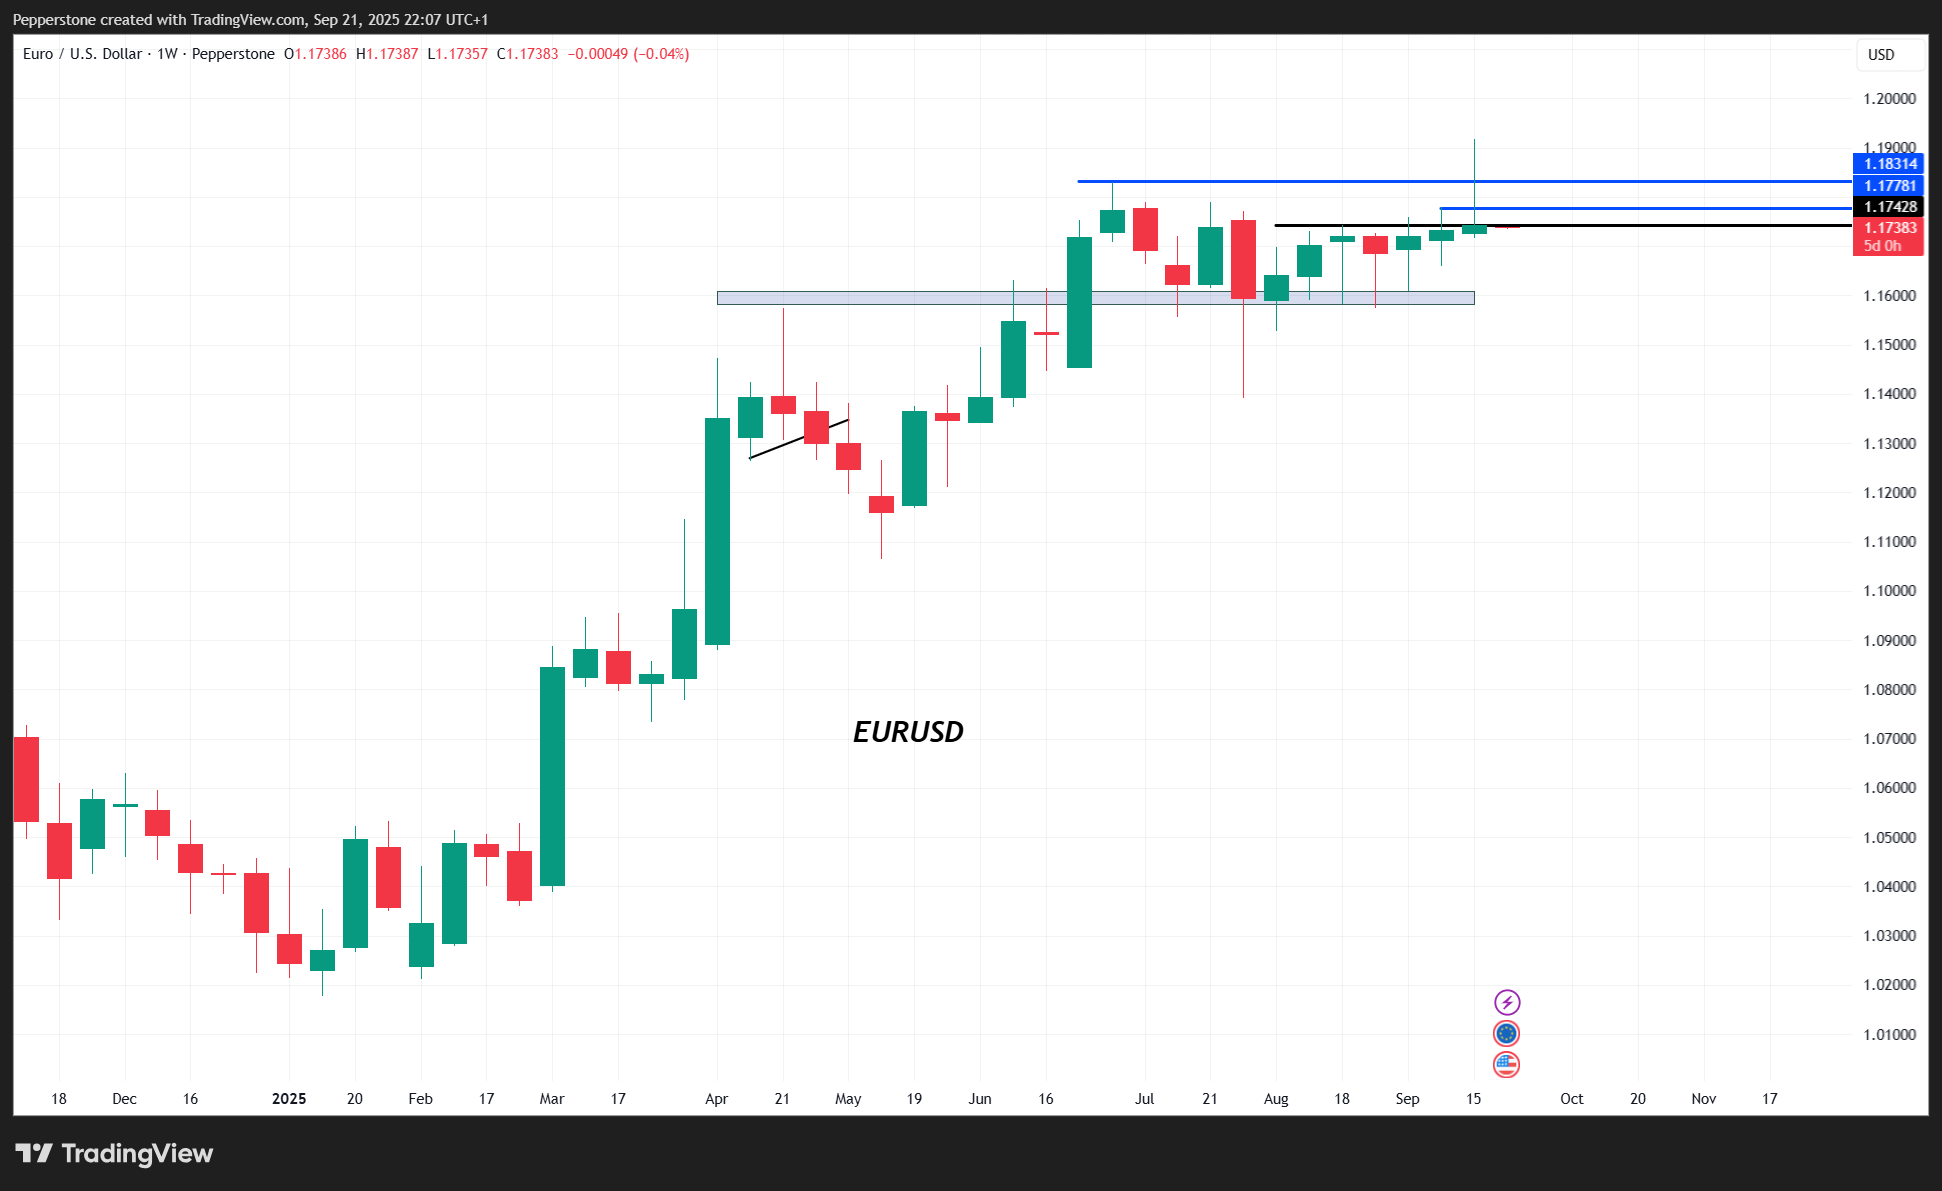
The weekly charts of EURUSD, AUDUSD, USDCHF, USDJPY, and the DXY show strong rejections at key prior highs/lows. The long wicks in the subsequent reversals suggest this was largely USD shorts frustrated and capitulating after the FOMC meeting, with pockets of organic buying from more aggressive players. If the USD builds on this early in the week, it could increase the probability that a tradeable low is in place. While I was initially keen to fade late-week USD strength, I’d hold off until the collective market shows intent to push the dollar lower again.
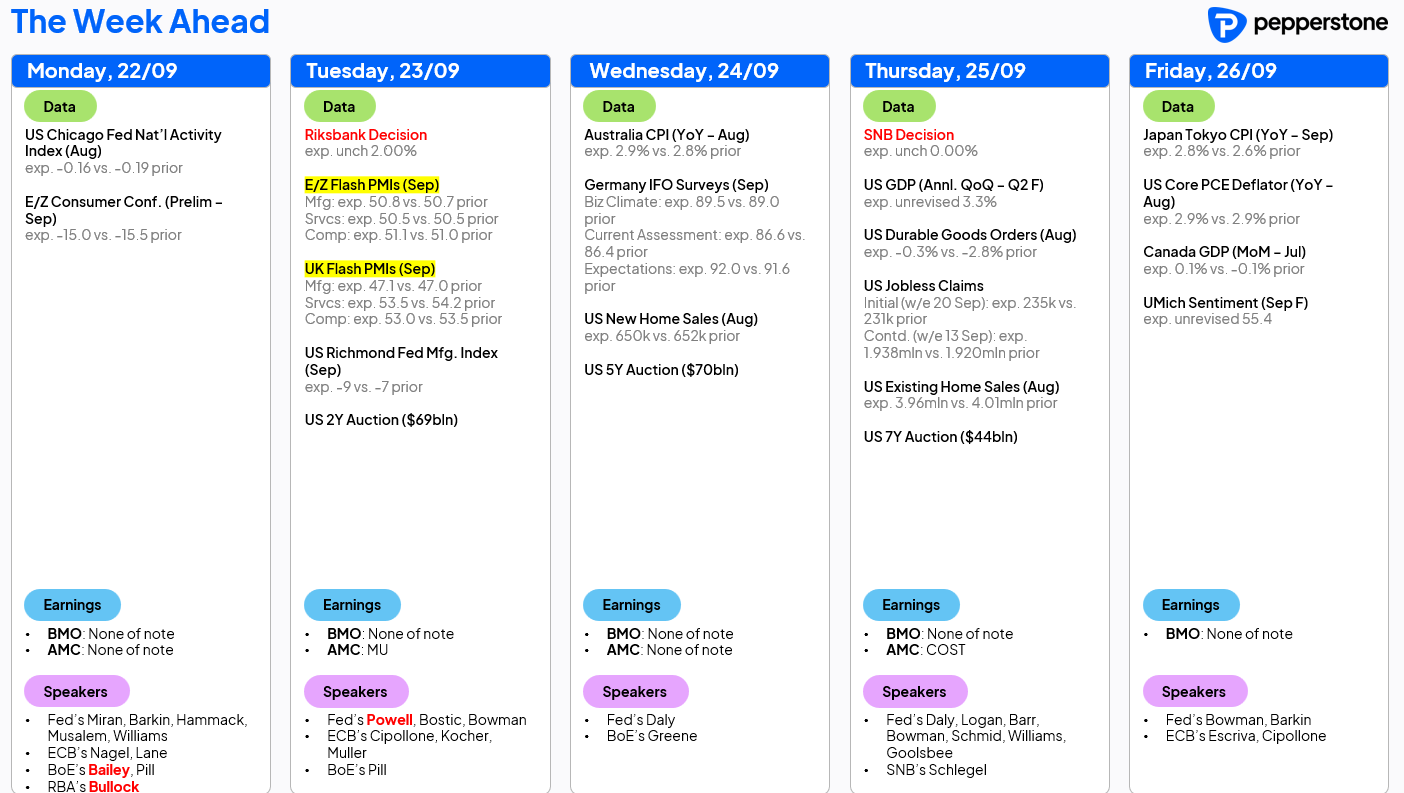
Event Risk Overview: The Key (scheduled) Event Risks for the Week Ahead
- A Fed talk fest – It will be a lively week for Fed speakers, with 18 separate speeches scheduled. The central focus will be on Jay Powell’s address on Tuesday, but we’ll also hear from 2025 voters including Williams, Bowman, Musalem, Miran, Goolsbee, Schmid, and Barr. Steven Miran’s remarks in US trade today could be particularly interesting, and, while Miran spoke on Friday, today's speech will further lay out the case behind his call for 150bp of cuts this year and minimal recession risk — possibly a pitch for the Fed chair position?
- US (Aug) Core PCE inflation (Friday) – The Fed’s preferred inflation gauge is expected at 0.3% m/m and 2.7% y/y (from 2.6%). With the Fed's reaction function sensitive to the labour market, only a big deviation in core PCE from the consensus would likely move US rates or cross-asset volatility.
- US Personal income & Spending (Friday) – Models suggest incomes +0.3% m/m and spending +0.5% m/m. With rising concerns over household real incomes, loss of purchasing power, and harder-to-find jobs, this data will get close attention and could hit sentiment if it misses.
- US goods trade balance (Thursday) – This is typically a low-impact release for markets, but the outcome will feed into US Q3 GDP tracking, which the Atlanta Fed’s Nowcast currently puts at 3.3%.
- Central bank meetings – The Riksbank (Tuesday), SNB (Thursday), and Banxico (Friday) meet. Of the three, Banxico is expected to move, with a 25bp cut widely forecast. SEK IR swaps put a 30% chance on a Riksbank cut, so we could see volatility in USDSEK and NOKSEK.
- PMIs (US, Europe & UK) – Composite PMIs are expected to improve from July. Likely not a big driver of intraday pricing, but still a risk worth noting.
- Australia monthly CPI (Aug) – Forecast at 2.9% y/y (from 2.8%). The quarterly CPI (due 29 Oct) will ultimately be the key input for the November RBA meeting, but August CPI could shape expectations. A hotter print wouldn’t derail November cut expectations, but it could lower implied odds from ~79% to 60–65% and lift the AUD on crosses, while putting downside risk for the ASX200.
- US Treasury issuance – The Treasury auctions $183bn of 2-, 5- and 7-year notes this week. Demand levels will influence UST yields and, by extension, USD direction.
- China’s 1- & 5-year Loan Prime Rate (Monday) – The LPR is the reference rate for most commercial loans. Despite expectations of further stimulus this year, the PBoC is widely seen holding the 1-year at 3% and the 5-year at 3.5%.
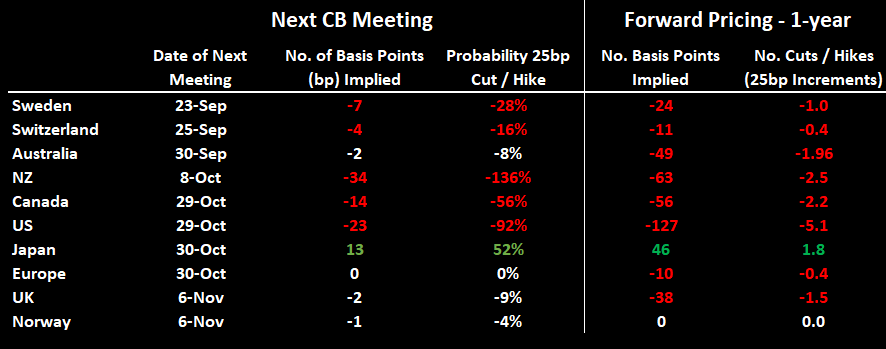
Central Bank Interest Rates Review
Reviewing market expectations and the implied probability for policy change (sourced from IR swaps pricing) at the next central bank meeting, and the cumulative pricing of cuts/hikes 12 months forward.
The material provided here has not been prepared in accordance with legal requirements designed to promote the independence of investment research and as such is considered to be a marketing communication. Whilst it is not subject to any prohibition on dealing ahead of the dissemination of investment research we will not seek to take any advantage before providing it to our clients.
Pepperstone doesn’t represent that the material provided here is accurate, current or complete, and therefore shouldn’t be relied upon as such. The information, whether from a third party or not, isn’t to be considered as a recommendation; or an offer to buy or sell; or the solicitation of an offer to buy or sell any security, financial product or instrument; or to participate in any particular trading strategy. It does not take into account readers’ financial situation or investment objectives. We advise any readers of this content to seek their own advice. Without the approval of Pepperstone, reproduction or redistribution of this information isn’t permitted.