Since late October, U.S. natural gas prices have steadily risen, quickly becoming a major focus for traders. On Wednesday, spot prices briefly approached $4.9/MMBtu, marking the highest level since March. From the mid-October low, prices have rebounded roughly 75%.
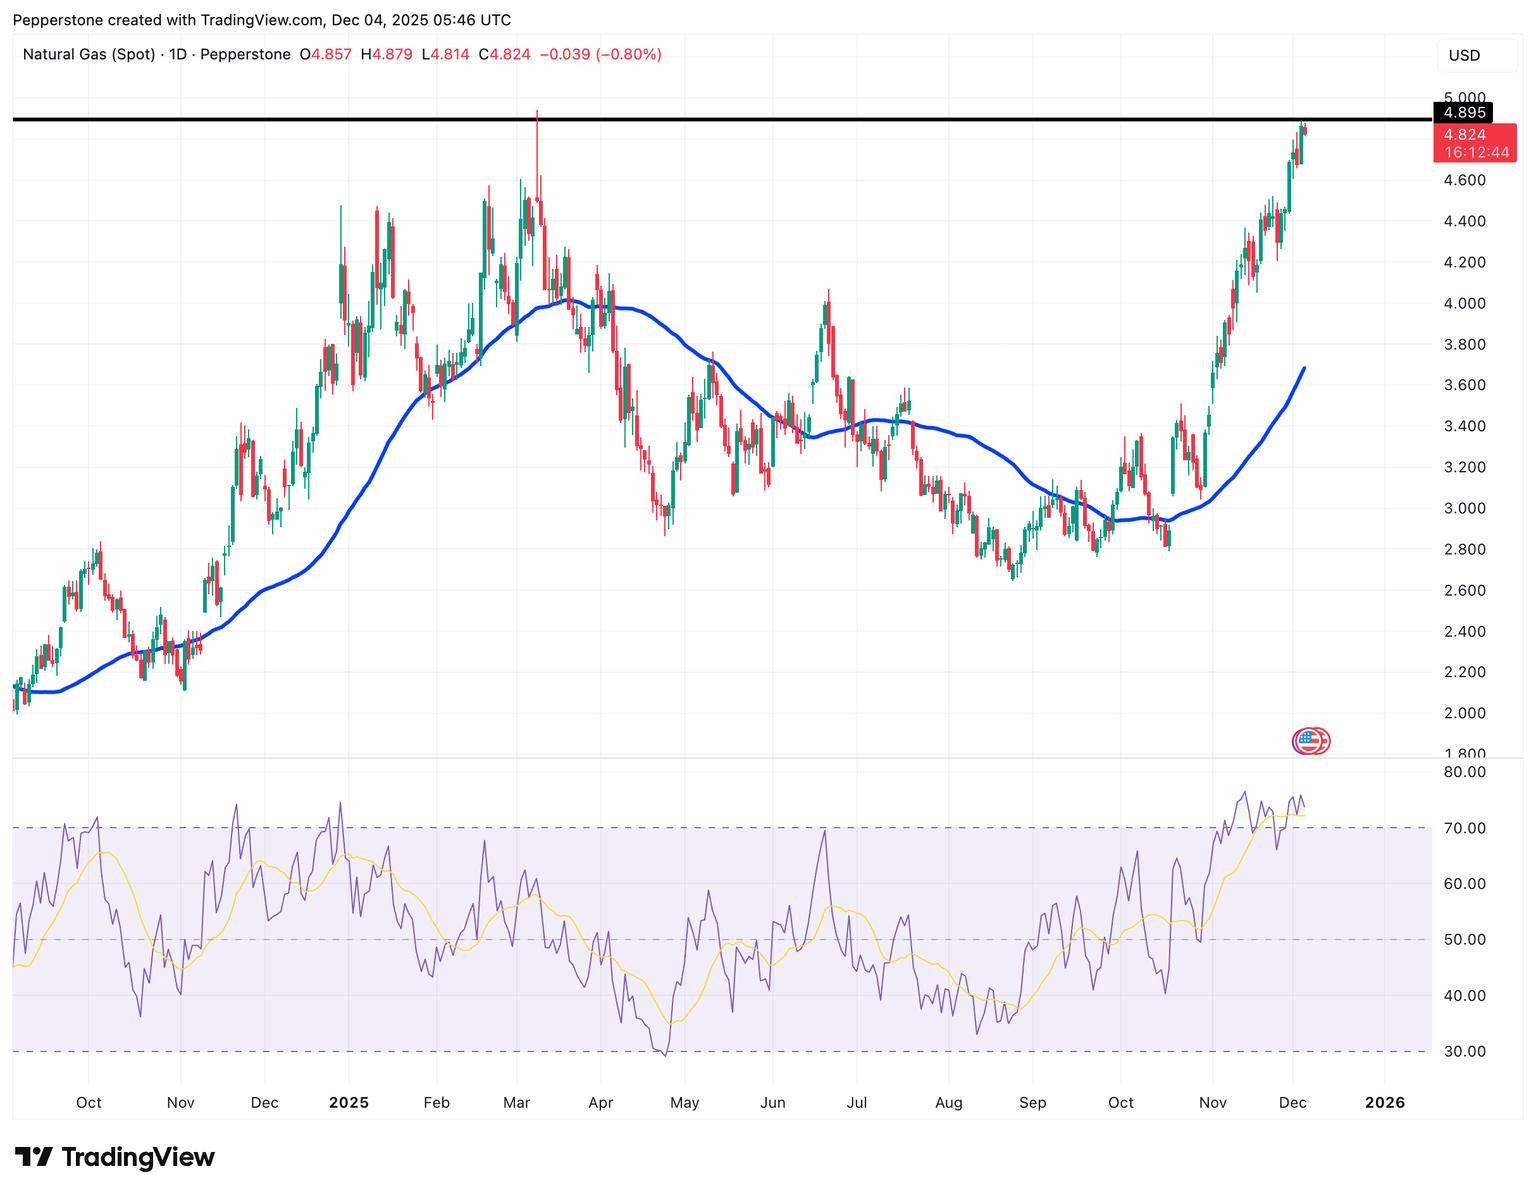
Unlike typical seasonal winter rallies, this surge reflects deeper structural shifts. Record-breaking U.S. LNG exports, rising heating demand from early winter in the Northern Hemisphere, and a lack of notable acceleration in domestic supply have collectively pushed prices higher.
Export Boom Reshapes U.S. Supply and Demand
The primary driver behind this price rally is the rapid expansion of LNG exports. In October, U.S. LNG shipments exceeded 10.1 million tons for the first time, making it the first country in history to export more than 10 million tons in a single month. November shipments climbed further to 10.9 million tons, setting another record.
Notably, European markets absorbed roughly 70% of U.S. LNG shipments. With the EU planning to fully phase out Russian LNG by 2027, its reliance on U.S. supplies is set to deepen, reinforcing the U.S. market’s “supply shortage” dynamic.
The export surge has directly tightened domestic supply-demand balance. While U.S. production remains high, growth has not accelerated significantly, and exports increasingly divert gas away from power generation and industrial users, reducing available domestic supply.
Combined with colder-than-expected early winter temperatures in the Northern Hemisphere, inventories have been drawn down faster than anticipated, amplifying the market gap. Late November saw U.S. utilities withdraw significantly more gas from storage than expected, confirming mounting winter replenishment pressure.
AI Electricity Demand: An Underestimated Factor
Beyond limited supply growth and accelerated exports, rising electricity demand from AI data centers is another key factor driving the current natural gas rally.
As data center electricity consumption grows at double-digit rates and natural gas accounts for over 40% of U.S. power generation, its flexibility makes it the most reliable source to complement intermittent renewable energy. In other words, the hotter the AI trend, the stronger the U.S. natural gas demand.
Markets broadly expect U.S. LNG exports to grow another 75% by 2030. Combined with additional demand from data centers, the marginal demand for natural gas is being pushed higher. With exports continuing to accelerate, domestic supply could face greater pressure, and markets need to account for these new demand drivers in advance.
Short-Term Upside Clear, Medium-Term Expansion Risks Loom
Overall, natural gas is a classic “trend + event” commodity. The current price rally is mainly driven by rising U.S. exports, Northern Hemisphere heating demand, and AI electricity consumption, making short-term short positions particularly risky.
Looking at the medium term, potential new production capacity could introduce downward pressure.
Around 2026, the global LNG market is set to enter its largest expansion cycle ever, with more than 300 billion cubic meters of new capacity expected. Projects in the U.S., Qatar, Canada, and Mozambique are scheduled to come online between 2026 and 2030, with U.S. supply accounting for more than half of global additions. This points to a potential “supply surge,” while demand growth may not keep pace.
In terms of demand structure, Europe’s growth is primarily driven by power generation to offset renewable shortfalls. Asian demand remains weak, with slower growth in China, decreased demand in Japan due to nuclear restarts, and emerging markets unlikely to fully absorb future supply additions. The International Energy Agency (IEA) has repeatedly warned that global LNG markets could face oversupply between 2026 and 2028.
As such, current high prices largely reflect short-term supply-demand imbalances rather than long-term equilibrium. The market may spike further due to strong exports or rising AI electricity demand, then gradually adjust downward or experience extended sideways volatility as new supply comes online.
It could be helpful for traders to monitor U.S. export flows, storage levels, and winter temperatures, and to think about managing positions in stages instead of making large, single moves.