• Home
  • Pro
  • Partners
  • Help and support
  • English (UK)
Pepperstone logo
Pepperstone logo
  • Ways to trade
    • CFD trading

      Trade price movements with competitive spreads

    • Spread betting

      Bet on global price movements in £ per point

    • Pricing

      Discover our tight spreads, plus all other possible fees

    • Trading accounts
    • Risk management
    • Demo trading
    • Trading hours
    • 24-hour trading
    • Maintenance schedule
  • Markets
    • Forex

      Get great rates on majors like EUR/USD, plus minors and exotics

    • Indices

      Enjoy 24-hour pricing on the UK100, US30 and more

    • Commodities

      Trade on metals, energies & softs, with oil spreads from 2 cents

    • Shares
    • ETFs
    • Currency indices
    • Dividends for index CFDs
    • Dividends for share CFDs
    • CFD forwards
  • Trading platforms
    • TradingView

      Trade through the world-famous supercharts with great pricing

    • MetaTrader 5

      Explore the apex in trading automation with our execution tech

    • The Pepperstone platform
    • MetaTrader 4
    • cTrader
    • Trading tools
  • Market analysis
    • Navigating markets

      Latest news and analysis from our experts

    • The Daily Fix

      Your regular round-up of key events

    • Meet the analysts

      Our global team giving your trading the edge

  • Learn
    • Trading guides

      Trading guides & educational materials

    • Webinars

      Grow your knowledge

  • About us
    • Who we are

      Pepperstone was born from the dream of making trading better

    • Pepperstone reviews
    • Press releases
    • Company awards
    • Protecting clients online
    • CFD trading

      Trade price movements with competitive spreads

    • Spread betting

      Bet on global price movements in £ per point

    • Pricing

      Discover our tight spreads, plus all other possible fees

    • Trading accounts
    • Risk management
    • Demo trading
    • Trading hours
    • 24-hour trading
    • Maintenance schedule
    • Forex

      Get great rates on majors like EUR/USD, plus minors and exotics

    • Indices

      Enjoy 24-hour pricing on the UK100, US30 and more

    • Commodities

      Trade on metals, energies & softs, with oil spreads from 2 cents

    • Shares
    • ETFs
    • Currency indices
    • Dividends for index CFDs
    • Dividends for share CFDs
    • CFD forwards
    • TradingView

      Trade through the world-famous supercharts with great pricing

    • MetaTrader 5

      Explore the apex in trading automation with our execution tech

    • The Pepperstone platform
    • MetaTrader 4
    • cTrader
    • Trading tools
    • Navigating markets

      Latest news and analysis from our experts

    • The Daily Fix

      Your regular round-up of key events

    • Meet the analysts

      Our global team giving your trading the edge

    • Trading guides

      Trading guides & educational materials

    • Webinars

      Grow your knowledge

    • Who we are

      Pepperstone was born from the dream of making trading better

    • Pepperstone reviews
    • Press releases
    • Company awards
    • Protecting clients online
Equities
US500
NAS100

US equity sector rotation gathers pace as S&P 500 and Nasdaq fall

Michael Brown
Michael Brown
Senior Research Strategist
4 Feb 2026
Share
While headline equity indices typically attract the bulk of attention, volatility at a surface level often masks what’s really going on under the surface, a dynamic that we’ve seen play out in recent weeks.

Summary

  • Headlines Mask The Full Story: Recent declines in headline US equity benchmarks owe largely to a high concentration of tech names, as opposed to broad-based de-risking
  • Sectoral Churn: Said names have been pressured of late as AI enthusiasm wanes, while cyclical stocks are increasingly in favour as incoming economic data improves
  • Look Ahead: A continued rotation could mean the dynamic becomes more of a 'stock pickers' market, while the tech sector playing catch-up poses an upside risk to the market at large

Software Slumps Amid Sectoral Churn

Tuesday’s session was a good example of this. The S&P lost around 0.8%, while the Nasdaq 100 slid over 1.5%, in what was undeniably a tech-led sell-off amid fears that AI agents, chiefly enterprise plugins that Anthropic has added to Claude, could begin to erode the business cases for ‘software as a service’ (SAAS) companies. Evidencing this, Goldman’s basket of software stocks fell 6%, its biggest one-day decline since ‘Liberation Day’.

Though all of that sounds like a relatively brutal risk-off day, that wasn’t the case at all. In fact, over half of the individual stocks in the S&P 500 ended the day in the green, despite an 0.8% decline in the index, marking just the 10th time in the last decade that such a dynamic has been on display. Similarly, 16.5% of the S&P made new 52-week highs, the highest proportion since November 2024.

Preview

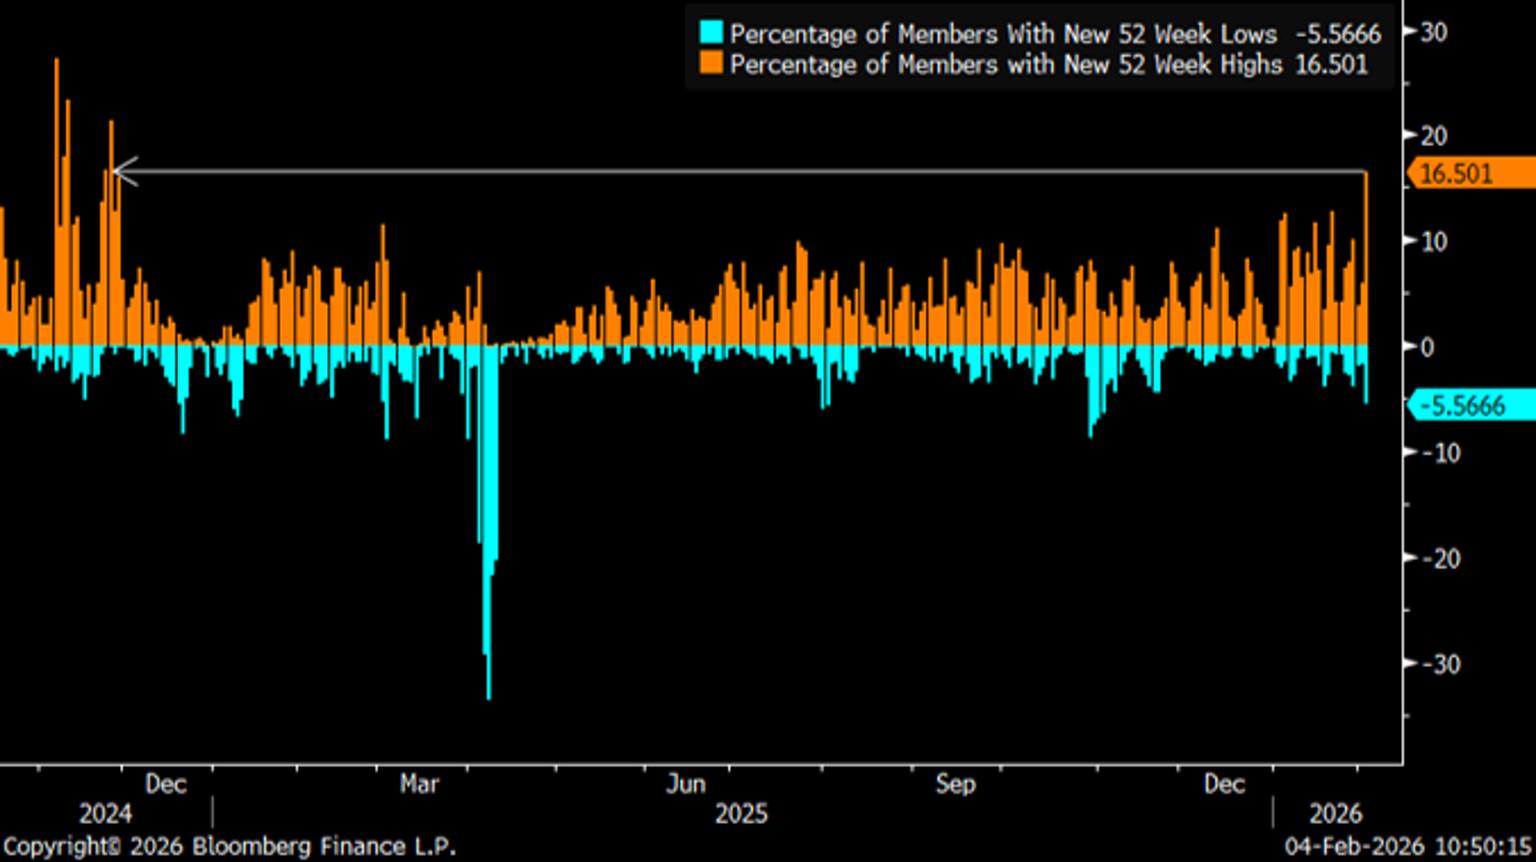
This, then, is not a market in which participants are indiscriminately de-risking and trimming equity exposure, but is instead one where participants are shifting their sector allocations as the equity rally takes on a more cyclical bent.

Rotation Is Nothing New

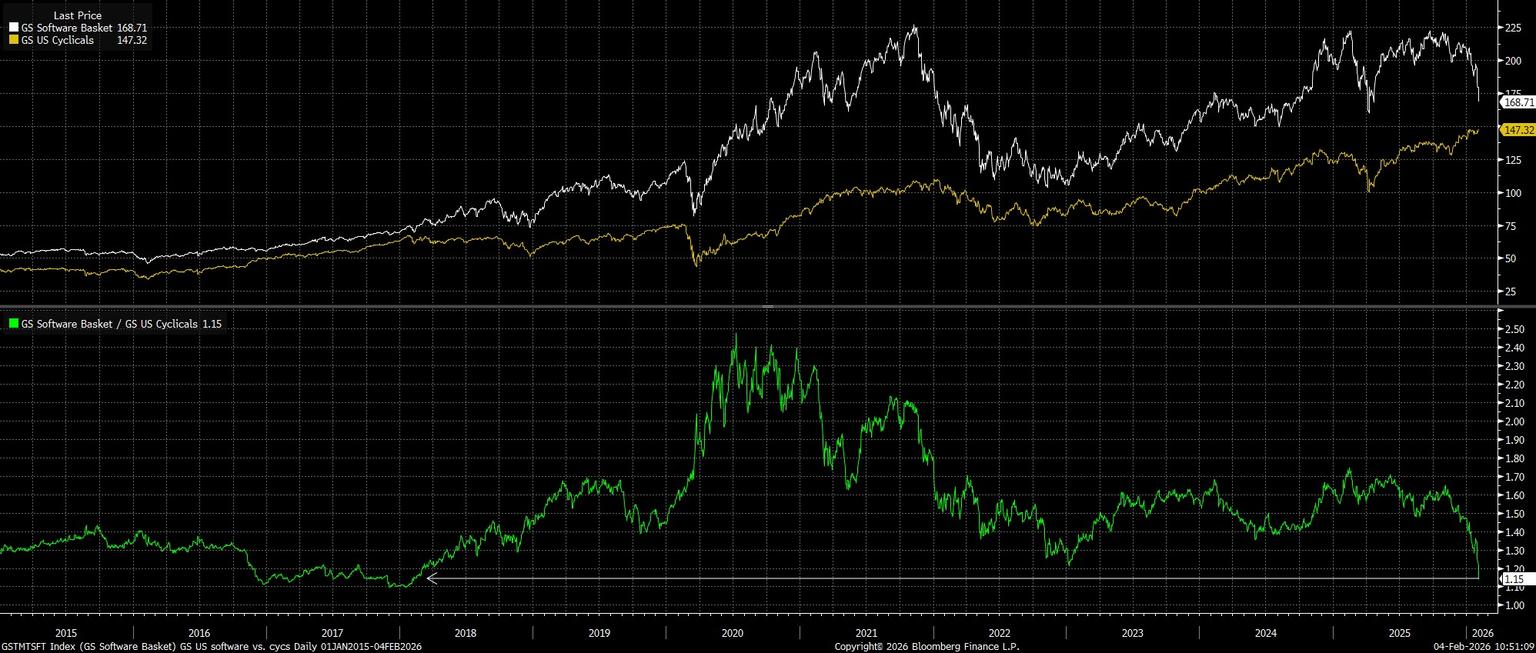
Comparing the relative performance of various areas of the market shows us the increasingly cyclical nature of the market. For instance, the aforementioned GS basket of software stocks presently trades at its weakest level against a GS basket of cyclical names since the beginning of 2018.

Preview

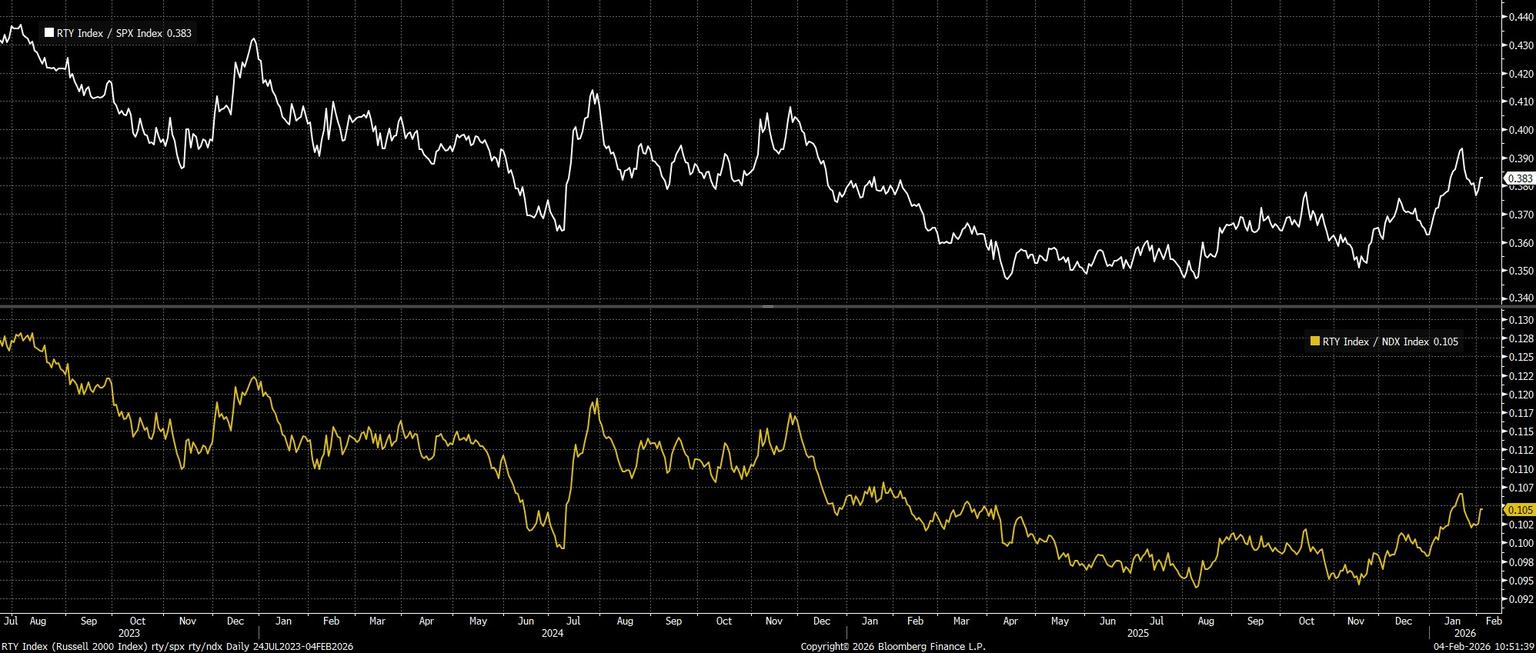
Meanwhile, small caps are continuing to outperform their larger cap peers, albeit not quite to the extent seen in mid-January. Still, the Russell 2000 remains just a rounding error away from its best performance relative to both the S&P and the Nasdaq since the second quarter of last year.

Preview

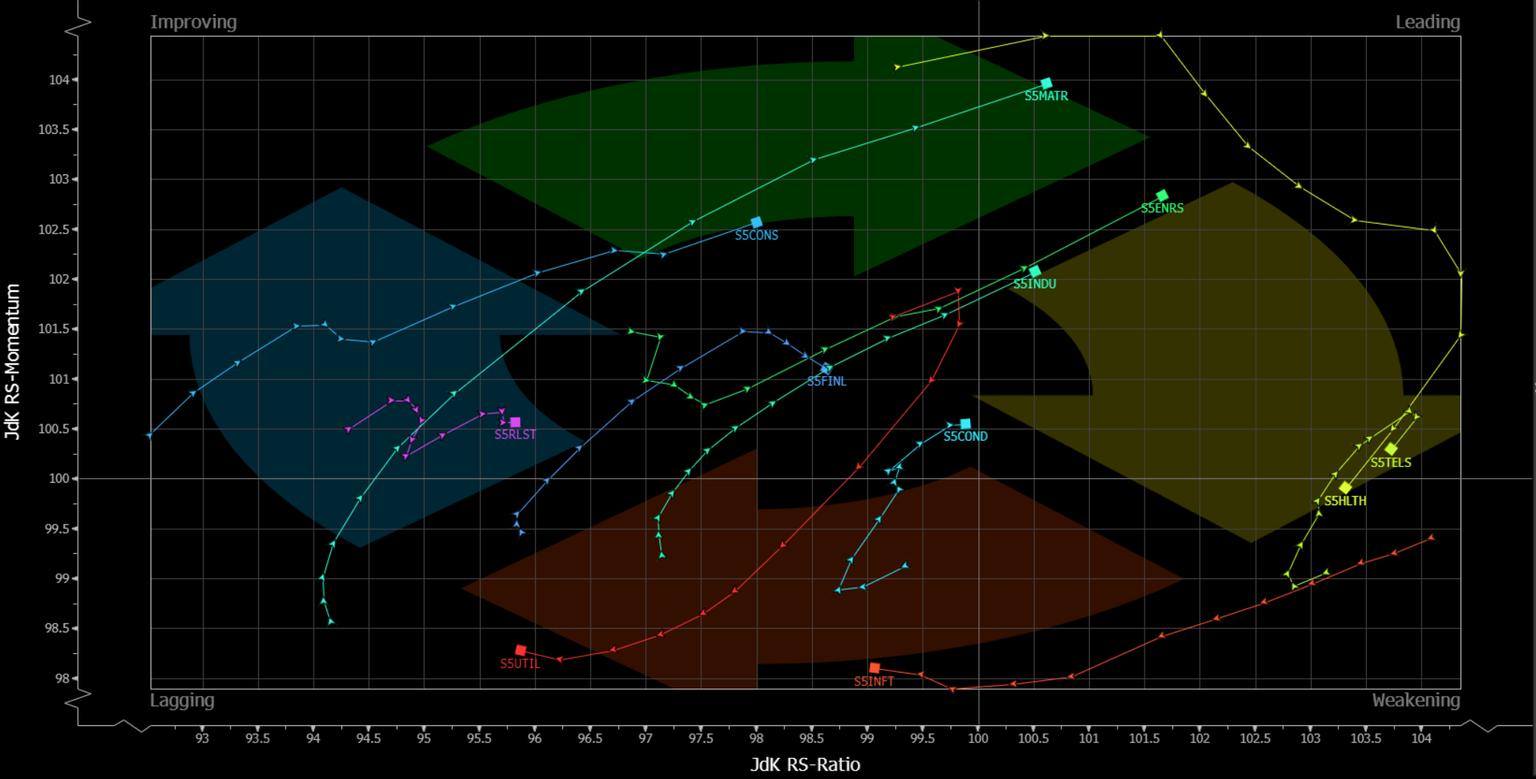
Perhaps the clearest illustration of this churn, though, is below. Over the last six weeks or so, sectors which were previously leading the market higher – namely, Information Technology and Telecoms – have lost momentum, and are now lagging behind the pack. Simultaneously, previous laggards such as Energy, Industrials, and Materials have picked up the mantle and begun to outperform.

Preview

Impact of Index Concentration

This churn, though, has something of a detrimental impact on indices at a headline level, almost entirely for mechanical reasons. Given the huge index weighting that tech behemoths now possess, and the concentrated nature of benchmarks such as the S&P and Nasdaq, with the largest 10 constituents in the SPX (9 of which are tech-exposed names) accounting for roughly 38% of the index by weight.

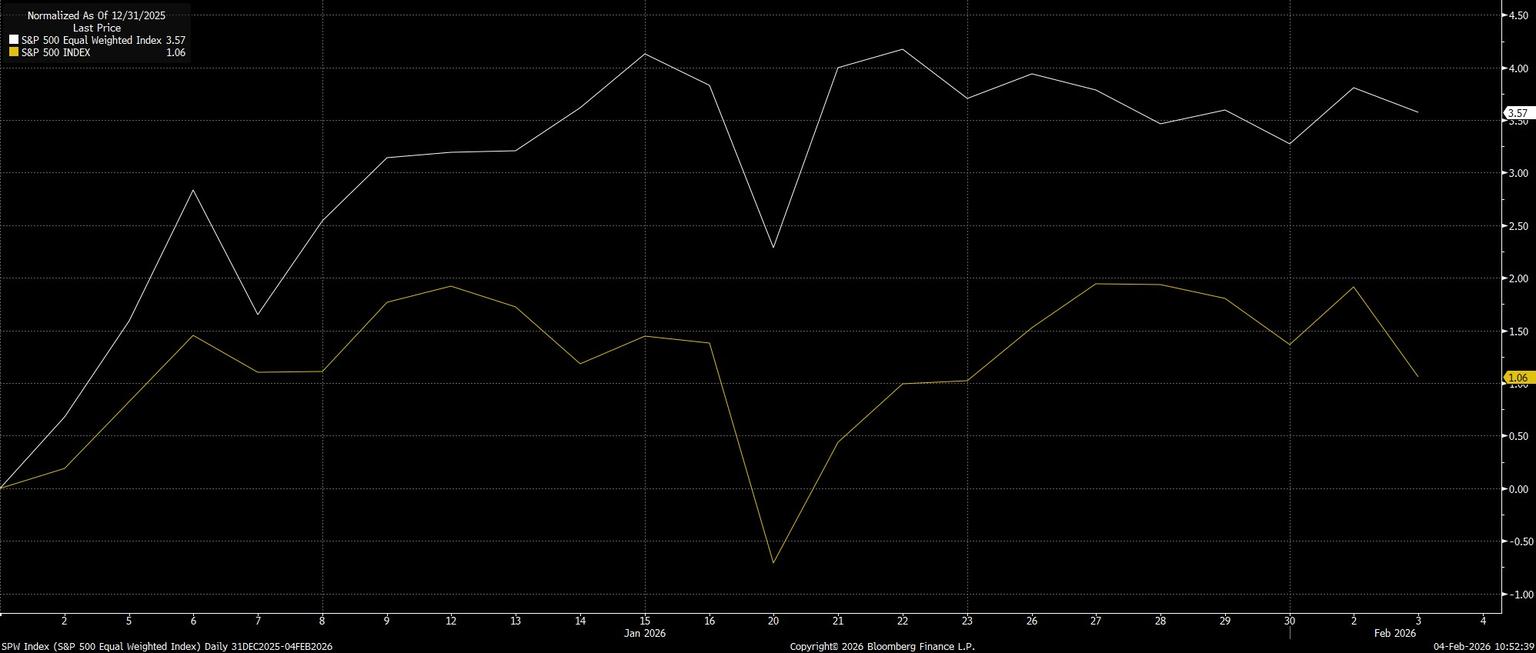
This is where the equal-weighted S&P index can play a role in telling a ‘truer’ story of market performance, removing the skew that the traditional cap-weighted index currently experiences. Here, the story is pretty clear – while the S&P is up around 1% YTD, the equal-weighted index has performed more than three times better.

Preview

I’d argue that a broader rally is no bad thing, and in fact could well prove to be a catalyst for a more durable rally moving forwards, not only if the rotation continues, but also with there being the potential for the tech sector to ‘catch-up’ once again, presenting an upside risk to markets at large.

Drivers Of The Rotation

That said, the catalysts behind the rotation also bear considering, given that there are both ‘push’ factors causing participants to reconsider their tech exposures, and ‘pull’ factors increasing the attractiveness of cyclical names.

In terms of the former, investors are not only mulling the aforementioned possibility that AI agents increasingly wear away at the business models of SAAS firms amid increasing adoption, but also examining the entire AI theme through a more critical lens. Enthusiasm towards AI has notably waned in recent months, with the market becoming increasingly bifurcated, not only amid concern over how capital expenditures will be financed (with debt-laten firms such as Oracle taking a battering), but also as concerns mount over concentration, or firms being over-exposed to particular AI outfits, as we see in the case of Microsoft and OpenAI.

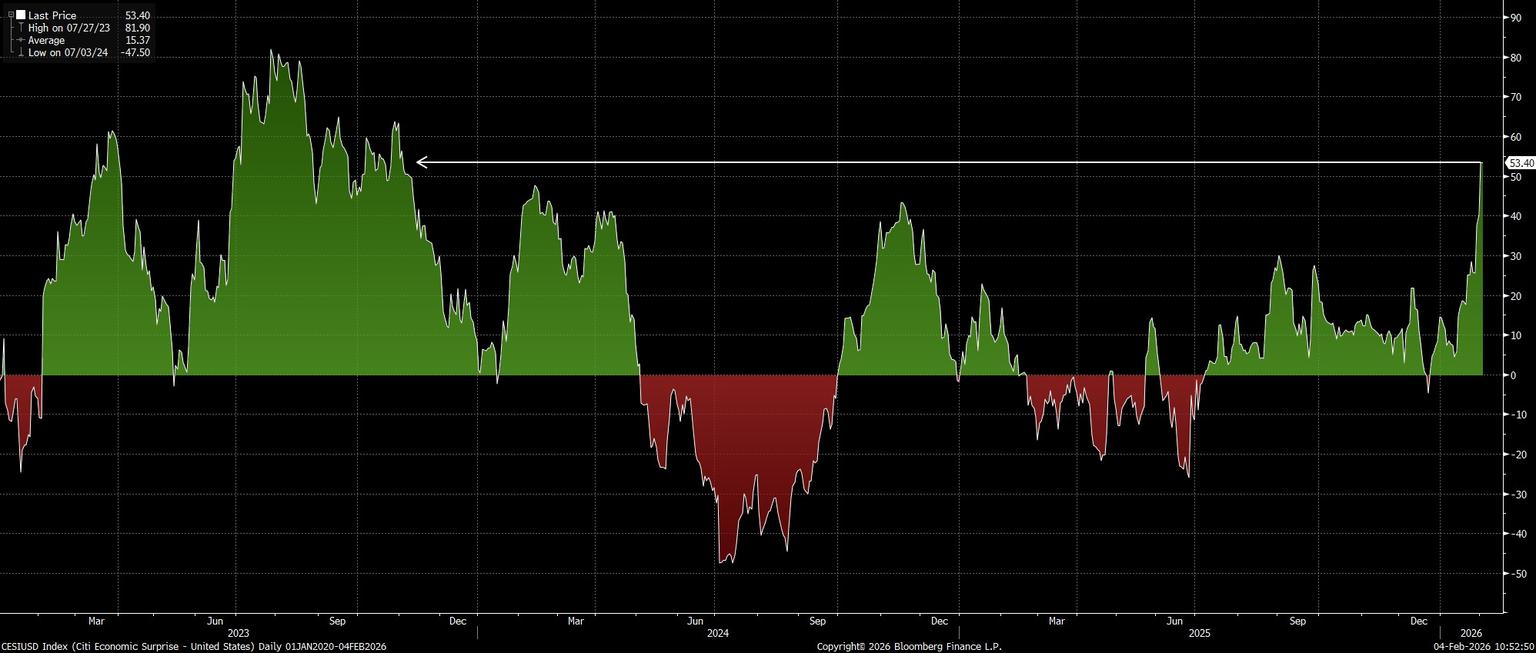
Concurrently, the case for cyclicals is becoming more compelling. This week, the ISM manufacturing survey rose back into expansionary territory, and to a 4-year high, at 52.6, implying that a broader economic reacceleration could be on the cards. Added to which, Citi’s economic surprise index indicates that incoming US data is beating expectations by the biggest margin in two-and-a-half years, potentially adding further fuel to the fire of the cyclical rotation.

Preview

Conclusion

In summary, then, the overall bull case for equities remains a robust one, amid a solid earnings backdrop, and robust earnings growth, coupled with looser monetary and fiscal backdrops as the year progresses.

However, while the ‘path of least resistance’ more broadly does continue to lead to the upside, we increasingly appear to be moving towards more of a ‘stock pickers’ market, where sector allocations take on greater importance than indiscriminate index-level buying.

The material provided here has not been prepared in accordance with legal requirements designed to promote the independence of investment research and as such is considered to be a marketing communication. Whilst it is not subject to any prohibition on dealing ahead of the dissemination of investment research we will not seek to take any advantage before providing it to our clients.

Pepperstone doesn’t represent that the material provided here is accurate, current or complete, and therefore shouldn’t be relied upon as such. The information, whether from a third party or not, isn’t to be considered as a recommendation; or an offer to buy or sell; or the solicitation of an offer to buy or sell any security, financial product or instrument; or to participate in any particular trading strategy. It does not take into account readers’ financial situation or investment objectives. We advise any readers of this content to seek their own advice. Without the approval of Pepperstone, reproduction or redistribution of this information isn’t permitted.

Other Sites

  • The Trade Off
  • Partners
  • Group
  • Careers

Ways to trade

  • Pricing
  • Trading accounts
  • Pro
  • Trading hours

Platforms

  • Trading platforms
  • TradingView
  • MT5
  • MT4
  • cTrader
  • Trading tools

Markets and Symbols

  • Forex
  • Shares
  • ETFs
  • Indicies
  • Commodities
  • Currency indicies
  • CFD forwards

Analysis

  • Navigating markets
  • The Daily Fix
  • Meet our analysts
  • Trading guides
  • Videos
  • Webinars

About

  • Press releases
Pepperstone logo
support@pepperstone.com
+448000465473+442038074724
70 Gracechurch St
London EC3V 0HR
United Kingdom
  • Legal documents
  • Privacy policy
  • Website terms and conditions
  • Cookie policy
  • Sitemap

© 2025 Pepperstone Limited
Company Number 08965105 | Financial Conduct Authority Firm Registration Number 684312

Risk warning: Spread bets and CFDs are complex instruments and come with a high risk of losing money rapidly due to leverage. 71.9% of retail investor accounts lose money when trading spread bets and CFDs with this provider. You should consider whether you understand how spread bets and CFDs work and whether you can afford to take the high risk of losing your money.

Trading derivatives is risky. It isn't suitable for everyone and, in the case of Professional clients, you could lose substantially more than your initial investment. You don't own or have rights in the underlying assets. Past performance is no indication of future performance and tax laws are subject to change. The information on this website is general in nature and doesn't take into account your or your client's personal objectives, financial circumstances, or needs. Please read our legal documents and ensure you fully understand the risks before you make any trading decisions. We encourage you to seek independent advice.

Pepperstone Limited is a limited company registered in England & Wales under Company Number 08965105 and is authorised and regulated by the Financial Conduct Authority (Registration Number 684312). Registered office: 70 Gracechurch Street, London EC3V 0HR, United Kingdom.

The information on this site is not intended for residents of Belgium or the United States, or use by any person in any country or jurisdiction where such distribution or use would be contrary to local law or regulation.