• Home
  • Pro
  • Partners
  • Help and support
  • English (UK)
Pepperstone logo
Pepperstone logo
  • Ways to trade
    • CFD trading

      Trade price movements with competitive spreads

    • Spread betting

      Bet on global price movements in £ per point

    • CFD trading

      Trade on 1000s of assets without owning them

    • Pricing

      Discover our tight spreads, plus all other possible fees

    • Trading accounts
    • Risk management
    • Demo trading
    • Trading hours
    • 24-hour trading
    • Maintenance schedule
  • Markets
    • Forex

      Get great rates on majors like EUR/USD, plus minors and exotics

    • Indices

      Enjoy 24-hour pricing on the UK100, US30 and more

    • Commodities

      Trade on metals, energies & softs, with oil spreads from 2 cents

    • Shares
    • ETFs
    • Currency indices
    • Dividends for index CFDs
    • Dividends for share CFDs
    • CFD forwards
  • Trading platforms
    • TradingView

      Trade through the world-famous supercharts with great pricing

    • MetaTrader 5

      Explore the apex in trading automation with our execution tech

    • The Pepperstone platform
    • MetaTrader 4
    • cTrader
    • Trading tools
  • Market analysis
    • Navigating markets

      Latest news and analysis from our experts

    • The Daily Fix

      Your regular round-up of key events

    • Meet the analysts

      Our global team giving your trading the edge

  • Learn
    • Trading guides

      Trading guides & educational materials

    • Webinars

      Grow your knowledge

  • About us
    • Who we are

      Pepperstone was born from the dream of making trading better

    • Pepperstone reviews
    • Company news
    • Company awards
    • Protecting clients online
    • CFD trading

      Trade price movements with competitive spreads

    • Spread betting

      Bet on global price movements in £ per point

    • CFD trading

      Trade on 1000s of assets without owning them

    • Pricing

      Discover our tight spreads, plus all other possible fees

    • Trading accounts
    • Risk management
    • Demo trading
    • Trading hours
    • 24-hour trading
    • Maintenance schedule
    • Forex

      Get great rates on majors like EUR/USD, plus minors and exotics

    • Indices

      Enjoy 24-hour pricing on the UK100, US30 and more

    • Commodities

      Trade on metals, energies & softs, with oil spreads from 2 cents

    • Shares
    • ETFs
    • Currency indices
    • Dividends for index CFDs
    • Dividends for share CFDs
    • CFD forwards
    • TradingView

      Trade through the world-famous supercharts with great pricing

    • MetaTrader 5

      Explore the apex in trading automation with our execution tech

    • The Pepperstone platform
    • MetaTrader 4
    • cTrader
    • Trading tools
    • Navigating markets

      Latest news and analysis from our experts

    • The Daily Fix

      Your regular round-up of key events

    • Meet the analysts

      Our global team giving your trading the edge

    • Trading guides

      Trading guides & educational materials

    • Webinars

      Grow your knowledge

    • Who we are

      Pepperstone was born from the dream of making trading better

    • Pepperstone reviews
    • Company news
    • Company awards
    • Protecting clients online
FOMC

Neutral Rate Revisited: Markets May Be Pricing the Fed Wrong

Michael Brown
Michael Brown
Senior Research Strategist
8 Jan 2026
Share
Revisiting the Fed’s neutral rate through history and balance sheet dynamics challenges the case for a higher terminal rate and argues for a longer, deeper easing cycle, and thus a more supportive backdrop for risk than the market may currently price.

Summary

  • History As A Guide: While models can be useful, reflecting on past instances of the Fed's dual mandate being achieved likely obtains us a more accurate estimate of where neutral lies
  • Two Policy Levers: The fed funds rate alone is just one part of the puzzle, with the balance sheet of pivotal importance too in driving the overall policy stance
  • Lower Neutral = Bullish Risk: A lower neutral rate than policymakers, and market participants, currently pencil in, could further support the bullish backdrop for equities, and front-end Treasuries

There can be a bit of a tendency to over-complicate things in this game; and, I’ll happily admit to falling victim to that on perhaps more than my fair share of occasions.

Hence, let’s revert to ‘first principles’ for a bit, and adopt the KISS strategy – Keep It Simple Stupid.

What A Neutral Rate Really Means

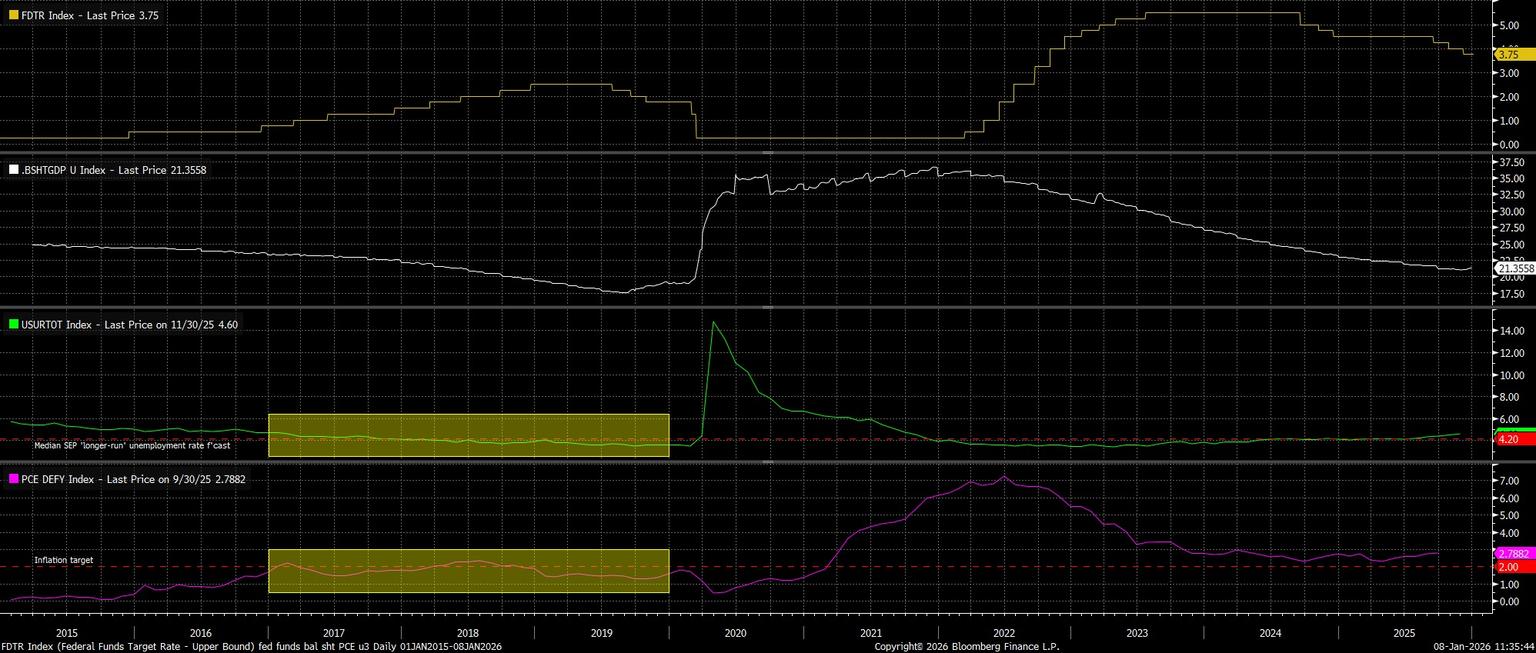
Consider what the FOMC are trying to achieve. The dual mandate gives policymakers two aims, to ensure price stability, and maximum employment. Commonly, we, and the Fed, define those objectives quantitatively as 2% inflation (measured by the PCE gauge), and unemployment around the 4-4.5% mark (seen as a reasonable guesstimate for NAIRU).

As policymakers now seek to remove policy restriction, the ultimate destination is likely to be the neutral rate. This is something that is very difficult, if not impossible, to quantify, but can be defined as an interest rate level where monetary policy is neither stimulating, nor restricting, economic activity. In other words, everything is nicely in balance.

While there are oodles of models out there attempting to calculate that neutral rate, perhaps the simplest way to gauge where that rate lies is to look back at recent history, and the last time that we had a ‘nirvana-esque’ economic environment. The period that immediately springs to mind is 2017 – 2019, where headline unemployment (U-3) hovered at or below the 4% mark, while headline inflation (PCE) was as near as makes no difference at the 2% target. During that time, the fed funds rate peaked at 2.50%. Everything was, judging by these variables, ‘fine and dandy’ from a macroeconomic perspective, meaning that we can reasonably assume that 2.50% fed funds rate to be a neutral monetary policy setting.

Preview

Little Suggests Neutral Should’ve Shifted

Perhaps the most important question, then, is to ask what could’ve caused that neutral rate to change, and potentially move higher, over the last decade or so.

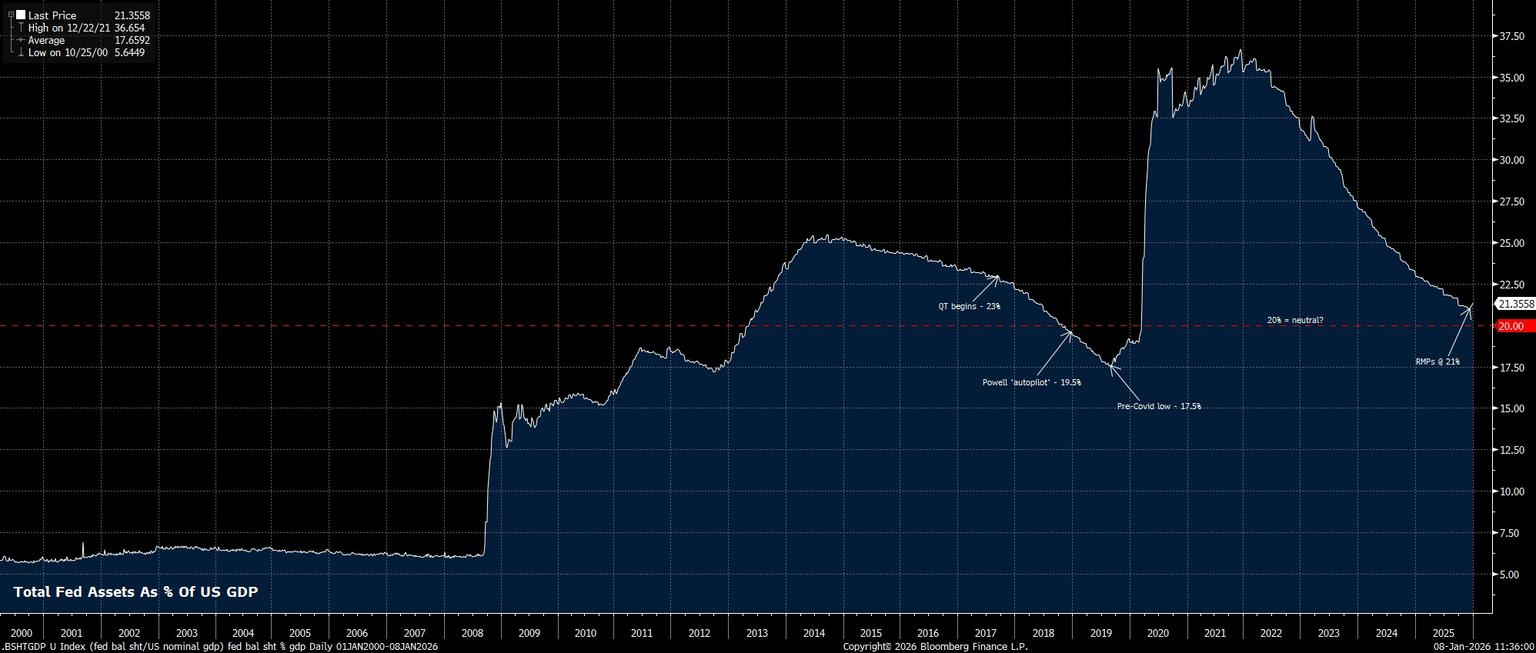
The argument that neutral is now considerably higher, potentially between 3% and 4%, seems to rest on the idea that this must be the case, simply because nothing in the economy ‘broke’ when the Fed hiked rates north of 5% in an attempt to bear down on the covid-era inflationary impulse. This, though, misses a key part of the puzzle, in that a >5% fed funds rate was accompanied by a balance sheet that ballooned to as much as 35% of GDP. Taking these two policy levers together means that the overall policy stance was considerably looser than just a cursory glance at the fed funds rate would imply.

Preview

Quantifying the impact of balance sheet shifts on the overall stance is a bit of an imperfect science, though a decent ‘rule of thumb’ is that a +/-$1tln change in the balance sheet has an equivalent impact of +/-50bp to the FFR. This means that, in practical terms, the fed funds rate was effectively much lower, thus policy much less restrictive, during the last hiking cycle, than otherwise would’ve been the case. In turn, the argument that the neutral rate must be higher simply because a 5% FFR didn’t feel restrictive starts to lose its potency. This is especially true considering that structural arguments for a higher neutral rate (e.g. AI driven productivity gains, demographic shifts, runaway fiscal spending, etc.) also don’t hold especially much water right now.

The ‘Here & Now’

Speaking of right now, the balance sheet is back at a neutral level, at around 21.5% of GDP – unsurprisingly, roughly where it was during those ‘nirvana’ days of the late-2010s. With the balance sheet no longer cushioning against any tightening impact from the fed funds rate there is, in my mind, little reason to believe that the nominal neutral rate is any different from those days either, namely being around the 2.5% mark.

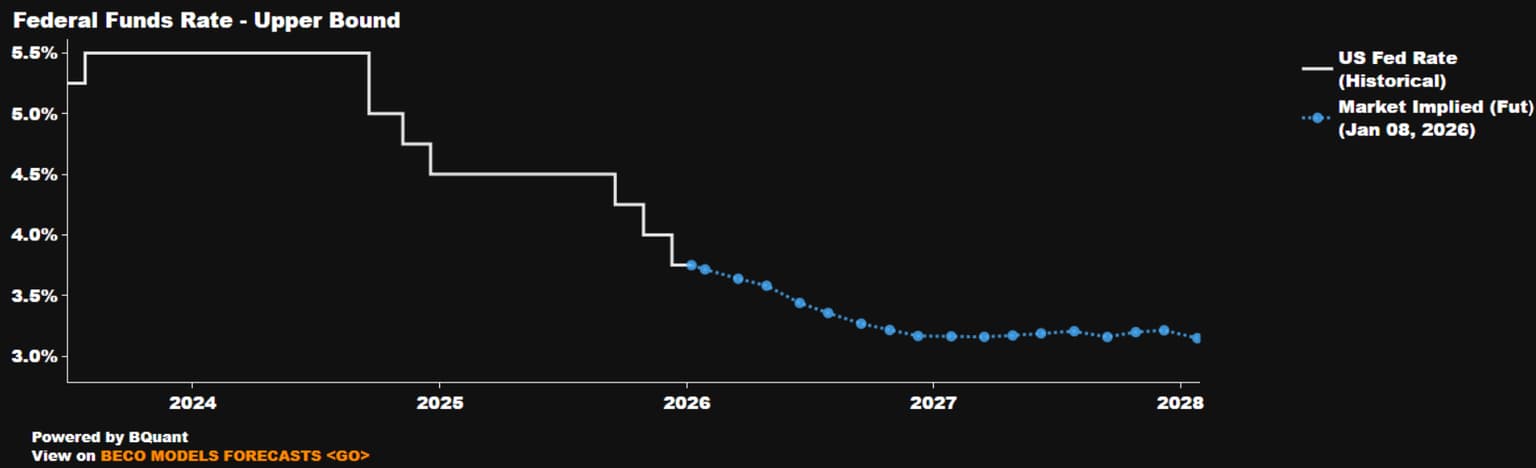
If this is indeed the case, and FOMC members have mistakenly pencilled in a much higher neutral rate than is actually the case, then the implications are relatively obvious – namely, that the ongoing easing cycle will likely last longer, and result in a much lower terminal rate, than the 3.0% by year-end that markets currently price.

Preview

In turn, such a scenario would clearly be supportive for STIRs, as well as front-end Treasuries, while also further strengthening the equity bull case, given both that the policy backdrop would be significantly looser than currently priced, implying a much stronger ‘Fed put’ structure than is currently discounted. 

The material provided here has not been prepared in accordance with legal requirements designed to promote the independence of investment research and as such is considered to be a marketing communication. Whilst it is not subject to any prohibition on dealing ahead of the dissemination of investment research we will not seek to take any advantage before providing it to our clients.

Pepperstone doesn’t represent that the material provided here is accurate, current or complete, and therefore shouldn’t be relied upon as such. The information, whether from a third party or not, isn’t to be considered as a recommendation; or an offer to buy or sell; or the solicitation of an offer to buy or sell any security, financial product or instrument; or to participate in any particular trading strategy. It does not take into account readers’ financial situation or investment objectives. We advise any readers of this content to seek their own advice. Without the approval of Pepperstone, reproduction or redistribution of this information isn’t permitted.

Other Sites

  • The Trade Off
  • Partners
  • Group
  • Careers

Ways to trade

  • Pricing
  • Trading accounts
  • Pro
  • Trading hours

Platforms

  • Trading Platforms
  • TradingView
  • MT5
  • MT4
  • cTrader
  • Trading tools

Markets and Symbols

  • Forex
  • Shares
  • ETFs
  • Indicies
  • Commodities
  • Currency indicies
  • CFD forwards

Analysis

  • Navigating Markets
  • The Daily Fix
  • Meet Our Analysts

Learn to trade

  • Trading guides
  • Videos
  • Webinars
Pepperstone logo
support@pepperstone.com
+448000465473+442038074724
70 Gracechurch St
London EC3V 0HR
United Kingdom
  • Legal documents
  • Privacy policy
  • Website terms and conditions
  • Cookie policy
  • Sitemap

© 2025 Pepperstone Limited
Company Number 08965105 | Financial Conduct Authority Firm Registration Number 684312

Risk warning: Spread bets and CFDs are complex instruments and come with a high risk of losing money rapidly due to leverage. 71.9% of retail investor accounts lose money when trading spread bets and CFDs with this provider. You should consider whether you understand how spread bets and CFDs work and whether you can afford to take the high risk of losing your money.

Trading derivatives is risky. It isn't suitable for everyone and, in the case of Professional clients, you could lose substantially more than your initial investment. You don't own or have rights in the underlying assets. Past performance is no indication of future performance and tax laws are subject to change. The information on this website is general in nature and doesn't take into account your or your client's personal objectives, financial circumstances, or needs. Please read our legal documents and ensure you fully understand the risks before you make any trading decisions. We encourage you to seek independent advice.

Pepperstone Limited is a limited company registered in England & Wales under Company Number 08965105 and is authorised and regulated by the Financial Conduct Authority (Registration Number 684312). Registered office: 70 Gracechurch Street, London EC3V 0HR, United Kingdom.

The information on this site is not intended for residents of Belgium or the United States, or use by any person in any country or jurisdiction where such distribution or use would be contrary to local law or regulation.