- English (UK)
Oil Market Volatility Crisis: Have We Passed the Peak of the Energy Shock?

Key Takeaways
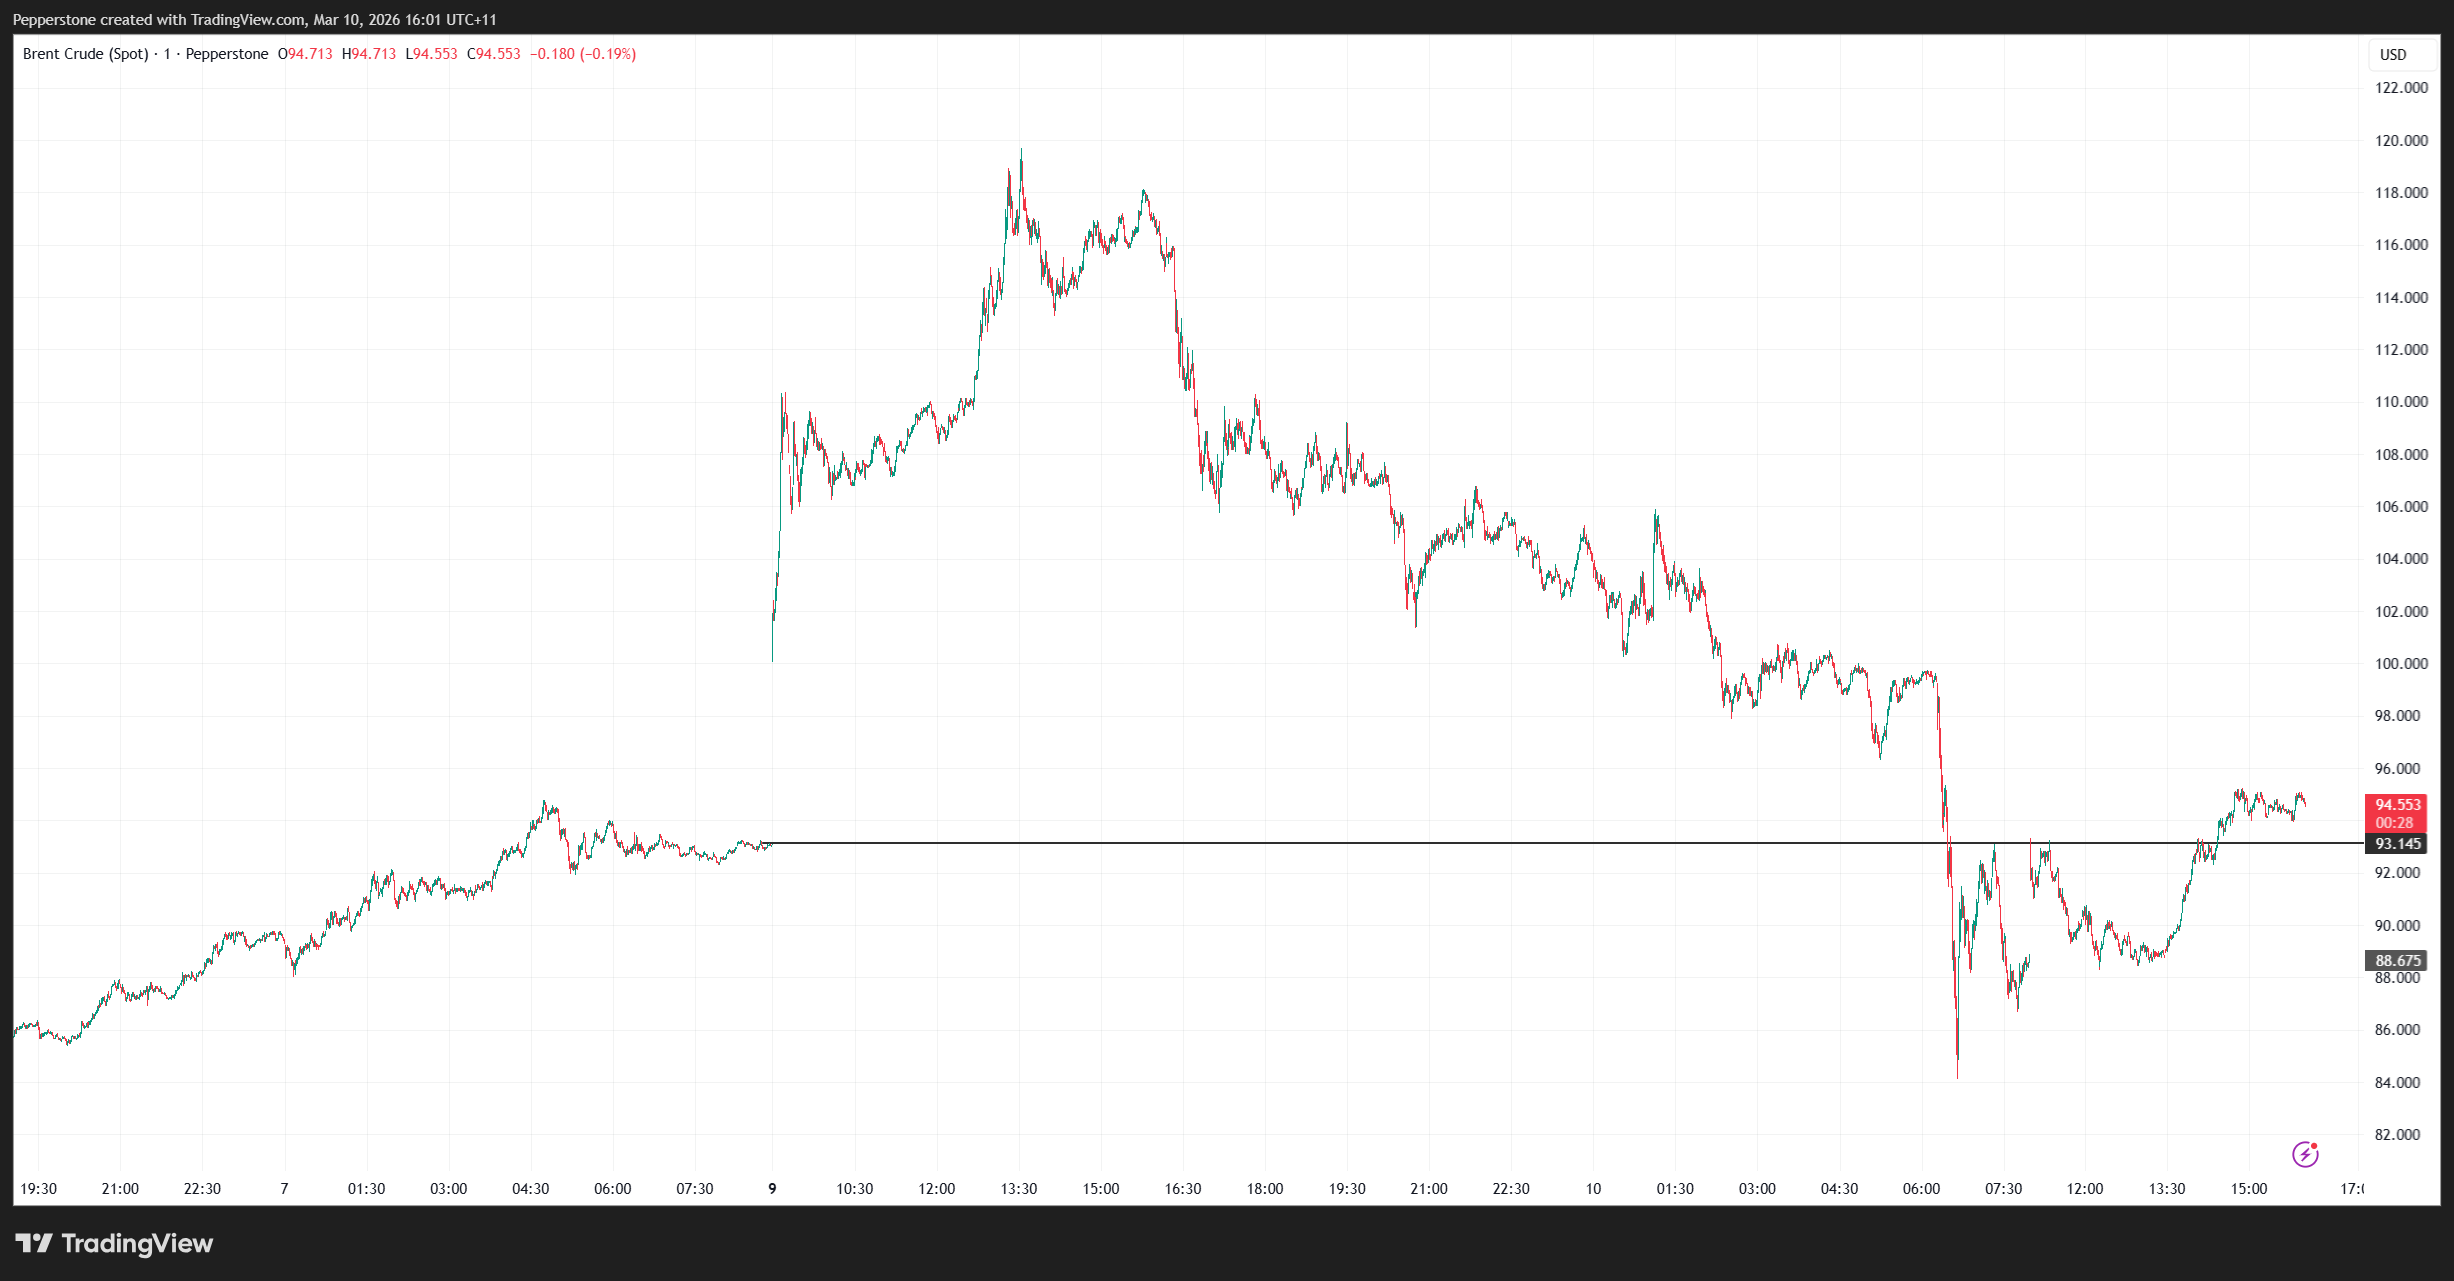
• Brent crude surged to $119.50 during one of the most violent energy market moves in recent years
• Crude futures Prompt spreads widened dramatically, with the front-month vs six-month spread reaching $33, signalling severe perceived near-term supply tightness
• Oil volatility spiked to extreme levels, with OVX hitting 118% and one-week WTI implied volatility reaching 171%
• Although crude has pulled back and market conditions have improved, key volatility and supply indicators remain elevated
• The Straits of Hormuz and geopolitical developments remain the critical catalysts for the next move in energy markets
Financial markets appear to be moving through a marked turning point after one of the most dramatic energy volatility shocks seen in recent memory. There are emerging signs that policymakers are increasingly aware of the systemic impact the energy surge has had across financial markets.
The Trump administration has shown greater sensitivity to the extreme volatility that has spread far beyond crude oil itself. The shock has filtered through fertilizer markets, agricultural commodities, equity volatility, and rates markets, creating a cross-asset risk event that was beginning to resemble crisis conditions in certain parts of the energy complex.
Extreme Technical Overbought Conditions
At the peak of the rally, technical indicators in the crude market had reached extraordinary levels. The relative strength index (RSI) on crude surged to 96, an almost unheard-of reading that signalled an extremely overbought market.
While technical indicators alone do not drive policy decisions, they illustrated the intensity of the market dislocation.
A Deeply Backwardated Oil Futures Curve Signals Supply Stress
More telling was the structure of the oil futures curve.
The 'prompt spread', which measures the difference between the crude front-month crude future and the six-month futures contract, blew out to $33. This created one of the most extreme backwardated curves seen in years. Backwardation occurs when near-term prices trade significantly above future prices, reflecting an urgent demand for immediate supply. In normal market conditions, the prompt spread would typically sit around $2 to $3.
Prior to the escalation of the conflict on 28 February, that was precisely the range being observed. At $33, the market was effectively signalling acute supply tightness and a scramble for available barrels. Supply Disruptions Amplify Market Stress The news flow at the time supported these fears. Shipping traffic through the Straits of Hormuz had slowed dramatically, creating a near standstill for several cargo routes. Analysts estimated that a combination of storage constraints and logistical disruptions forced several Gulf states to curtail production. The estimated supply impact reached 3.5 million barrels per day, a significant reduction in global supply. In addition, Iranian energy facilities were reportedly impacted, reinforcing expectations that output would remain constrained.
Refining Margins Surge as Crack Spreads Blow Out
Another signal of the market stress was the sharp move in crack spreads, which measure the profitability of refining crude into petroleum products such as gasoline and diesel.
The 'crack spread' surged to $46, compared with a typical level of around $24. This implied extremely strong refining margins for operators able to secure crude supply.
In other words, refiners that could access barrels were operating in a highly profitable environment despite the broader volatility.
Oil Volatility Reaches Extremes
Perhaps the most striking feature of the episode was the explosion in oil volatility and hedging activity.
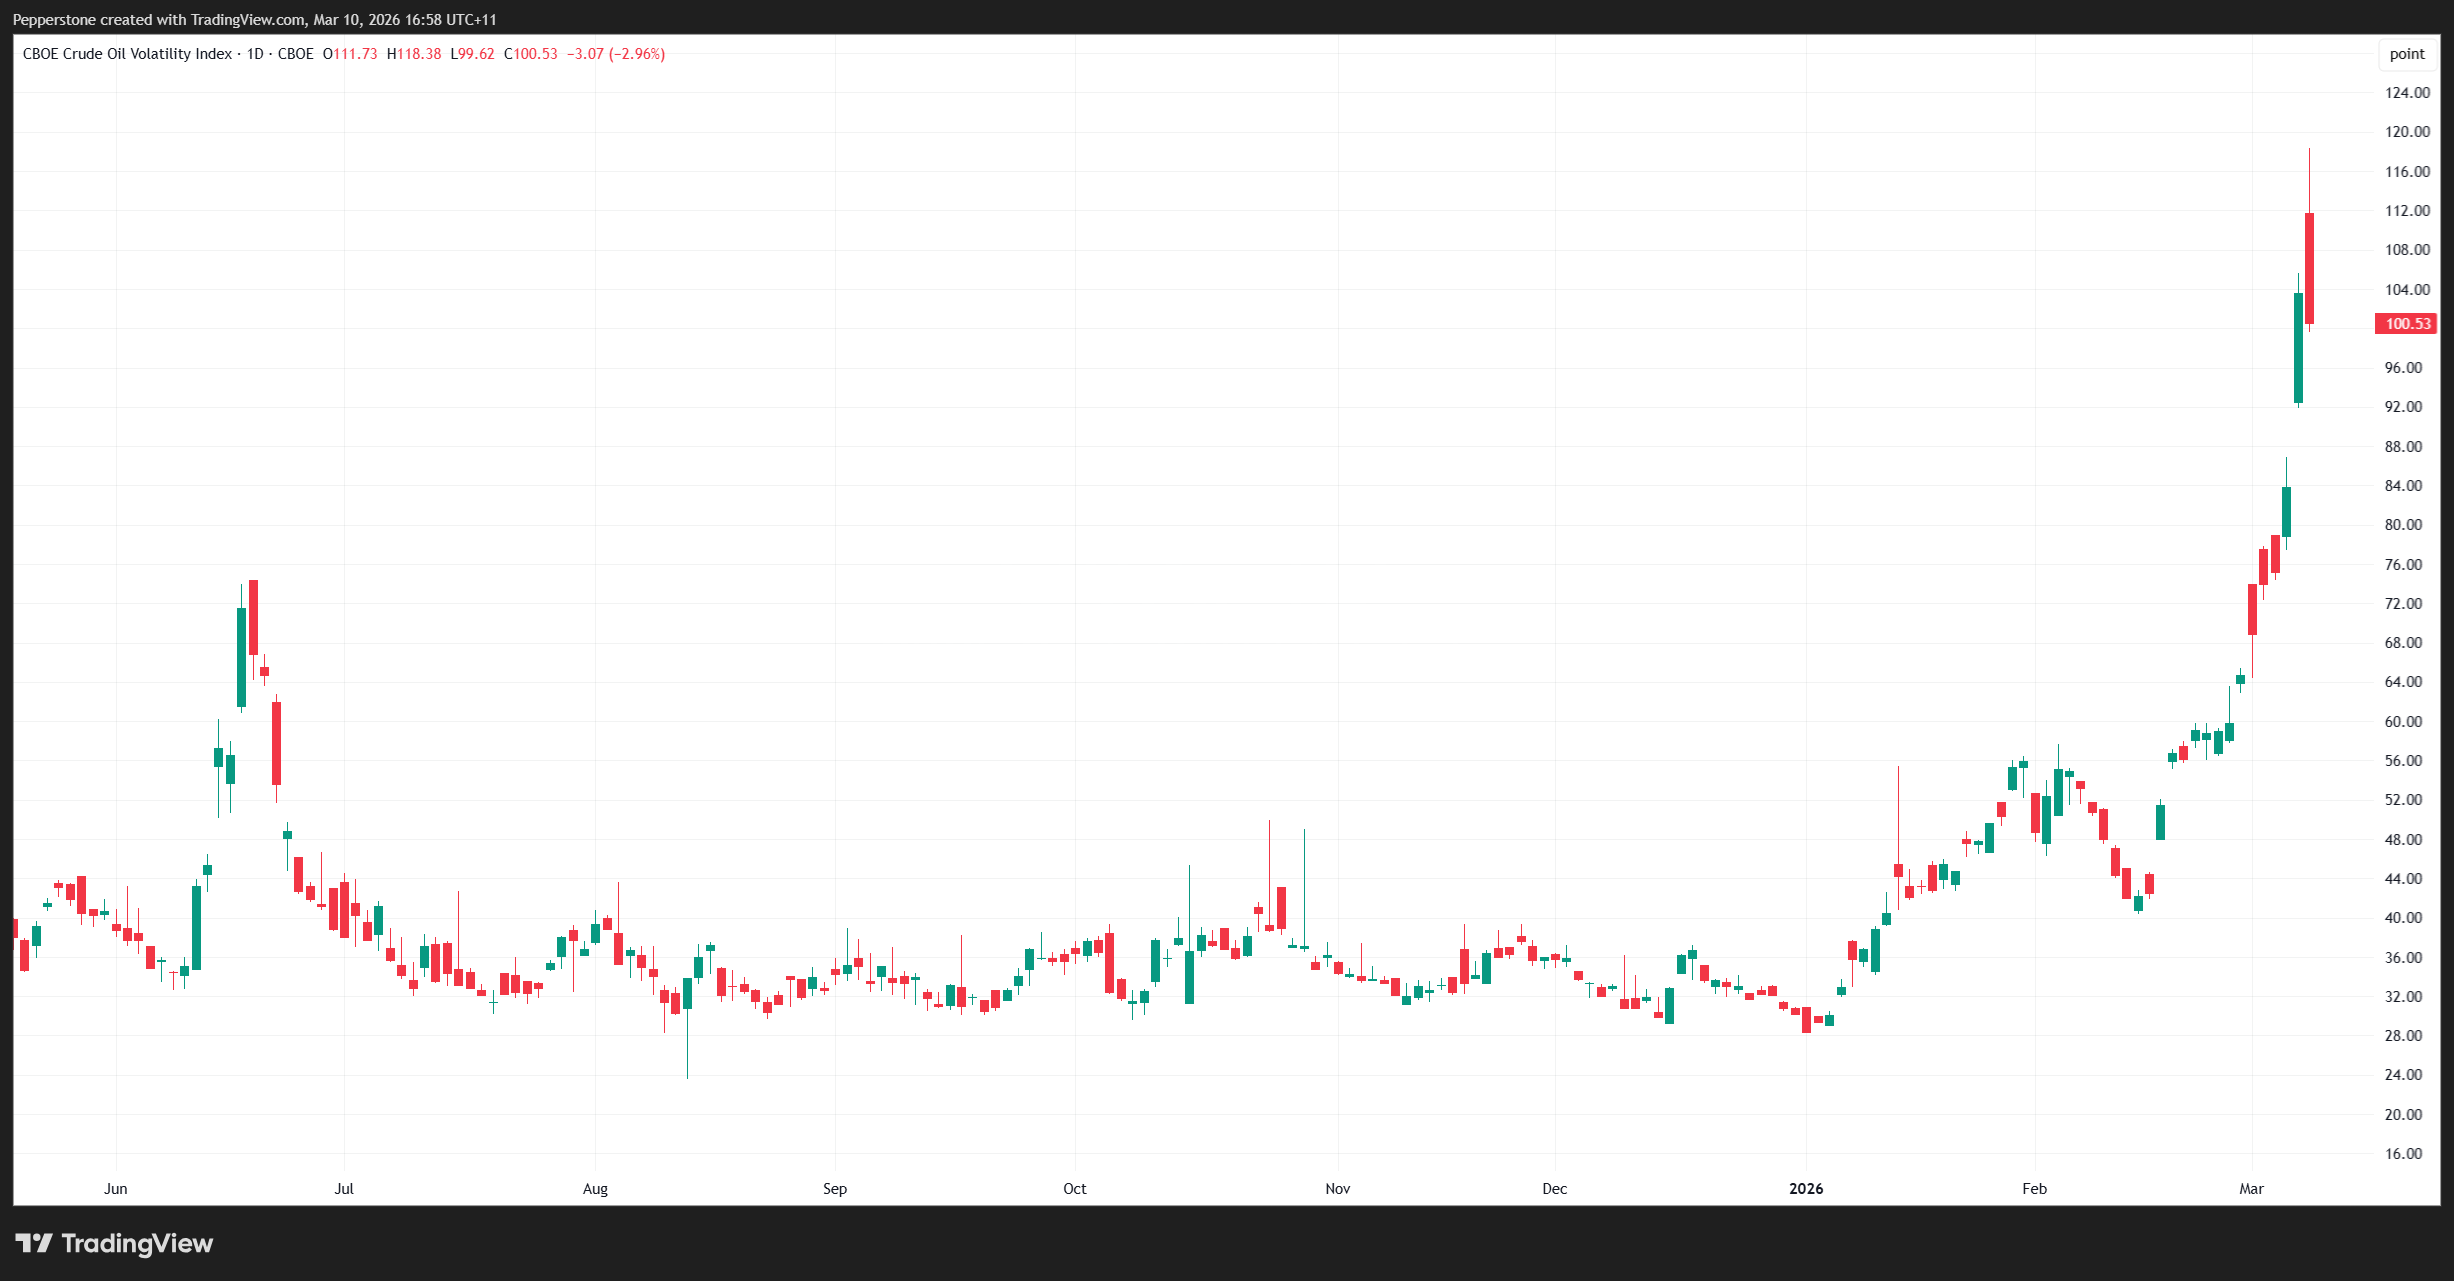
The OVX, often referred to as the oil market's version of the VIX, surged to 118%. For context, the index typically traded around 50% prior to the conflict and as low as 20 to 30% in December. At the same time, one-week at-the-money implied volatility in WTI reached 171%, implying daily price swings of nearly -/+11%.
At such extreme volatility levels, market functionality often begins to deteriorate.
Liquidity at the top of the order book declines sharply, price discovery becomes difficult, and markets can move aggressively even on relatively small order flow.
Options Skew Reveals Aggressive Hedging of Further Oil Upside
The options market also offered insight into trader sentiment.
Call options were trading at a significant implied volatility premium relative to puts, showing intense demand for upside protection against further oil price spikes.
This skew reflected fears that supply disruptions could escalate further and drive crude even higher.
Massive Trading Volumes Highlight Market Stress
Trading volumes across oil-related products also surged dramatically. The USO oil ETF recorded 899,000 shares traded, far above its 20-day average of 185,000 shares. This surge in activity reflected both speculative trading and hedging flows as investors attempted to navigate the extreme volatility.
Inflation Expectations Begin to React
The energy shock also began feeding directly into the market's pricing of inflation expectations. US one-year inflation swaps rose from 2.75% to 3.10%, signalling a rapid repricing of near-term inflation risks. Rising inflation expectations can quickly become problematic for bond markets, particularly if they appear to become unanchored.
Currency volatility also increased as markets began to price the macroeconomic implications of sustained high energy prices. The dynamic quickly became a highly correlated cross-asset trade, with energy, inflation expectations, rates, and currencies moving together.
Policy Messaging Helps Calm Markets
Recent messaging from the G7 nations of release oil reserves, as well as from the Trump administration has helped ease some of the most extreme market fears.
Officials have suggested that the conflict could move toward resolution sooner than previously anticipated, while also warning Iran that any attempt to further disrupt the Straits of Hormuz would prompt a forceful US response.
Iran has countered these statements by maintaining that it retains control of the situation and will end the conflict on its own terms.
Where Oil Markets Stand Now
After one of the largest intraday range moves seen in years, crude prices have begun to stabilise. Brent crude recovered from a low of $84 during the Asian session and currently trades near $94.53. However, the market is not yet out of the woods.
Several key indicators remain elevated, suggesting high risk remains:
• 1-to-6-month futures prompt spreads are still around $17
• Crack spreads are approximately $35, well above historical norms
• OVX volatility index is near 100%
• One-week Brent implied volatility is about 133%
• Options skew shows calls trading 32 volatility points above puts
These readings suggest the market still expects significant volatility ahead.
Key Catalysts Traders Should Watch
The next phase of the oil market will likely depend on several critical factors.
• The ease of shipping through the Straits of Hormuz
• Whether Gulf producers restore curtailed output
• Ongoing geopolitical developments between the US and Iran
• Inflation expectations and central bank reaction functions From a price perspective, $100 in Brent remains a clear psychological level that traders will watch closely.
Conversely, a break back below $84.16, the recent session low, could trigger profit-taking from long positions and encourage the unwinding of hedges.
Final Thoughts
Markets have clearly stepped back from the brink following one of the most violent energy market moves in recent memory.
Extreme positioning and volatility have begun to normalise, and policymakers appear more sensitive to the broader financial stability implications of the energy shock. However, volatility remains elevated and the futures curve still signals tight supply conditions.
For now, traders remain highly dependent on the headline flow, and until shipping through the Straits of Hormuz returns to something resembling normality, energy markets are likely to remain volatile.
The material provided here has not been prepared in accordance with legal requirements designed to promote the independence of investment research and as such is considered to be a marketing communication. Whilst it is not subject to any prohibition on dealing ahead of the dissemination of investment research we will not seek to take any advantage before providing it to our clients.
Pepperstone doesn’t represent that the material provided here is accurate, current or complete, and therefore shouldn’t be relied upon as such. The information, whether from a third party or not, isn’t to be considered as a recommendation; or an offer to buy or sell; or the solicitation of an offer to buy or sell any security, financial product or instrument; or to participate in any particular trading strategy. It does not take into account readers’ financial situation or investment objectives. We advise any readers of this content to seek their own advice. Without the approval of Pepperstone, reproduction or redistribution of this information isn’t permitted.