- English (UK)
Gold prices drop under $4,000 amid renewed optimism on US-China trade talks


Summary
- Sharp Decline: Gold prices fell 4.5% to start the week, breaking below the 4000 to print a low of 3921.78 (at time of writing 0730 GMT)
- Catalysts: Renewed optimism over a potential US-China trade breakthrough lifted risk appetite, driving flows away from gold.
- 48 Hour Focus: Federal Reserve Rate Decision, Q3 Earnings of Magnificent Seven Corporates, Bank of Japan Rate Decision, President Trump and President Xi Summit, ECB Rate Decision
What factors are driving the gold price?
Gold prices have been under pressure over the last 7 trading days on concerns that the recent race to record highs of 4381.41 seen on Monday October 20th has become over extended, exposing weak long positions to a painful downside correction.
Gold 4 hour chart:
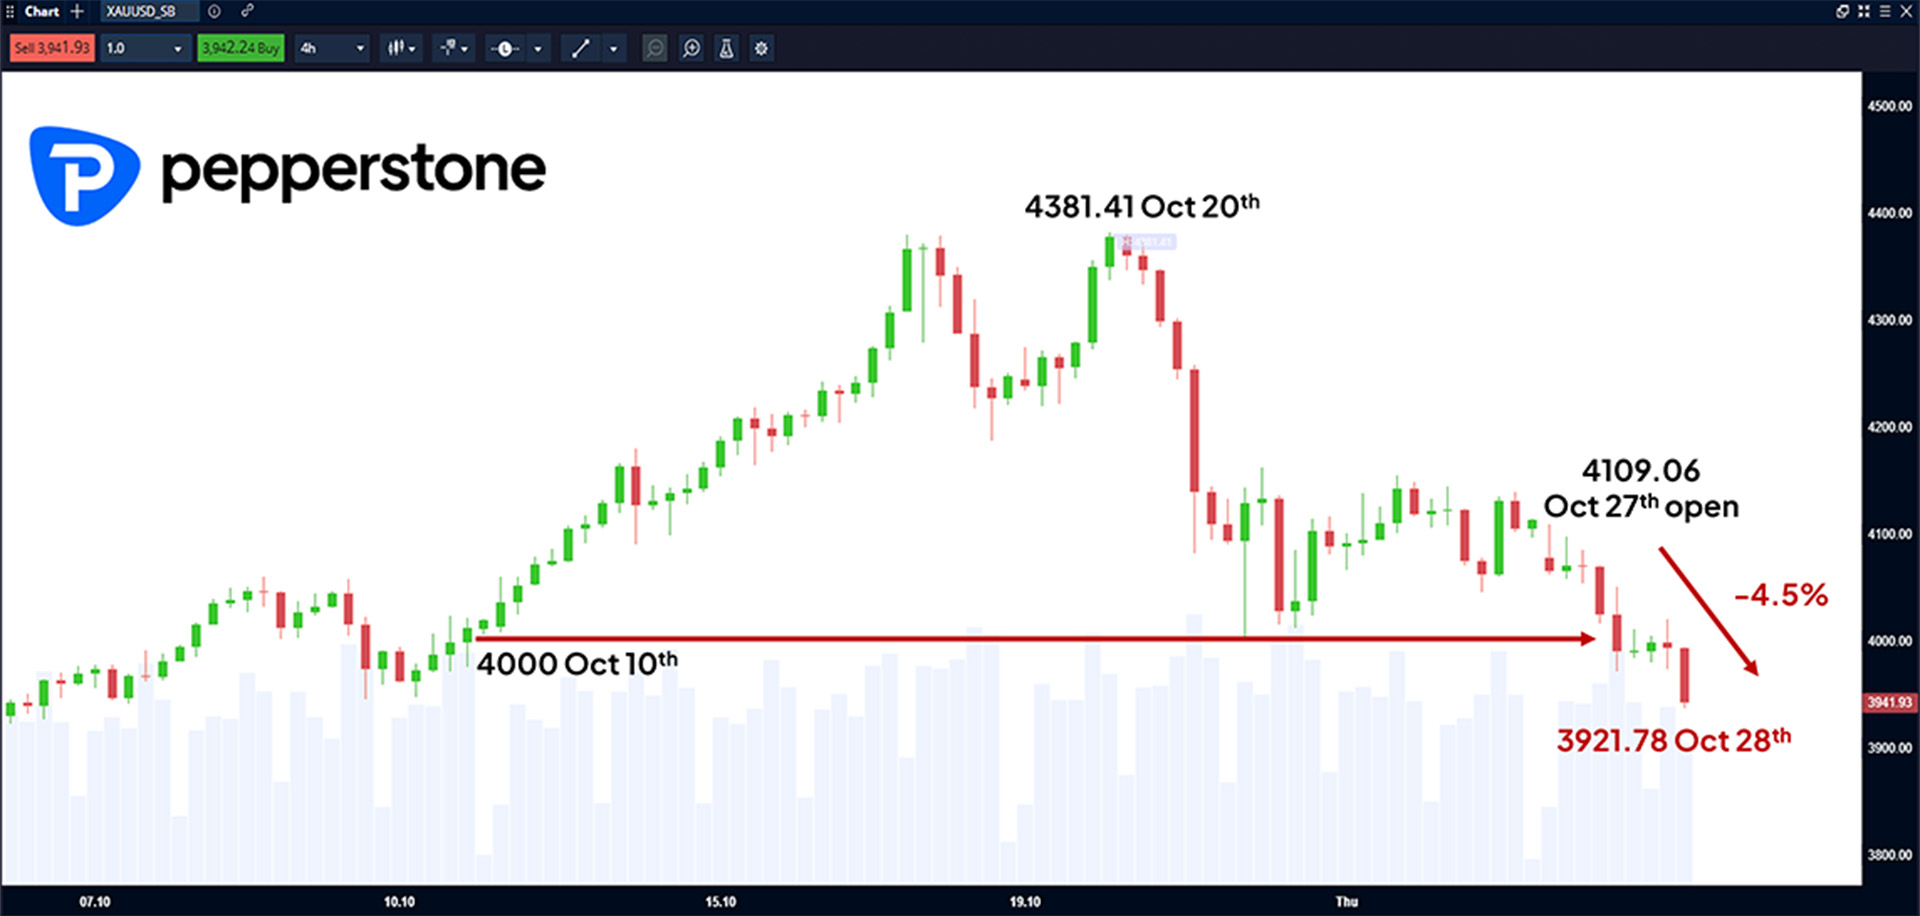
The latest sell-off from opening levels on Monday October 27th at 4109 to a low this morning of 3921.78 (as of 0730 GMT) has been on weekend reports that US and Chinese negotiators have set up a series of agreements on soybeans, rare earth metals and export controls for US President Trump and Chinese President Xi to ratify when they meet face to face for the first time in 6 years at a Summit in South Korea.
Gold is seen as a popular safe haven asset and as a rule experiences higher demand in times of risk aversion due to economic and/or geo-political uncertainty. The expectation of a trade agreement between the world’s 2 largest economies potentially removes some of that uncertainty and has led to increased risk appetite, lowering the need to own Gold in the short term.
What’s the outlook for gold from here
The short-term outlook for Gold remains a challenging one as traders turn cautious on where prices could move next with 3 major central bank meetings, earnings releases from 5 of the Magnificent Seven corporates and the summit between President Trump and President Xi to navigate in the next 48 hours, all of which could influence the direction of risk sentiment.
Wednesday:
- 1800 GMT Federal Reserve Interest Rate Decision, 1830 GMT Press Conference led by Chairman Powell
- Q3 Earnings Alphabet, Microsoft and Meta
Thursday:
- 0300 GMT Bank of Japan Interest Rate Decision, 0630 GMT Press Conference led by Governor Ueda
- President Trump and President Xi Meeting
- 1315 GMT ECB Interest Rate Decision, 1345 GMT Press Conference led by President Lagarde
- Q3 Earnings Amazon and Apple
Technical update - gold daily chart:
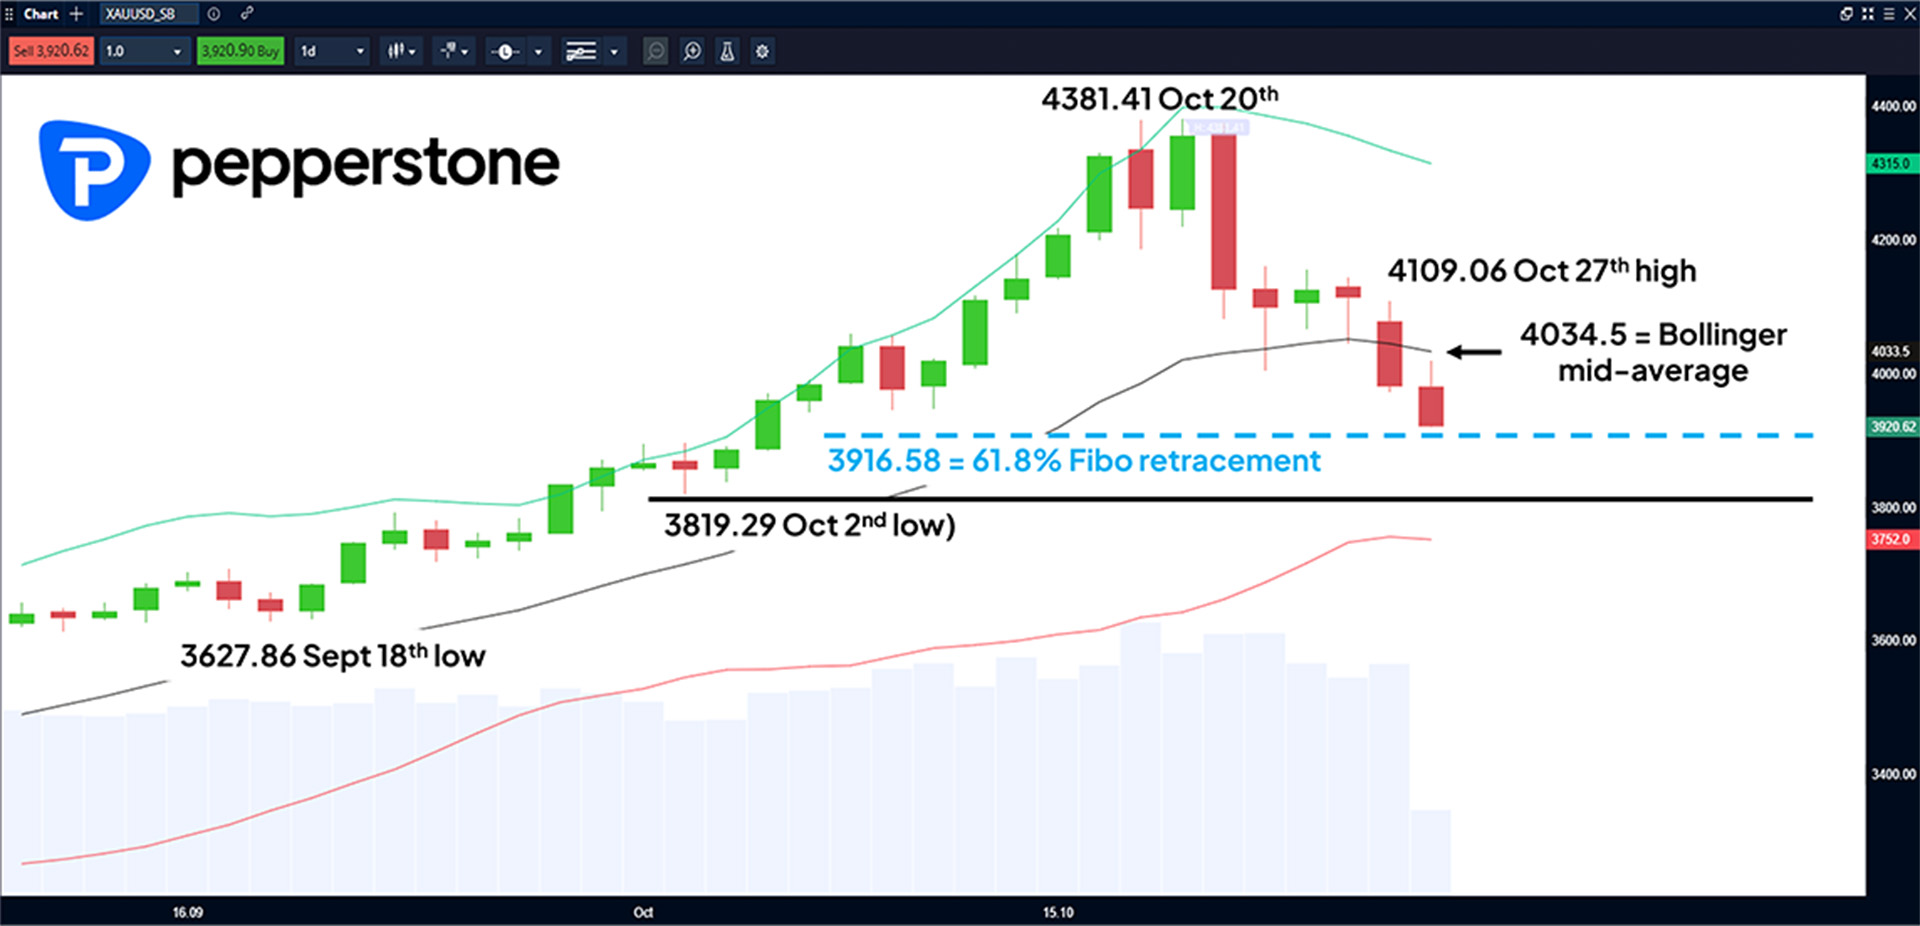
As you can see from the daily chart above, Gold prices have broken and closed below support provided by the Bollinger mid-average at 4034.6, which has now turned lower indicating the trend has initiated a move to the downside.
Price action this morning has tested potential support at 3916.58, which is the 61.8% Fibonacci retracement (Sept 18th low to Oct 20th high) and is currently holding, however a closing break below this level could open potential for moves down towards 3819.29, which is the October 2nd low, even 3717.43 the September 24th low.
On the topside, potential resistance may initially be found at the psychological 4000 level, with the declining Bollinger mid-average located at 4034.5. A closing break back above the mid-average could open a deeper squeeze towards 4109.06 (Monday’s high), even 4161.27 (Oct 22nd high).
Support: 3916.58 (61.8% retracement), 3819.29 (Oct 2nd low), 3717.43 (Sept 24th low)
Resistance: 4000 (Psychological barrier), 4034.5 (Bollinger mid-average), 4109.06 (Monday’s high), 4161.27 (Oct 22nd high)
The material provided here has not been prepared in accordance with legal requirements designed to promote the independence of investment research and as such is considered to be a marketing communication. Whilst it is not subject to any prohibition on dealing ahead of the dissemination of investment research we will not seek to take any advantage before providing it to our clients.
Pepperstone doesn’t represent that the material provided here is accurate, current or complete, and therefore shouldn’t be relied upon as such. The information, whether from a third party or not, isn’t to be considered as a recommendation; or an offer to buy or sell; or the solicitation of an offer to buy or sell any security, financial product or instrument; or to participate in any particular trading strategy. It does not take into account readers’ financial situation or investment objectives. We advise any readers of this content to seek their own advice. Without the approval of Pepperstone, reproduction or redistribution of this information isn’t permitted.