- English (UK)

Bitcoin – higher for a seventh day
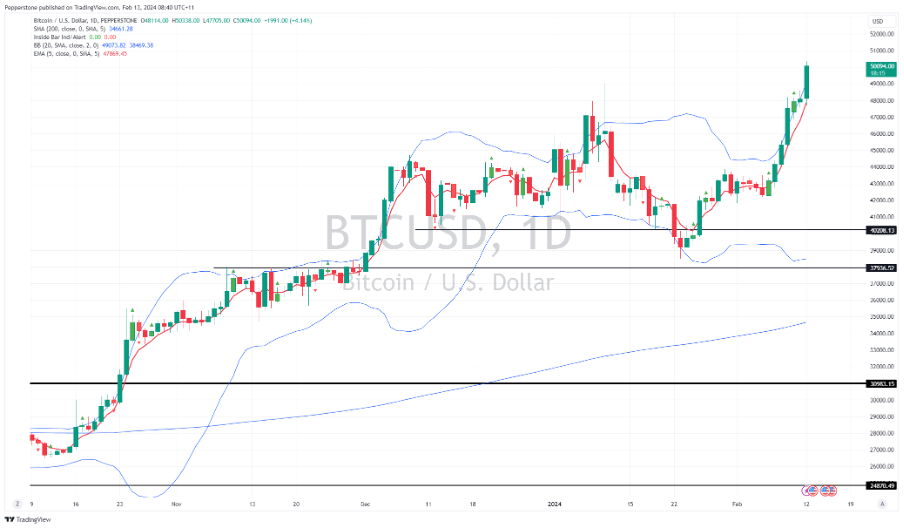
The offer has come out of the market and the buyers are seemingly happy to pay up for what they can get, with BTCUSD eyeing a daily close above $50k and pushing higher for a seventh consecutive day. Consider that since 2010 we’ve seen 64 occurrences where Bitcoin has had such a run of form and while we have seen an 8th consecutive day of gains on 56% of these occurrences, taking this out we see price higher the following 10 days in 85% of these occurrences. We can look at the $9b+ of capital that has made its way in the 9 new cash ETFs as inspiration, and the positive adoption story that’s unfolding, but Bitcoin is not the only crypto on a tear, and we see trending price action in ETHUSD, UNIUSD, LINKUSD, and LTCUSD (to name a few from Pepperstone’s offering). We also see that price action in Bitcoin looks similar to high beta momentum equities, and also ‘high short interest’ equity baskets, so this seems to be a momentum play in higher risk instruments. Tactically, given the positive flow and price action longs remain the higher probability outcome and pullbacks should be well supported – especially with the Ethereum spot ETF likely approved by May and the Bitcoin halving in April.
US2000 – small caps getting the love
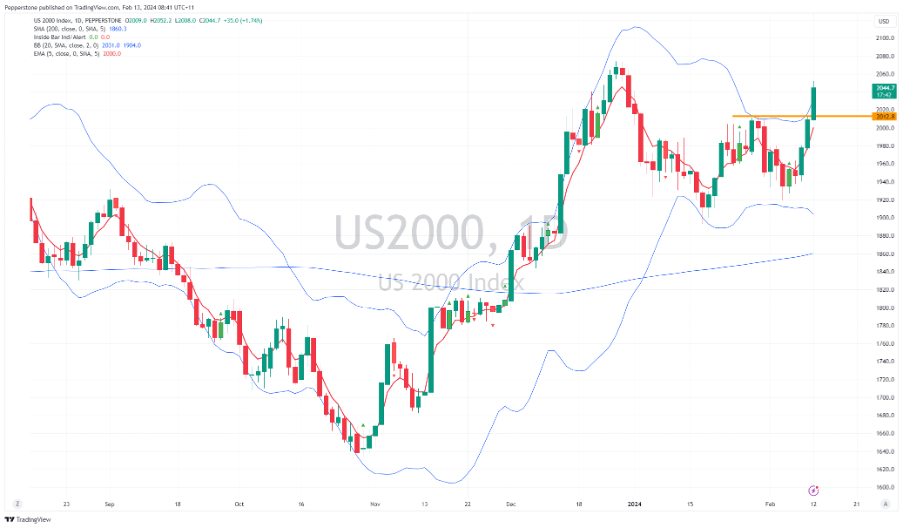
The US2000 is seeing some good flow of late and is a clear outperformer within our global equity indices offering. The break of the double bottom neckline of 2013 suggests a move into the Dec highs of 2073 is now clearly possible. The risk bulls will be enthused at the rotation we’re seeing within sectors and style factors - but for now, small caps are seeing their time in the sun - how much of the recent rally can be attributed to short covering and how much pure organic buying?
Nvidia (NVDA) – Indecision needs monitoring
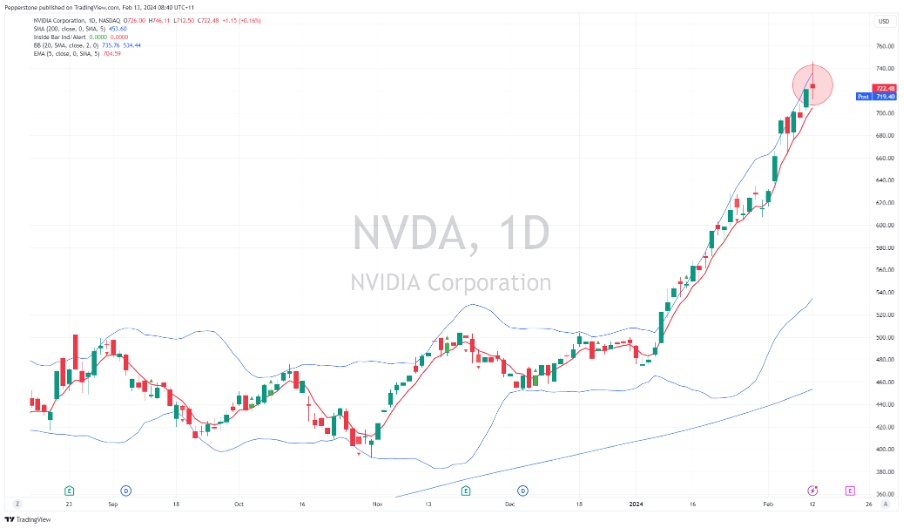
For a period in today’s US cash equity session, we saw Nvidia hit $746.11, where it became the fourth most valuable US company, briefly overtaking Amazon’s market cap. While macro factors and the subsequent sector rotation flows will influence price action, Nvidia shareholders will be eagerly awaiting results from the AI giant on 21 Feb and already we can see the market is anticipating big movement on the day of reporting, with options pricing suggesting we see a -/+9.1% move on the day. For now, after a 53% run-up since January we can see a pronounced ‘doji’ candle on the daily, signalling indecision from market participants, which makes sense after the recent run and ahead of US CPI in the session ahead. Price action in Nvidia does need monitoring for signs that the structure may change, and where the sellers get a better say…. while the macro doesn’t suggest a solid liquidation is on the cards, the implications of a pullback into earnings could have big implications for the US500 and NAS100.
China CN50 index – 12000 coming into view
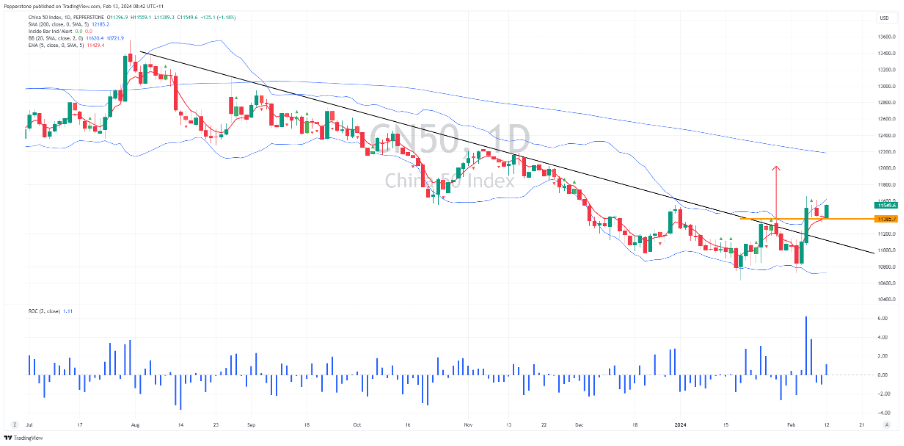
While China mainland equity cash markets remain closed for LNY traders can still monitor and trade China equity through the CN50 index, where the futures trade on the Singapore exchange and remain open. It has been exhausting keeping up with the barrage of daily headlines on stimulus and key personnel changes, not to mention the data flow. However, for traders all that really matters is price and our ability to react, manage risk and achieve correct position sizing. Despite a lot of gloom in the narrative, on the daily we see quite a constructive picture with pricing action looking like a solid base and a subsequent break of the double bottom neckline, which bodes well for 12k.
USDCHF – eyeing a test of the 200-day MA
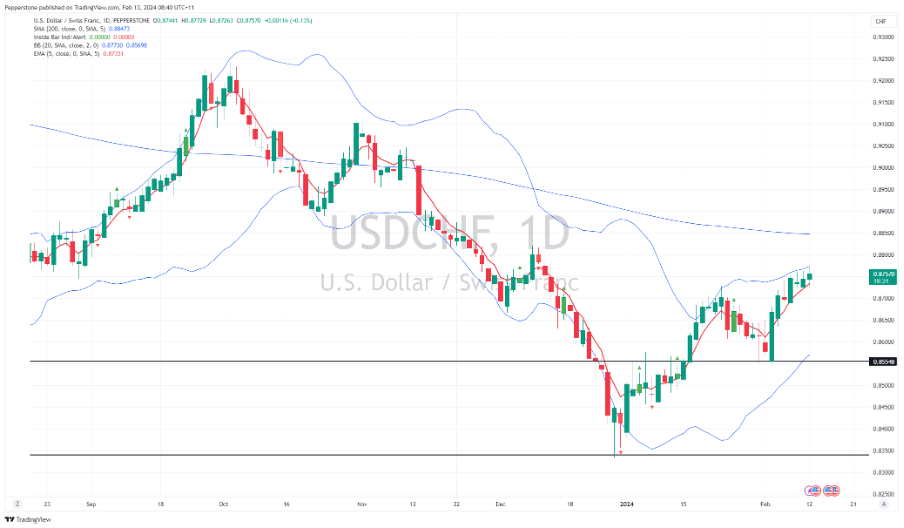
The CHF has found good shorting interest of late, with evidence that the Swiss National Bank (SNB) is intervening in the FX markets to counter CHF strength. There is a view that to get ahead of the ECB’s rate-cutting cycle the SNB could even see a surprise 25bp cut in the March SNB meeting. The CHF swaps market ascribes a 36% chance of such a cut. On the USD side, we get US CPI in the session ahead (00:30 AEDT) with the consensus eyeing headline CPI at 0.2% MoM / 2.9% YoY and core CPI at 0.3% MoM / 3.7% YoY. A core CPI month-on-month print above 0.35% would likely see the US 2yr Treasury yield break above 4.5% and promote a wave of short-term USD buying, and in turn, weigh on gold and growth equity. A print below 0.25% MoM could promote USD sellers and push US equity higher. The US CPI print is therefore a clear short-term risk to USD exposures, and USD positioning will naturally impact the extent of the move. I favour USDCHF higher though, with the 200-day MA at 0.8850 likely to come into play.

The material provided here has not been prepared in accordance with legal requirements designed to promote the independence of investment research and as such is considered to be a marketing communication. Whilst it is not subject to any prohibition on dealing ahead of the dissemination of investment research we will not seek to take any advantage before providing it to our clients.
Pepperstone doesn’t represent that the material provided here is accurate, current or complete, and therefore shouldn’t be relied upon as such. The information, whether from a third party or not, isn’t to be considered as a recommendation; or an offer to buy or sell; or the solicitation of an offer to buy or sell any security, financial product or instrument; or to participate in any particular trading strategy. It does not take into account readers’ financial situation or investment objectives. We advise any readers of this content to seek their own advice. Without the approval of Pepperstone, reproduction or redistribution of this information isn’t permitted.