- English (UK)
Gold’s price retreats after record highs - volatility spikes as traders eye Fed and CPI data


Summary
- Volatility spikes after record rally: Gold (XAU/USD) surged over 23% since September before collapsing from $4,381 to $4,003 in just 36 hours — a reminder of how fast sentiment can reverse when speculative positioning builds.
- Macro drivers still in play: Ongoing US government gridlock, Fed rate-cut expectations, and global debt and geopolitical risks continue to underpin gold’s appeal as a safe-haven asset, suggesting the broader uptrend could resume once markets stabilise.
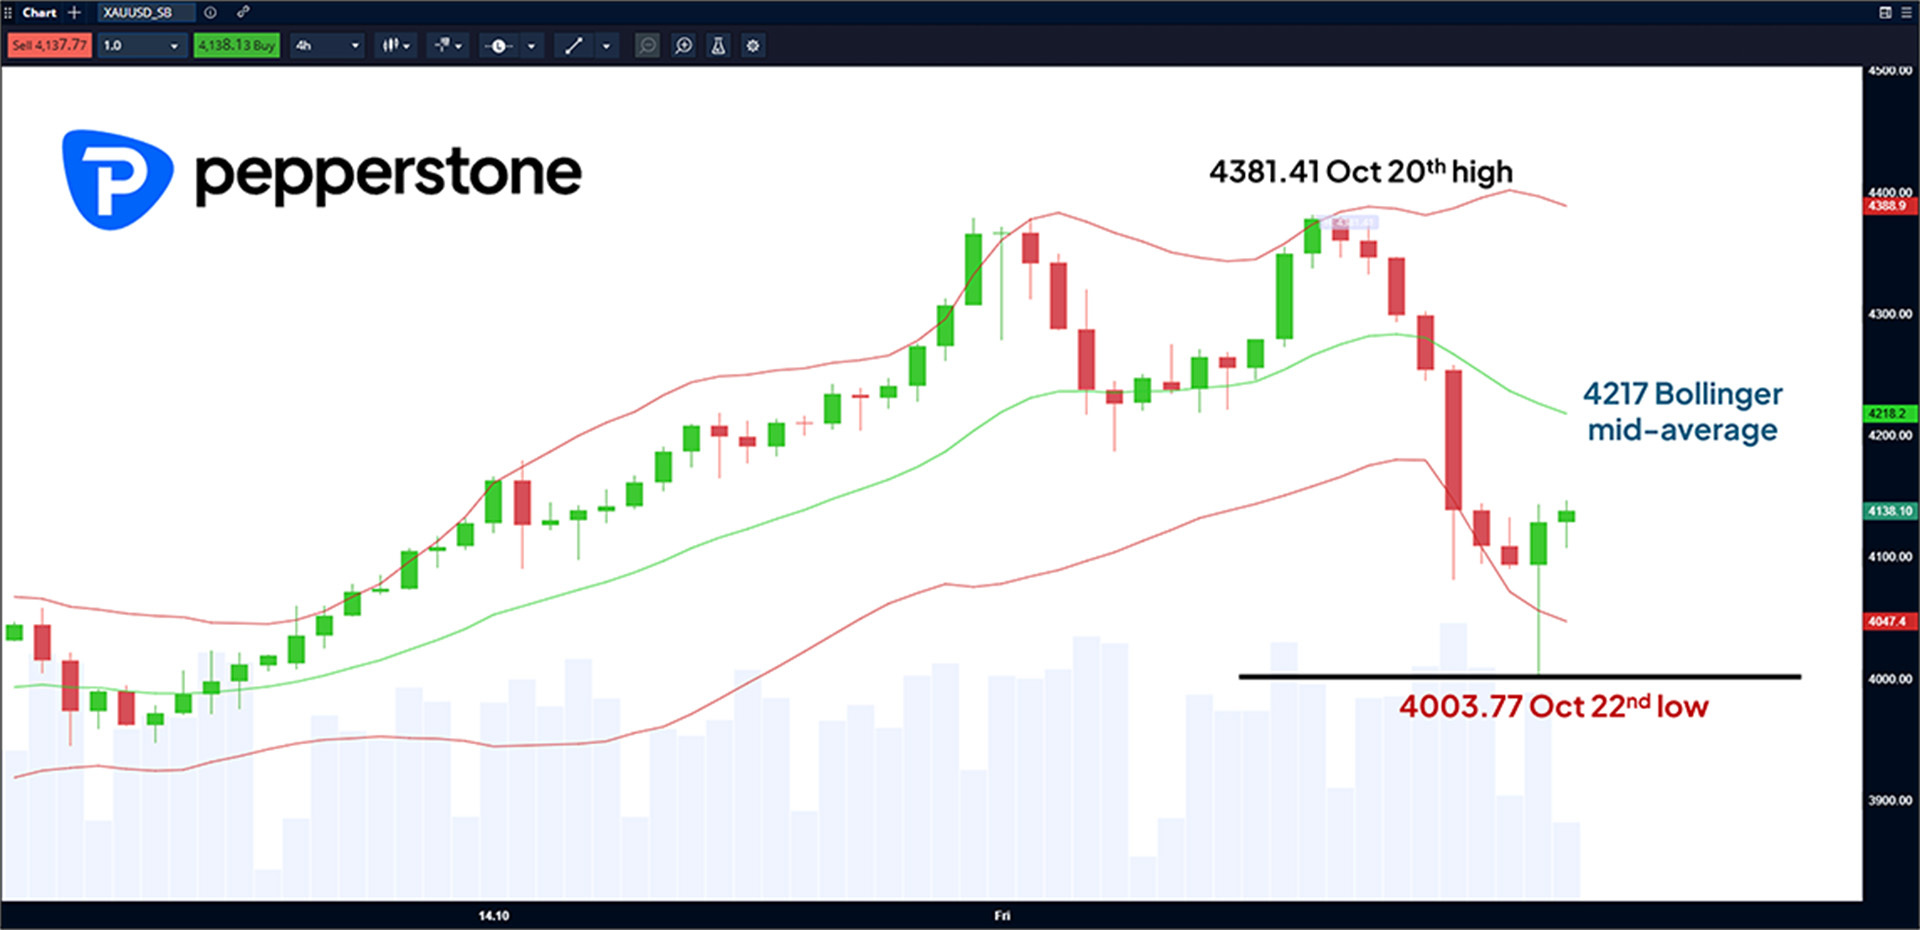
- Key levels and events to watch: Traders are watching support near $4,003 and resistance at $4,217, alongside upcoming catalysts such as the US CPI data and Fed meeting — both pivotal for short-term direction.
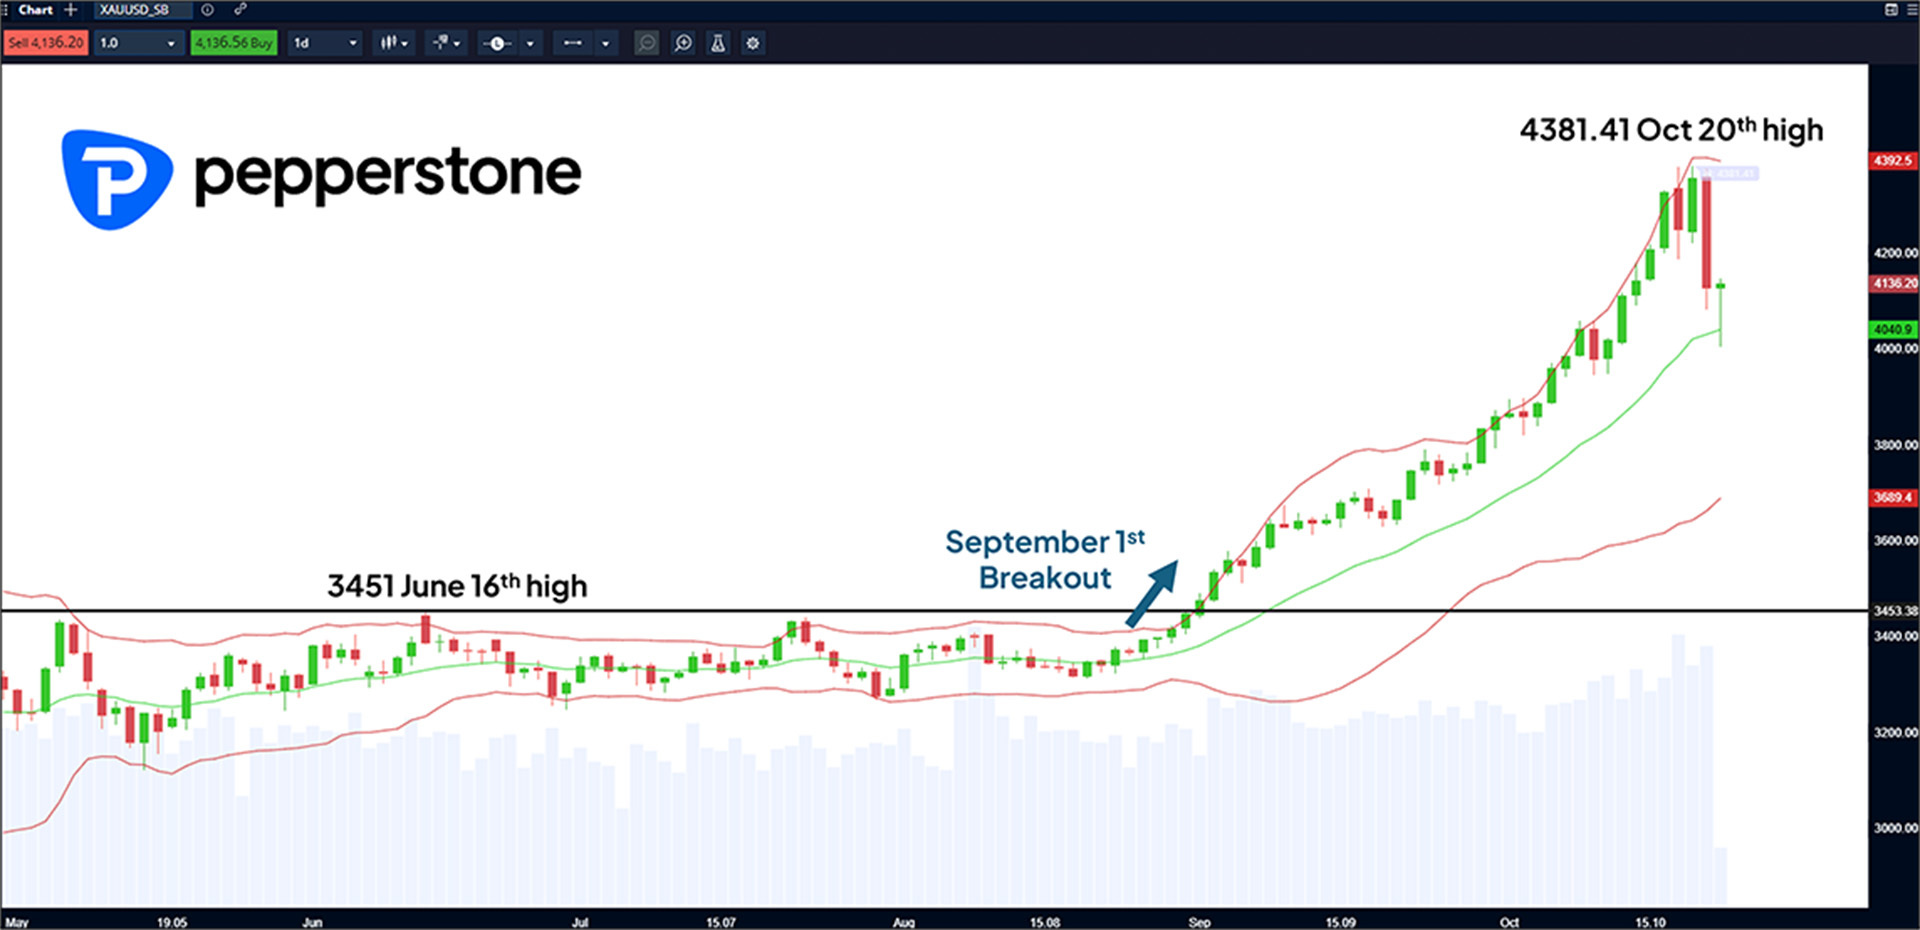
Safe-haven demand drives gold’s three-month surge
The main driver for this move has been as a safe haven hedge against a growing list of issues including an on-going US government shutdown which is about to become the second longest in history, US/China trade tensions, geo-political risks in Ukraine, the potential for the Federal Reserve (Fed) to cut interest rates again at their October 29th meeting, credit issues at regional US banks, and potentially unsustainable government debt burdens in Japan, US, UK and France. All valid concerns and ones which could remain important for the direction of Gold moving forward.
Why volatility spiked this week
So, you may say what’s changed this week? Well, excessive positioning and increasing volatility is a dangerous combination, especially on the back of such a one way move over a near 3-month period. It can be like kryptonite for superman. Last week Gold registered its biggest ever weekly price gain in dollar terms (+$235), this type of move can suggest the involvement of speculators who can increase volatility as they are quicker to get into and out of positions. All was good, while prices were rising to record highs but when price action turned down things changed quickly.
Key technical levels traders are watching
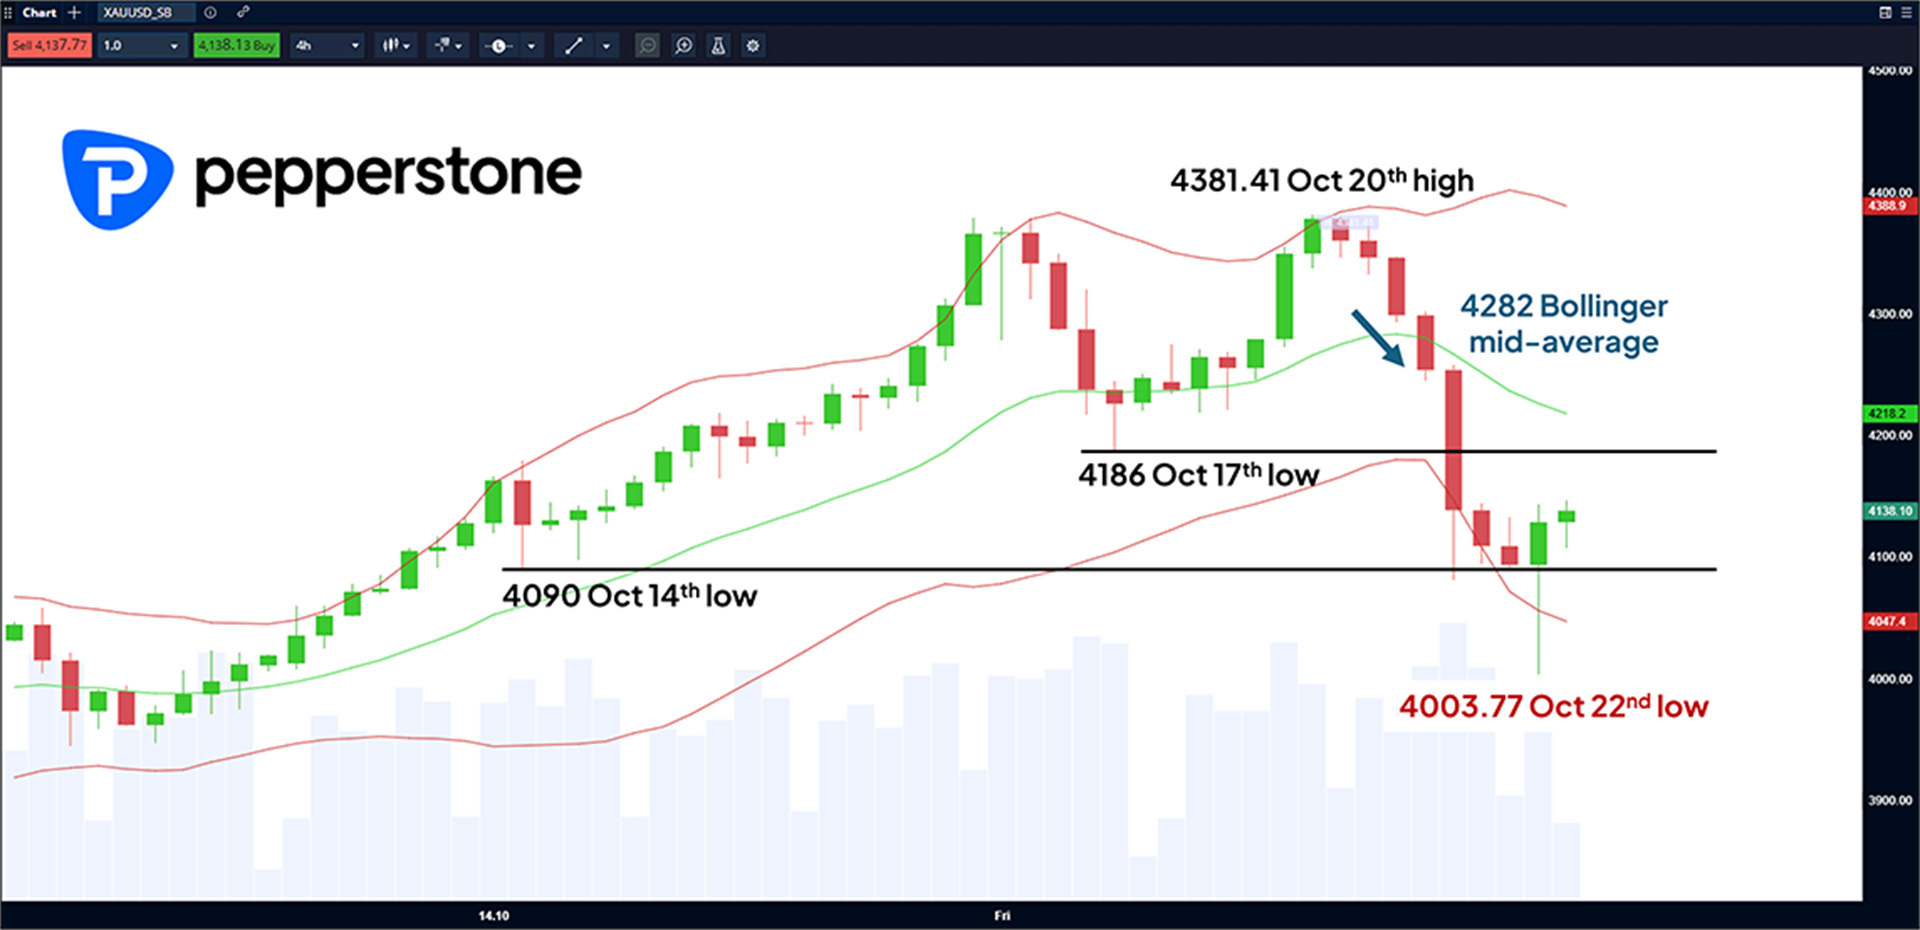
This can be seen on the shorter term 4-hour Gold chart below. When prices broke below the falling Bollinger mid-average at 4282, the upper and lower Bollinger bands widened to indicate increasing volatility. This led to a very long red candle on the chart which included a break below the October 17th low at 4186, stopping briefly at the October 14th low of 4090, but when that broke early this morning that was the final straw and prices took out the next wave of weak longs to an eventual low of 4003.77, before eventually rebounding aggressively back to current levels around 4135.
What could happen next for gold prices
Looking forward, positioning clear-outs like this one can be violent and painful but they could pave the way for the trend to resume, especially when the macro drivers outlined above remain in play. However, it is always important to stay vigilant as there is no guarantee that the downside correction is over.
It could be sensible to go back to basics. Plan for the potential of wider moves by identifying important levels, such as support at the October 22nd low of 4003, on the downside, or initial resistance at the declining Bollinger mid-average which currently stands at 4217 on the 4 hourly chart below.
Events to monitor: CPI, Fed decision and trade talks
Keeping apprised of key risk events, like Friday’s US CPI release (1330 BST), which could help clarify whether the Fed cut interest rates on October 29th may be important, as could be the outcome of trade discussions between the US and China which are currently taking place.
The material provided here has not been prepared in accordance with legal requirements designed to promote the independence of investment research and as such is considered to be a marketing communication. Whilst it is not subject to any prohibition on dealing ahead of the dissemination of investment research we will not seek to take any advantage before providing it to our clients.
Pepperstone doesn’t represent that the material provided here is accurate, current or complete, and therefore shouldn’t be relied upon as such. The information, whether from a third party or not, isn’t to be considered as a recommendation; or an offer to buy or sell; or the solicitation of an offer to buy or sell any security, financial product or instrument; or to participate in any particular trading strategy. It does not take into account readers’ financial situation or investment objectives. We advise any readers of this content to seek their own advice. Without the approval of Pepperstone, reproduction or redistribution of this information isn’t permitted.