

Summary
- Volatility Spike: Amazon surges 5% to new record high on Monday, Palantir Technologies Drops 7% after hours pulling the Nasdaq 100 down 1.2% as sentiment sags
- Catalysts: Amazon Cloud Unit announces $38 billion deal to supply OpenAI, Palantir Technologies Q3 earnings strong but fears increase about excessive valuations
- Sentiment Drivers: US ADP Private Sector Payrolls and ISM Services PMI, Qualcomm Earnings and Technical Trends
Why is Nasdaq 100 Volatility Increasing?
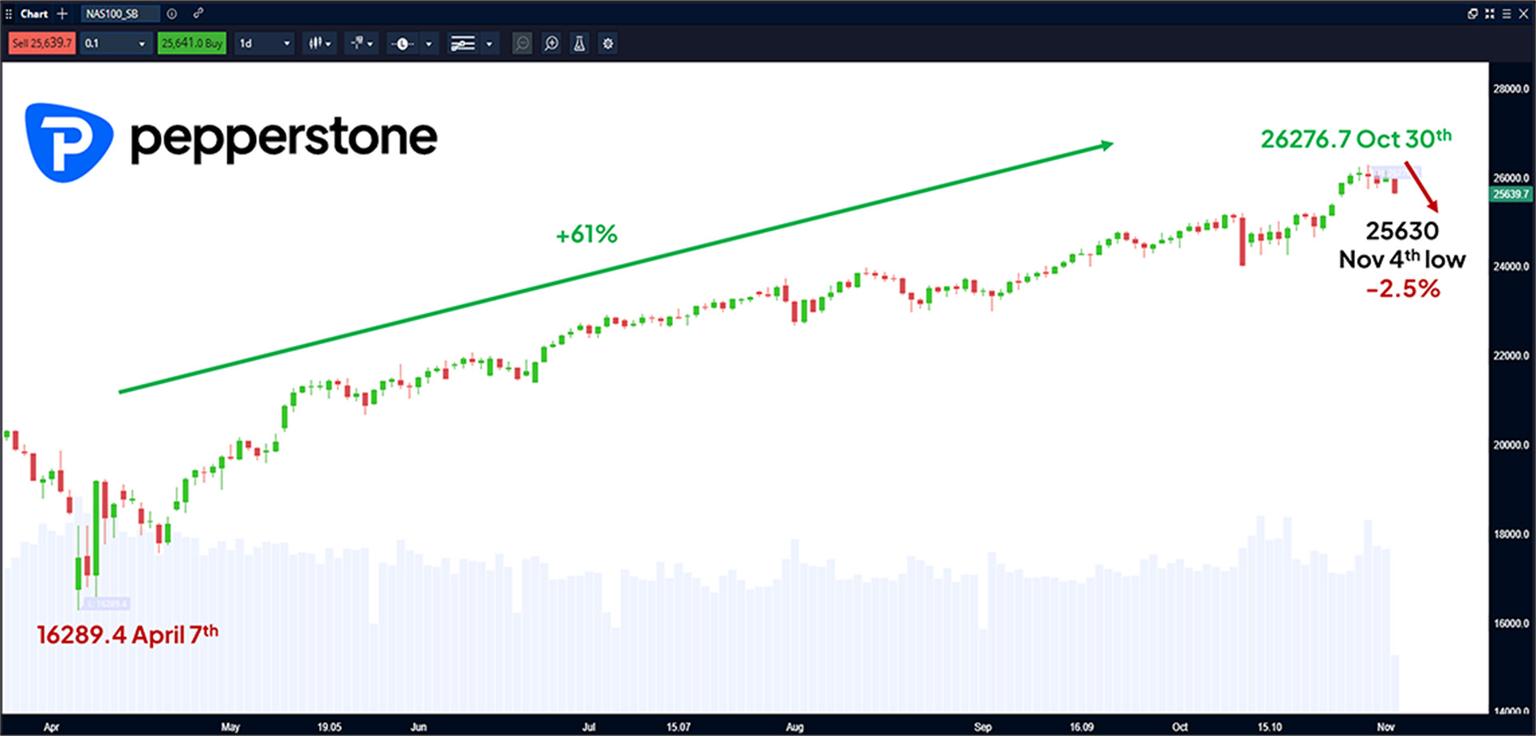
Traders are concerned about an AI bubble and high technology company valuations after a bull market run that has seen the Nasdaq 100 surge 61% from its April 7th lows at 16289 to a record high of 26276 on October 30th (see chart below). The situation has been further complicated by a more hawkish than anticipated interest rate outlook provided by the Federal Reserve last week, which threw into doubt the likelihood of a further 25bps interest rate cut at their next meeting in December. As a rule, lower interest rates support growth orientated stocks and vice versa.
Nasdaq 100 Daily Chart:
While traders continue to respond well to a strong Q3 earnings performance from key Magnificent 7 corporates and positive AI related news items, like Amazon’s cloud unit $38 billion deal with OpenAI which was announced yesterday (see chart below), they remain extremely sensitive to any earnings disappointment from AI focused corporates that have experienced impressive gains in 2025 such as Palantir Technologies who reported its Q3 earnings after the close last night.
Amazon 4 Hour Chart:
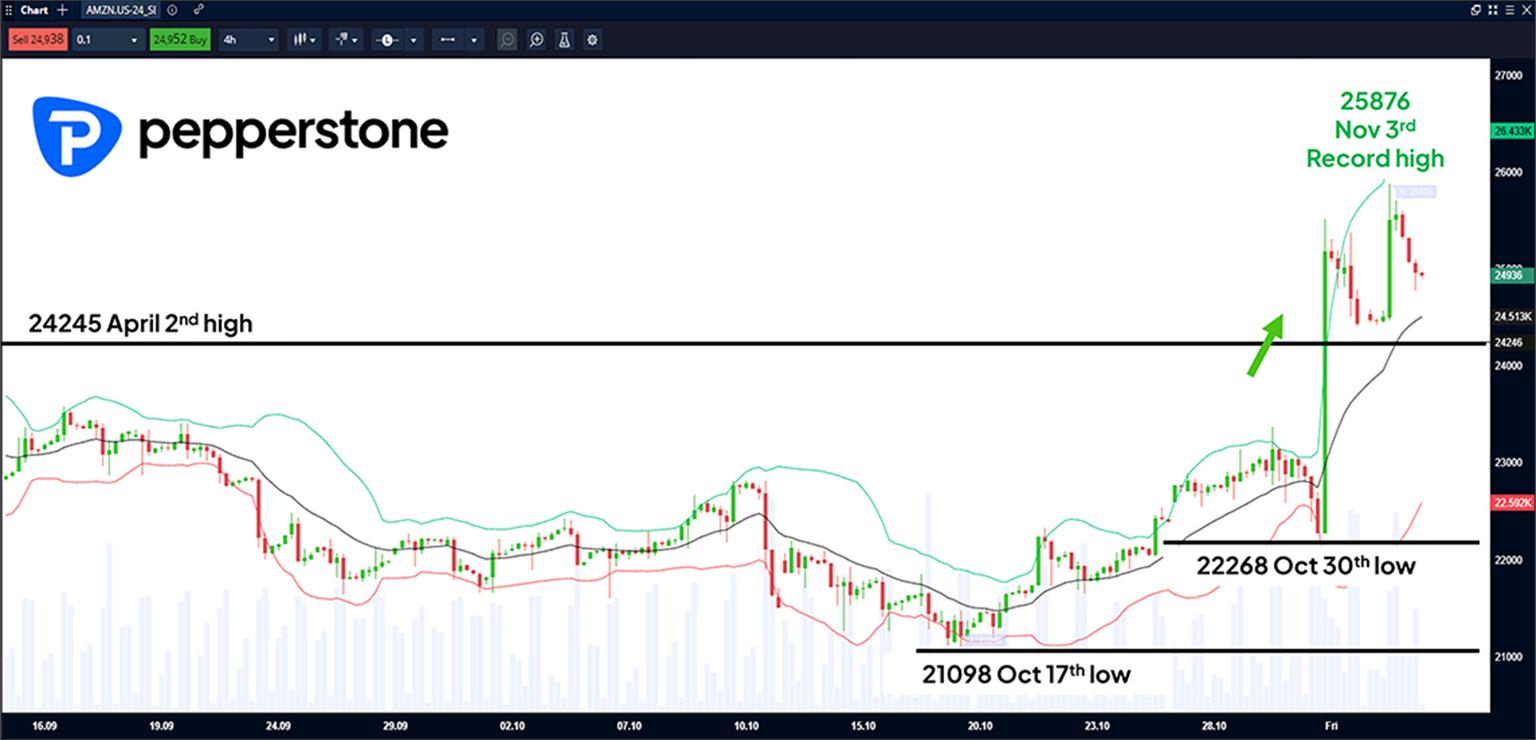
Support: 24516 (Bollinger mid-average), 22268 (October 30th low), 21098 (October 17th low)
Resistance: 25876 (November 3rd high), 27248 (138.2% Fibonacci Extension)
While Palantir’s Q3 results exceeded analysts' expectations the lack of forward guidance on earnings moving into 2026 saw traders turn cautious on the company’s stock price, which had gained an unbelievable 190% at its record peak posted before yesterday’s earnings release (see chart below).
Palantir Technologies Daily Chart:
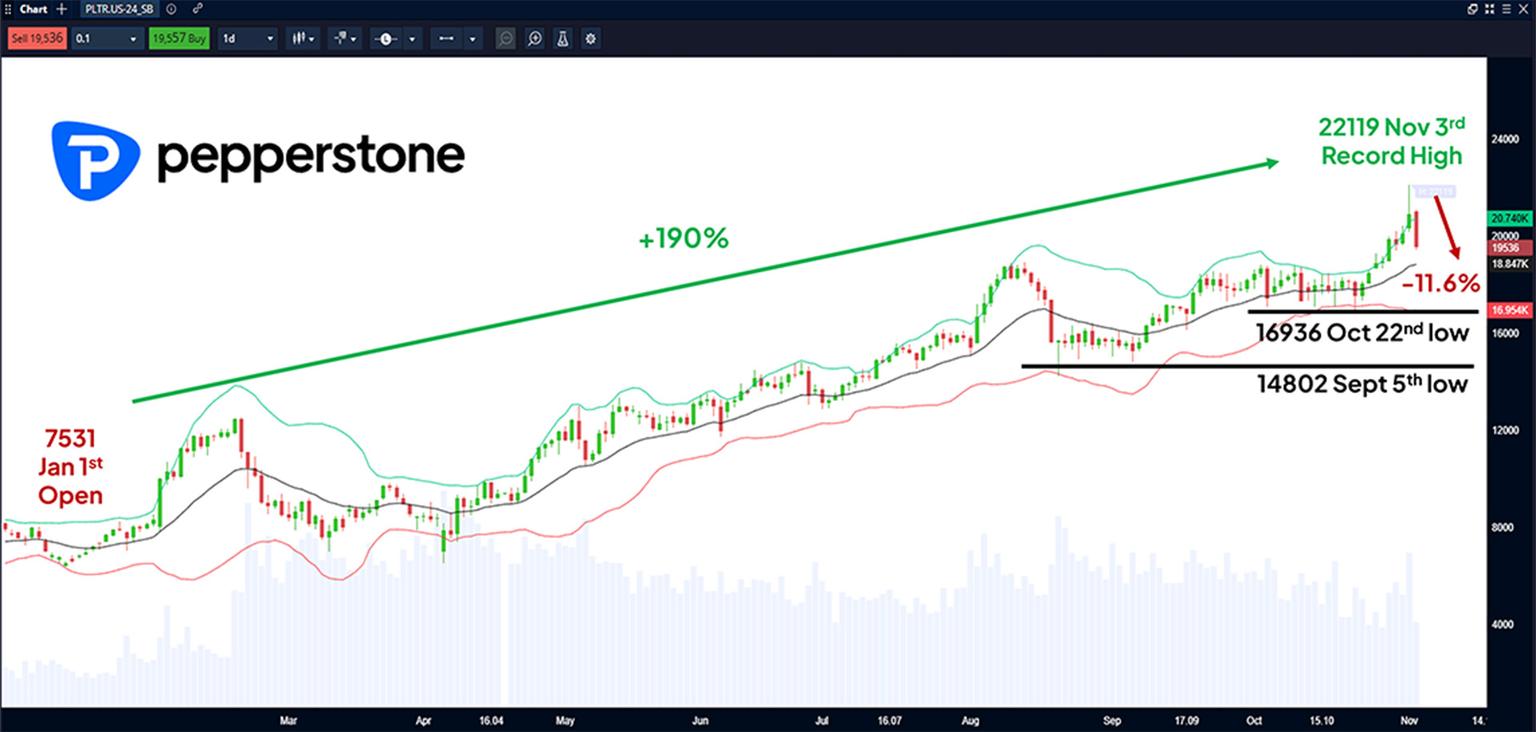
Support: 18846 (Bollinger mid-average), 16936 (Oct 22nd low), 14802 9September 5th low)
Resistance: 21073 (November 4th high), 22119 (November 3rd record high)
Looking forward, with the on-going US government shutdown delaying the release of key economic data updates, like Friday’s Non-farm Payrolls, the ADP Private Sector Payrolls report (1315 GMT) and the ISM Services PMI survey (1500 GMT) for October due on Wednesday could take on more significance. Also important for sentiment towards AI and technology stocks could be the earnings release from Qualcomm which is due after the close on Wednesday.
Nasdaq 100 Daily Chart:
What is the Forecast for the Nasdaq 100:
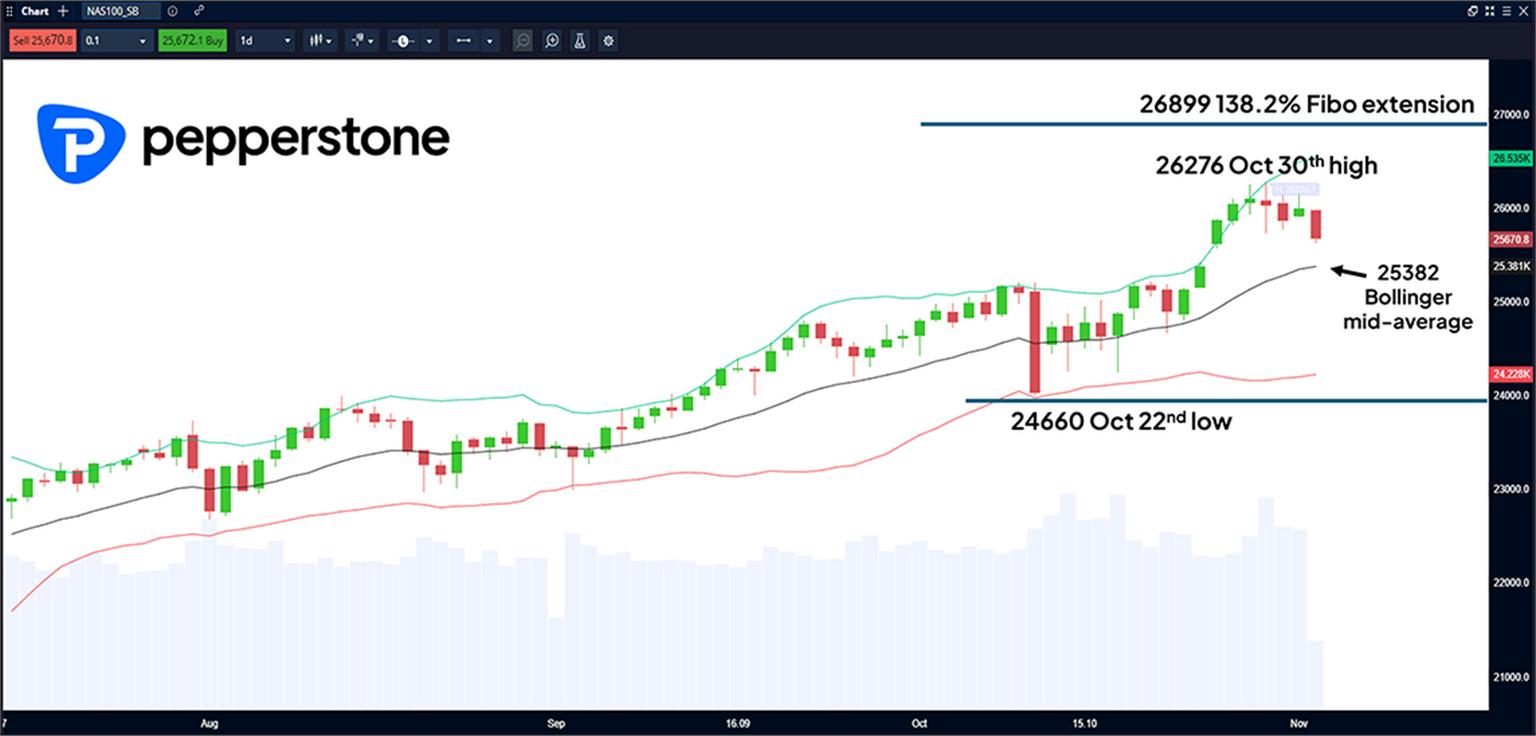
Overnight the Nasdaq 100 has experienced a sell-off which has seen it trade to a low of 25630 (0730 GMT), a level that coincides with its gap open low from October 27th at 25570. A break below 25570 on a closing basis could open potential to close the gap to 25428, even see it test 25382, which is the rising Bollinger mid-average. How this mid-average support performs on a closing basis could be important. A close below 25382 could expose the index to moves down towards 24660, which is the October 22nd low.
On the topside, the first resistance level to consider may be yesterday’s high at 26154, a break above there could lead to retests of 26276, the all-time peak set on October 30th. If that level was to break on a closing basis, then it could open potential for moves towards 26899 which is the 138.2% Fibonacci extension of the October 22nd to October 30th price strength.
Support: 25570 (October 27th low), 25428 (Bollinger mid-average), 24660 (October 22nd low)
Resistance: 26154 (November 3rd high), 26276 (October 30th record high), 26899 (138.2% Fibonacci Retracement)