- English
- Italiano
- Español
- Français
- English
- Italiano
- Español
- Français
Learn to trade
The volume traded in Bitcoin
There are a lot of investors and traders who ask the question ‘what is the price in Bitcoin the UK today’ Why? Because Bitcoin is the largest cryptocurrency by market cap, nearly doubling the market cap of Ethereum. It is also heavily traded.
According to coinmarketcap.com, volume traded in Bitcoin in the last 24hrs was $39,960,848,559 (as of 09/09/2022). That is a very big number and just over 10% of the whole market cap.
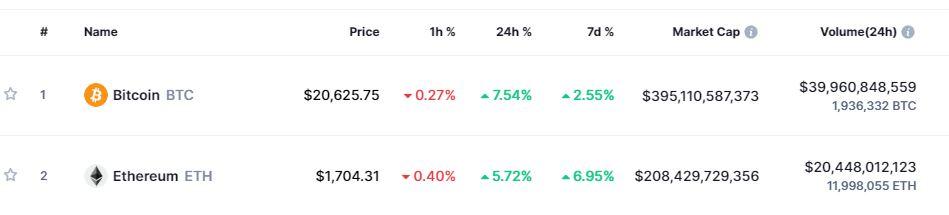
Figure 1 coinmarketcap.com Market Cap
Some interesting facts about Bitcoin
- The cryptocurrency was created by Satoshi Nakamoto. He is rumoured to own 1 million bitcoins making him worth nearly $40 billion
- Approximately 83 million people own a Blockchain wallet, making it possible to store Bitcoin.
- According to Chainalysis, about 20% of Bitcoin can’t be accessed. They have either been lost or stuck in investors wallets. As of today’s worth, that is around $79 billion (09/09/202).
- The first Bitcoin purchase was for a pizza
- There will only ever be 21 million Bitcoin in circulation
Technical analysis outlook for BTCUSD
This could be an interesting time for the price in Bitcoin both from a technical and fundamental view. The much-anticipated Ethereum Merge is just around the corner, and it is set to send ripples through the cryptocurrency world.
Secondly, we have started to see a turnover in the price of the US Dollar. With Bitcoin mainly traded against the USD, we are starting to see a move to the upside.
Let us first look at the US Dollar Basket (DXY)
DXY Monthly Chart
The DXY has formed a Bearish Ending Wedge pattern on the monthly chart with levels above the trend line resistance finding sellers this week. It should also be noted that the price rejection is close to the 78.6% pullback level of 110.17 (from 121.02-70.70), a common Fibonacci level.
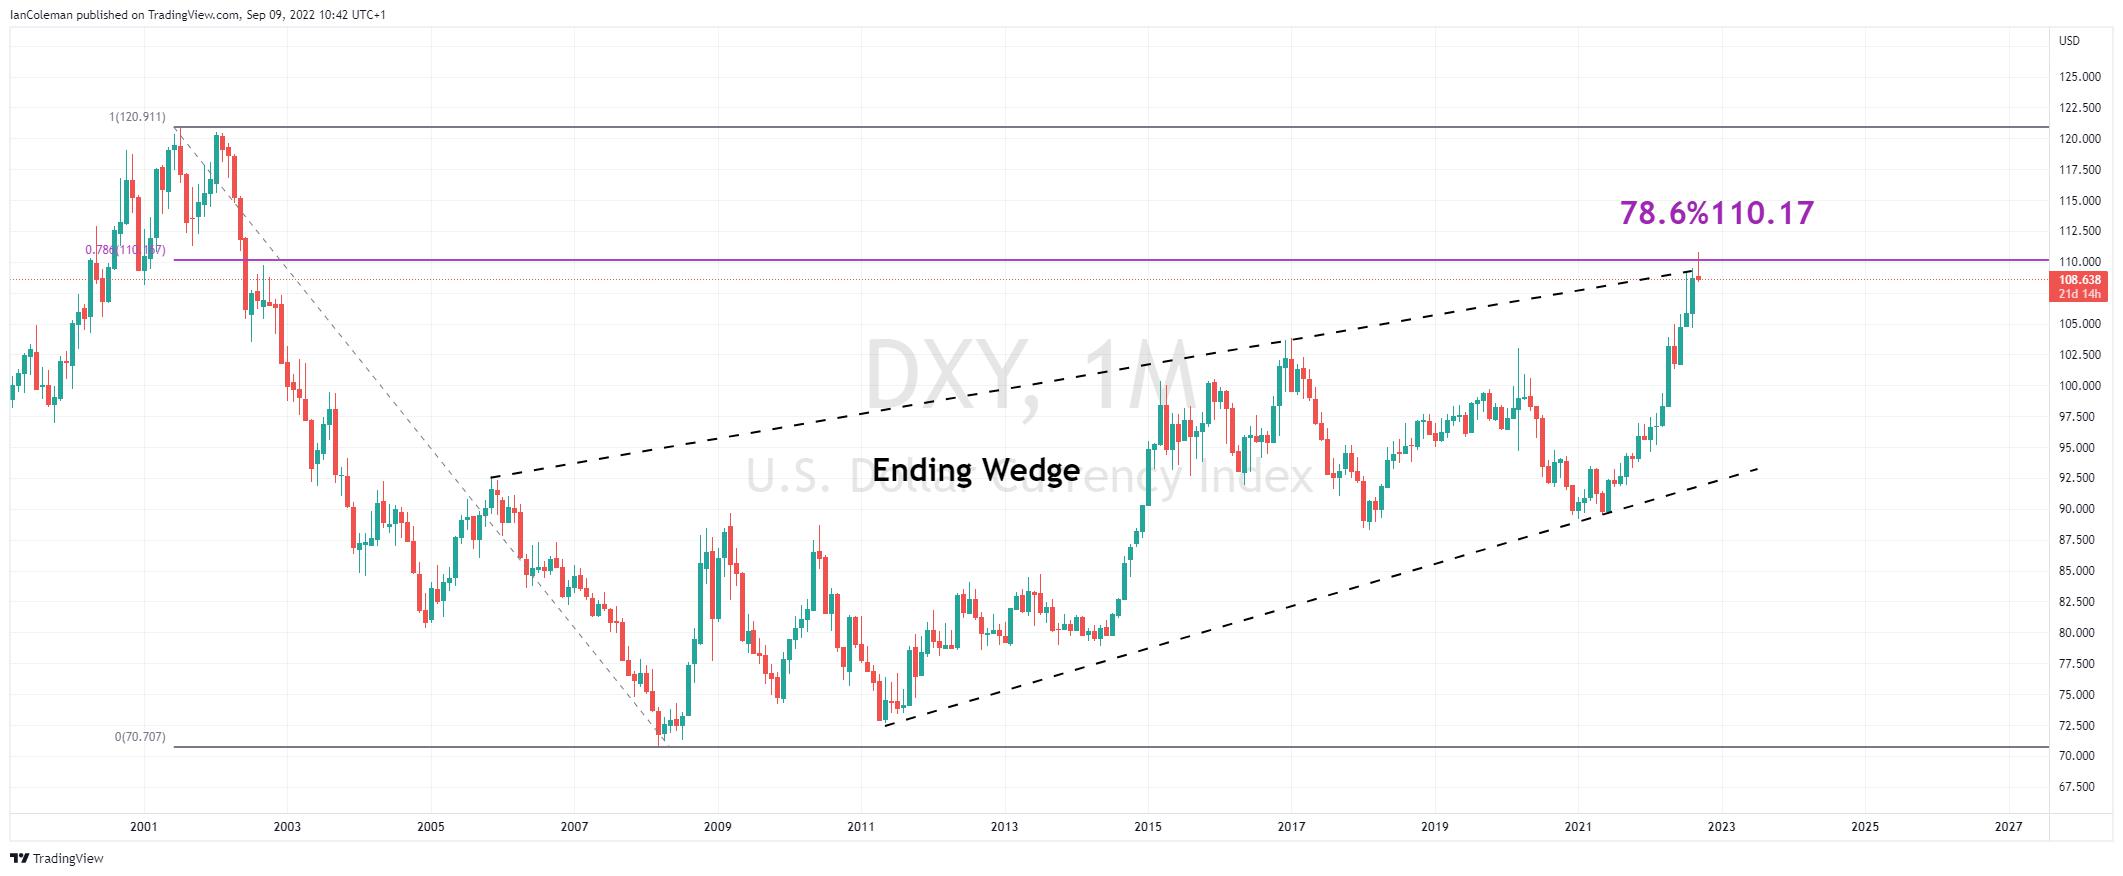
Figure 2 TradingView DXY Ending Wedge 78.6%
DXY Weekly Chart
A look to the weekly chart and a close below 108.28 would form a Bearish Outside Candle, often seen at the reversal of a trend.
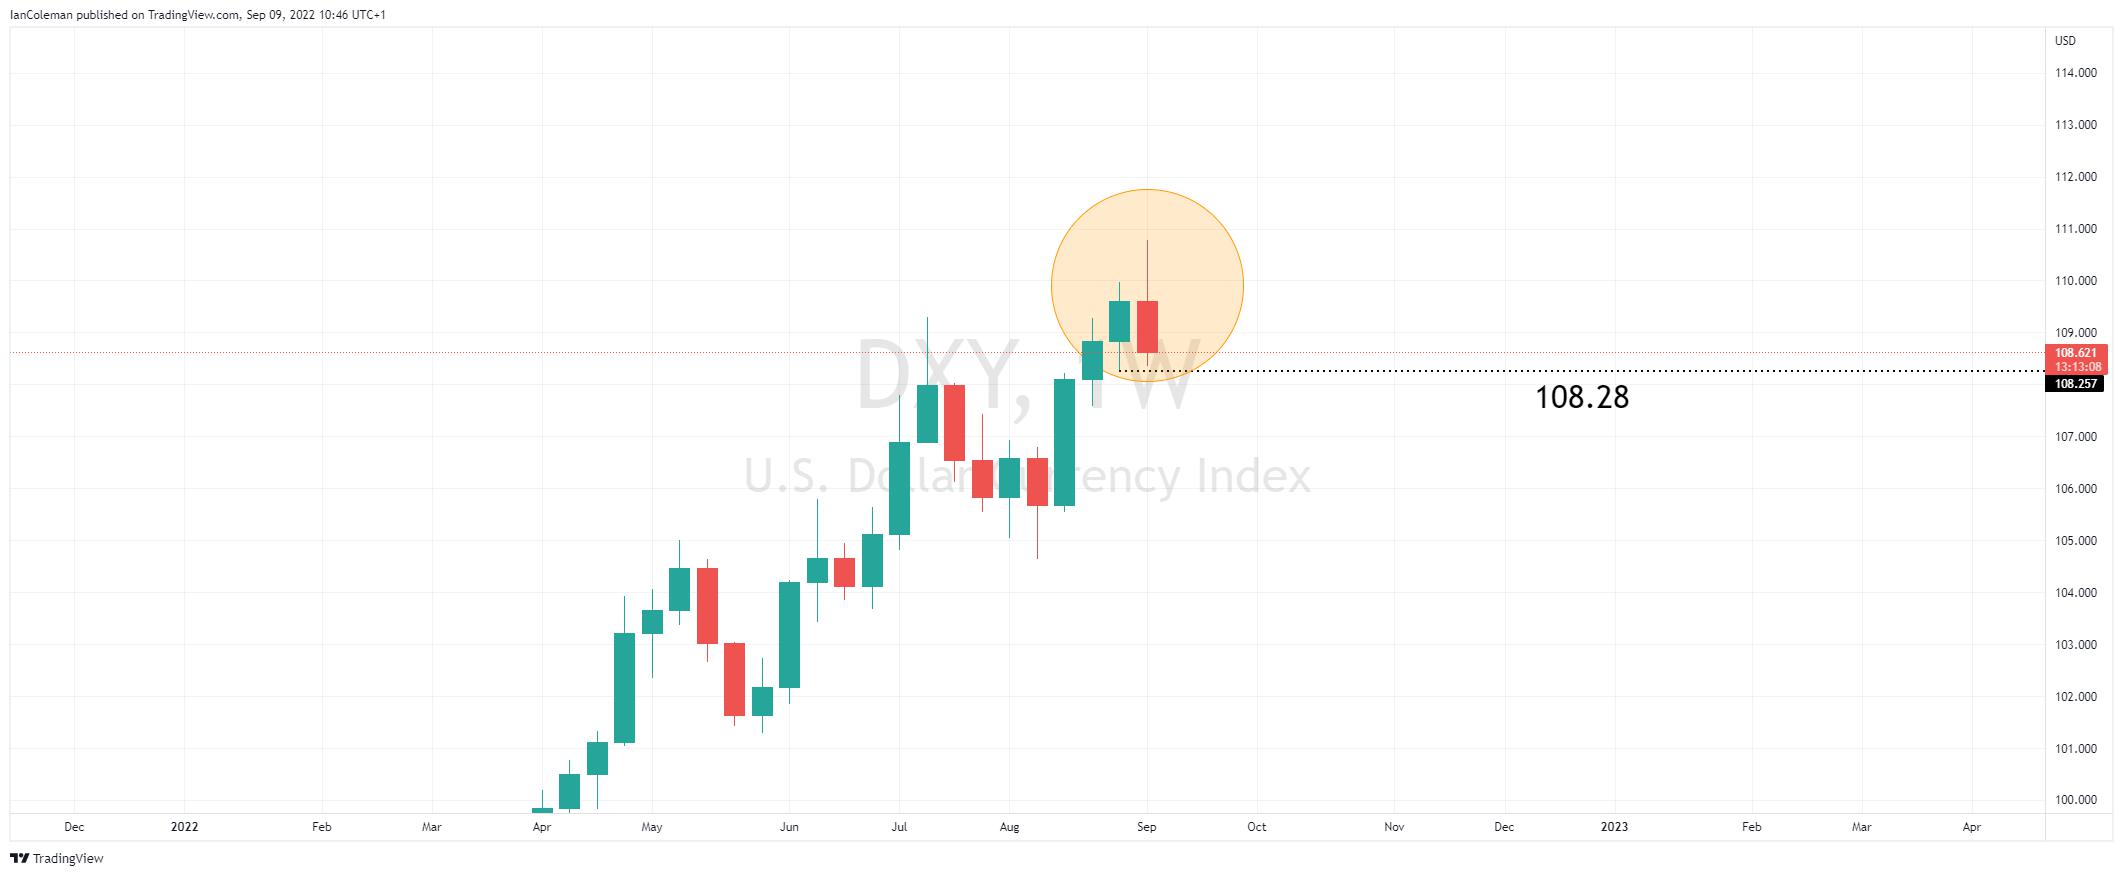
Figure 3 TradingView Outside Bar?
BTCUSD Monthly Chart
Buyers emerged just in front of the 78.6% pullback level of 17294 in June. We have seen two indecisive inside months in July and August.
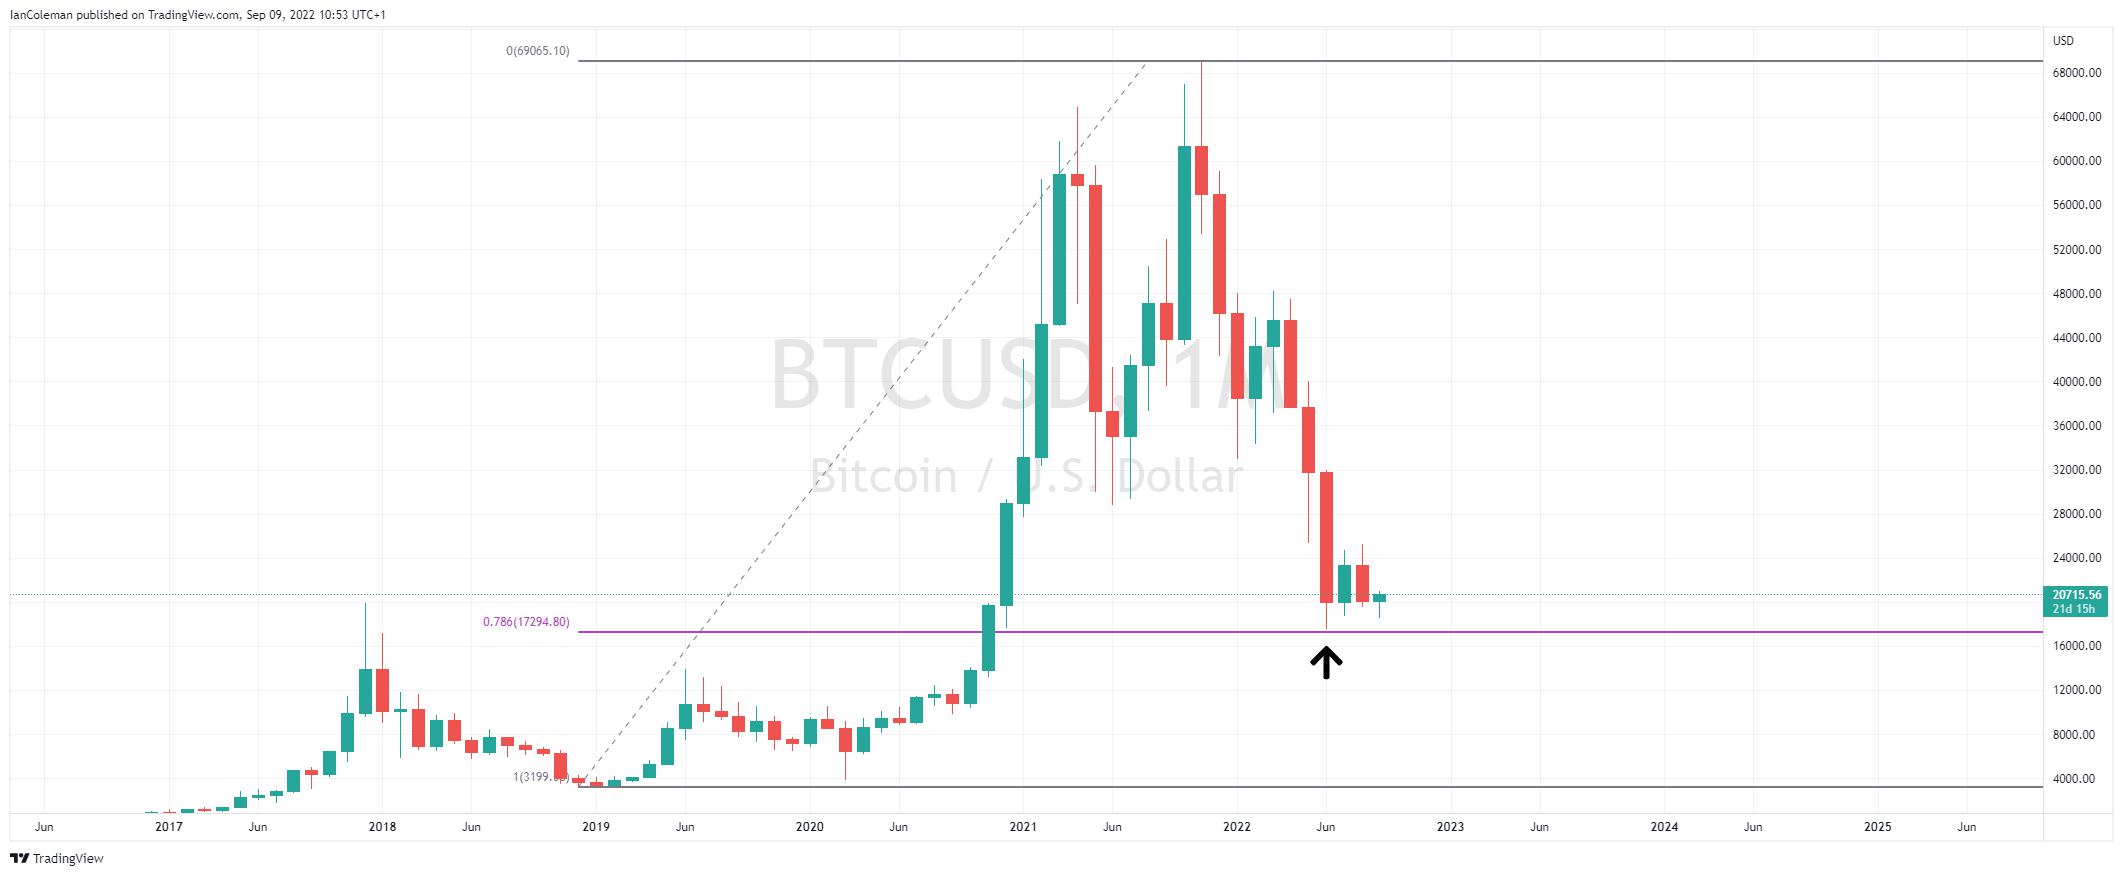
Figure 4 TradingView BTCUSD 78.6%
BTCUSD Weekly Chart
Likely to post a bullish Outside candle, often seen at the base of a trend and the start of a new upside bias.
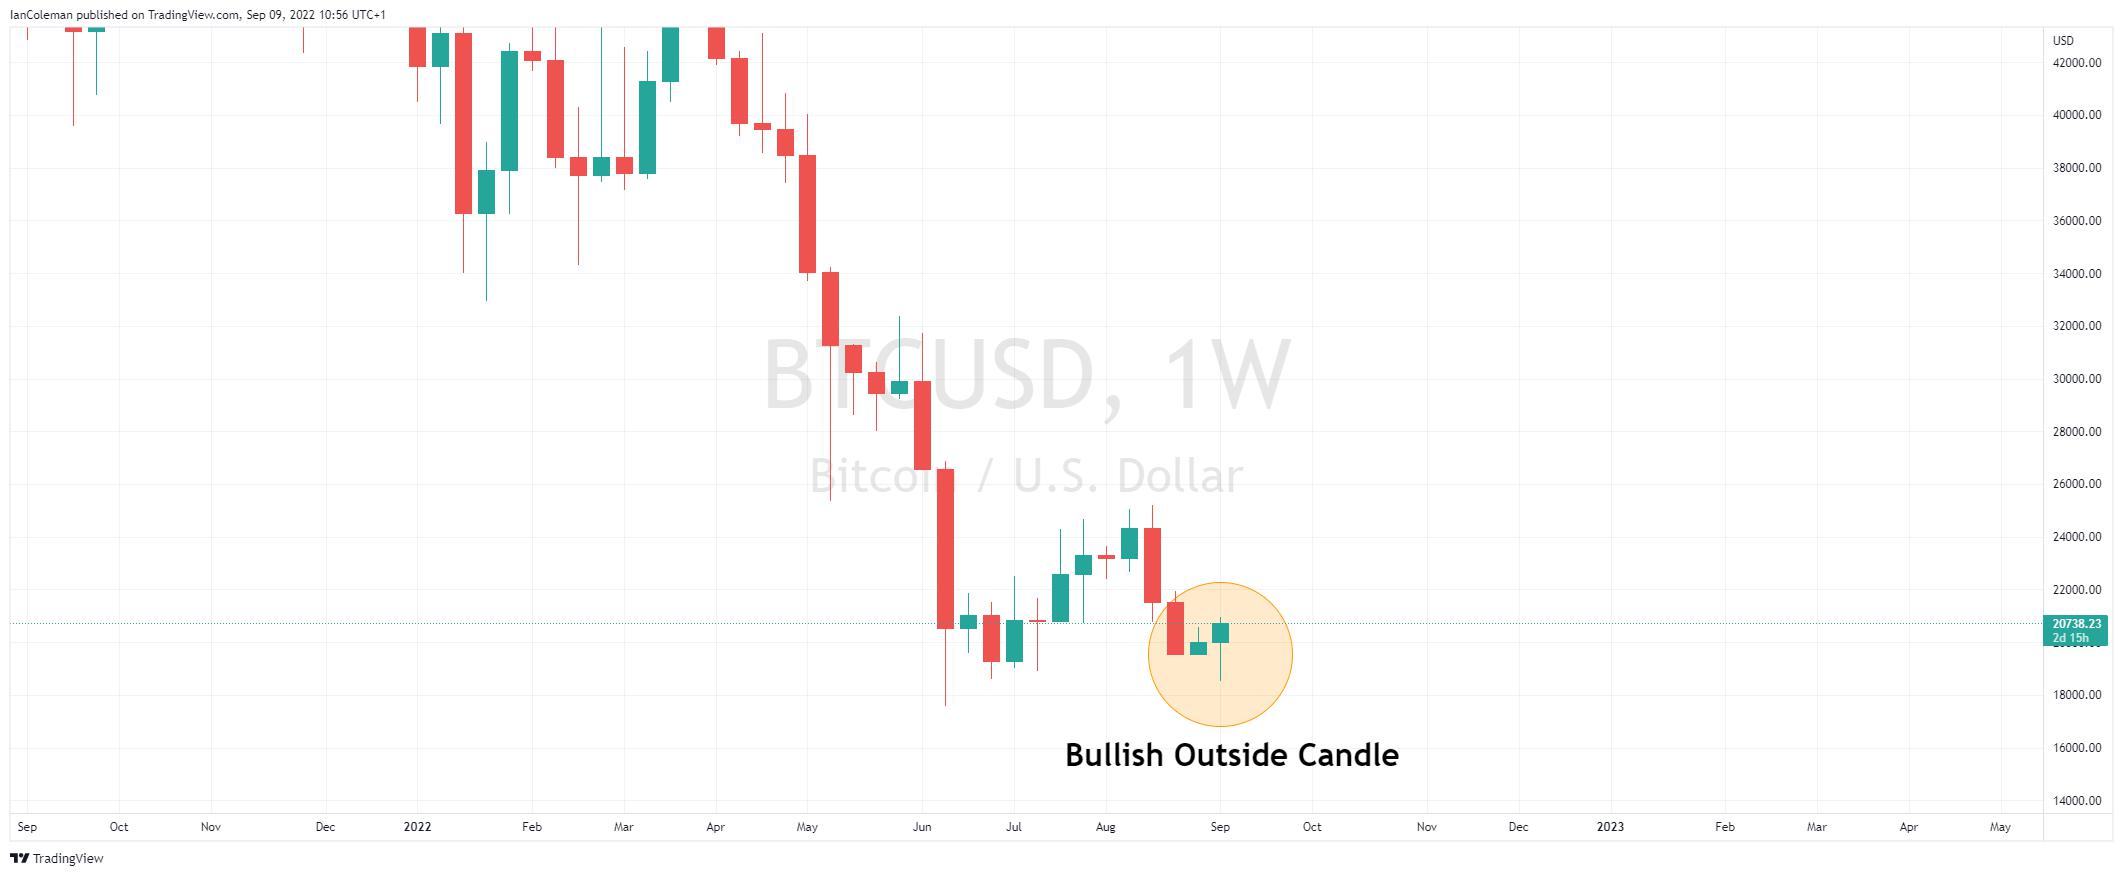
Figure 5 TradingView BTCUSD Bullish Outside Candle
The material provided here has not been prepared in accordance with legal requirements designed to promote the independence of investment research and as such is considered to be a marketing communication. Whilst it is not subject to any prohibition on dealing ahead of the dissemination of investment research we will not seek to take any advantage before providing it to our clients.
Pepperstone doesn’t represent that the material provided here is accurate, current or complete, and therefore shouldn’t be relied upon as such. The information, whether from a third party or not, isn’t to be considered as a recommendation; or an offer to buy or sell; or the solicitation of an offer to buy or sell any security, financial product or instrument; or to participate in any particular trading strategy. It does not take into account readers’ financial situation or investment objectives. We advise any readers of this content to seek their own advice. Without the approval of Pepperstone, reproduction or redistribution of this information isn’t permitted.