The implied volatility matrix: how movement dictates trading

We tend to see tighter spreads as vols fall and as liquidity dynamics change in fast-moving markets. Vols also have big implications for corporate hedging and the lower the vol the less that takes place.
(Blue – Deutsche G7 realised volatility index, Orange – DB G7 implied vol index)
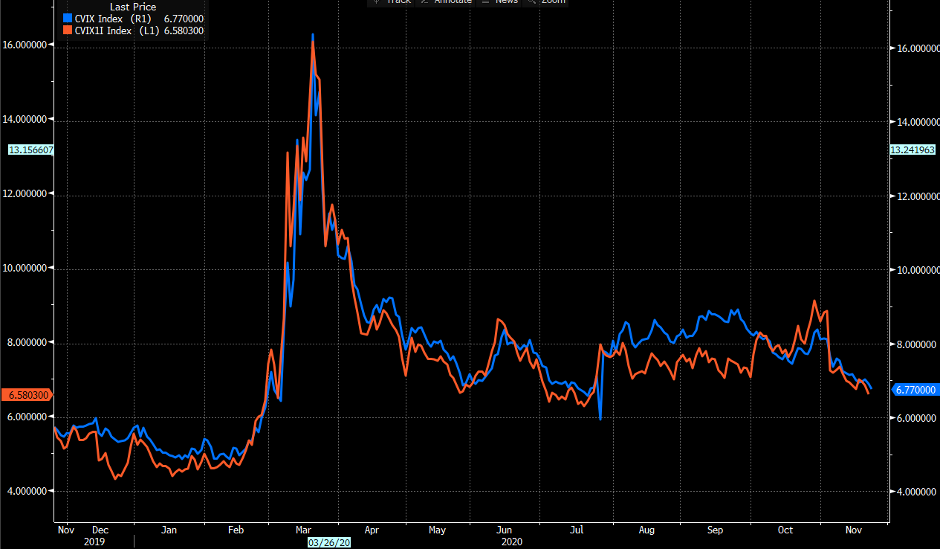
(Source: Bloomberg)
In years gone by this low vol regime when married with tight credit spreads and positively trending equity markets, led to funds seeking income or ‘carry’ and looking at interest rate differentials. While you can still get carry in Emerging Markets (EM) the risk you take to get it can be problematic. Do I want to short GBPTRY and get paid 204 points in swaps, if the 12-month average daily range is 1.5%? Clearly, the capital move is the primary consideration but if I hold conviction that GBPTRY is a good short as a tactical, technical or fundamental trade, then getting paid when the trade is moving lower is certainly a very attractive sweetener.
G7 central banks have made policy as such that the side effect is reduced vol, but they have spent a great deal of capacity trying to limit carry. The Fed are certainly one bank that springs to mind and it wasn’t that long ago where I could hold USDs and get paid to do so. However, it was also a safe haven, the world’s biggest oil exporter and the global reserve currency – being long USDs was a no brainer. The Fed made sure those days are over.
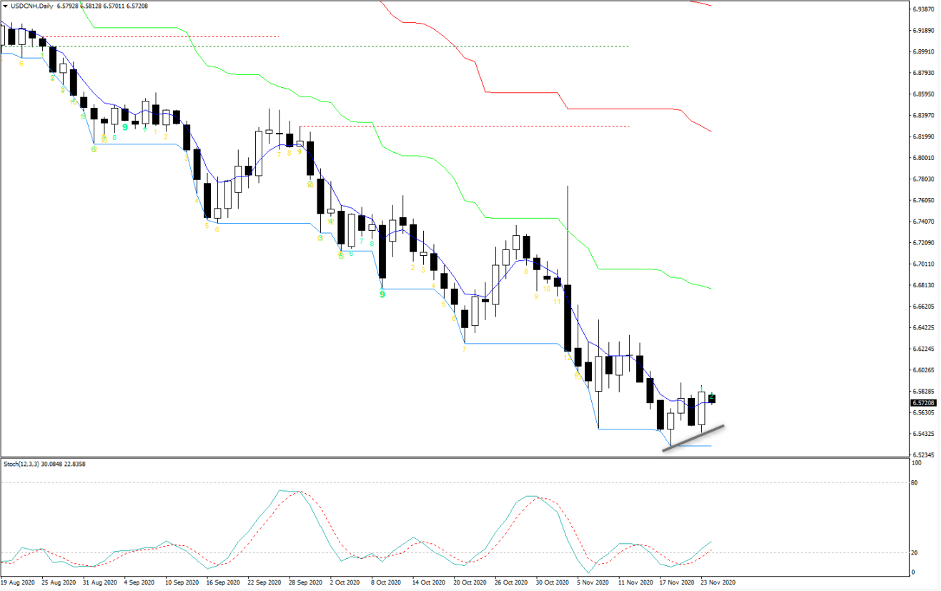
Vols are no longer as synonymous with carry and we’re fighting for scraps in G10 FX. EM FX has been working well but that's more a macro play on 2021, with the world expected to heal and EM asset due to outperform. That said, the EM FX index is rolling over and that may be something to watch, with the yuan a key component of that. If USDCNH is putting in a ST low then it'll have big implications for markets.
USDCNH daily
The vaccine news is great for all of humanity and that will reduce vol and allow traders to look past this period of COVID-19 inspired restrictions in the US and Europe, while continuing to bid up the value plays and the reflation thematic for 2021. To be fair, if I look at US real-time data it's holding up remarkably well and until this starts to roll over then the idea that we’re under-pricing the economic impact of restrictions is not going to hold and traders won’t put on bearish bets just until they see evidence of economic fragility. See the NY Fed’s own weekly economic index as one example.
Janet Yellen’s appointment of UST Secretary will only help lower vols too. This is as market friendly as we’ll get. Yellen was a huge dove in her time as Fed chair and she would generally get a risk positive outcome when she spoke and knows the US monetary system better than anyone. The idea that we may get a more together UST and Fed is a big positive for risk in general.
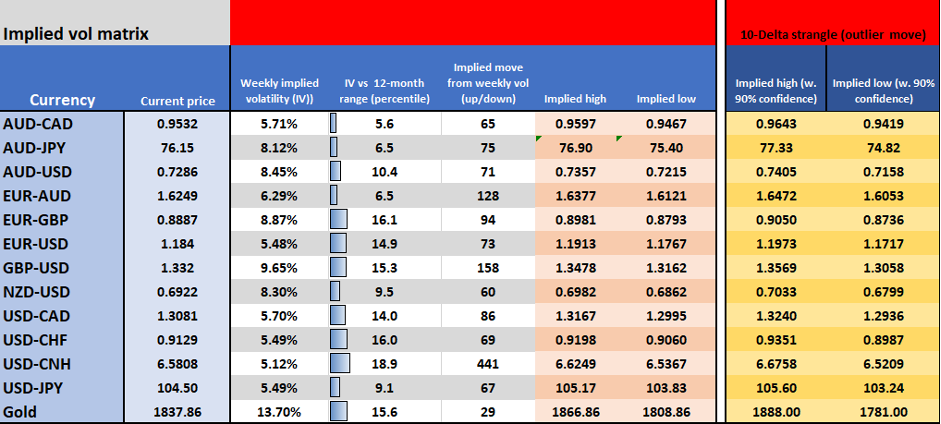
So, what’s the wash-up and where do we stand? Here's my volatility matrix which takes a 1-week implied volatility (IV) feed from Bloomberg, which in itself aggregates a number of sources of IV from various investment banks, who would act as market makers. Recall, IV is forward-looking and different from realised vol which is statistical fact. We can all look at realised vol either by looking at Bollinger bands, or pulling price data out of MT4/5 (use the Excel RTD Smart Trader Tool) and doing some quick calculations to find out the annualised rate.
Implied vol is set by options pricing and the greater the demand the higher the price, which is what drives higher IV. If traders see increased scope for price to have such a move that it increases the probability to settle above an options strike by expiry, then it's naturally worth more. The higher the IV the greater the implied move (higher or lower) and we can use this intel to understand the implied range.
This can be very powerful intel for traders of any asset class.
Not only does it give us insight into expected movement which offers realism towards our risk to reward trade-off. But, if vol is super low like they are now then it means I can run a tighter stop and increase my position size. Stops and risk should be volatility adjusted. Timeframe is a core consideration. For example, a 71-pip implied move over a week in AUDUSD is less helpful for a scalper than a swing or position/tactical trader.
I like to use this for the following reasons.
- To get a sense of expected movement
- To better help with stop placement and achieve a volatility-adjusted position size
- To look for perceived extreme moves which can be useful for mean reversion, although my preference is to daily options for mean reversion which I combine with pivot points and price action.
I've priced this from the weekly straddle and 10-delta strangle. This looks at the implied price move with a 68.2% and 90% degree of confidence. 90% level of confidence is considered an outlier move and therefore great for mean reversion. One of the best things about options is that they're based on math and can allow us quantifiable insights with a degree of confidence.
Related articles


The material provided here has not been prepared in accordance with legal requirements designed to promote the independence of investment research and as such is considered to be a marketing communication. Whilst it is not subject to any prohibition on dealing ahead of the dissemination of investment research we will not seek to take any advantage before providing it to our clients.
Pepperstone doesn’t represent that the material provided here is accurate, current or complete, and therefore shouldn’t be relied upon as such. The information, whether from a third party or not, isn’t to be considered as a recommendation; or an offer to buy or sell; or the solicitation of an offer to buy or sell any security, financial product or instrument; or to participate in any particular trading strategy. It does not take into account readers’ financial situation or investment objectives. We advise any readers of this content to seek their own advice. Without the approval of Pepperstone, reproduction or redistribution of this information isn’t permitted.