- English
- Italiano
- Español
- Français
We do also navigate through Super Tuesday, where a third of delegates will be up for grabs from the various Democrat nominee runners. I don’t touch on this in the video, as we will be putting a greater focus on this in a separate video on the US election and the process going forward here.
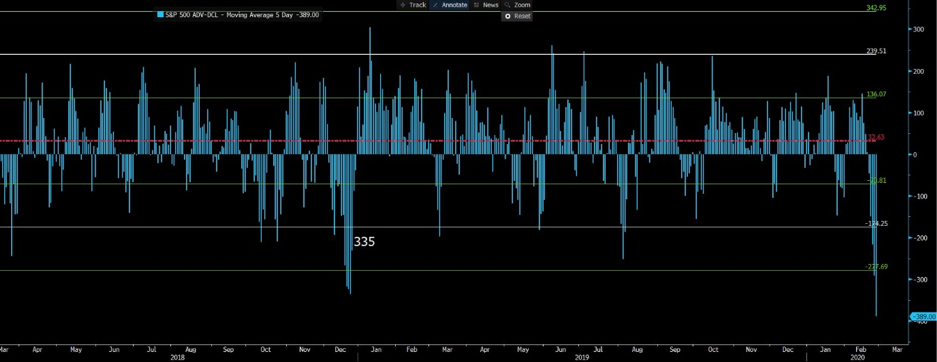
I focus in greater depth on implied volatility, as it has become incredibly high here, with some punchy moves implied through options prices. So, whether I am looking at vols, or my internal equity euphoria/pessimism equity model, we are now at extremes. Is it time to buy risk for slight mean reversion in price? It’s certainly looking compelling, albeit incredibly brave.
NYSE advances and declines

Source: Bloomberg
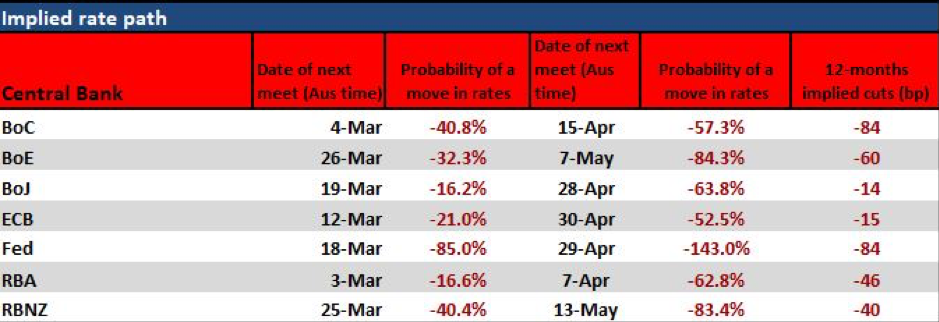
I touch on rates pricing and as we can see from the chart below, expectations have become incredibly rich and there will be some huge opportunity when we get a disconnect between central bank views and a market with a high conviction that lower rates are coming. Consider we saw an interview in the FT with Christine Lagarde and she basically spelt out that a rate cut is not imminent.

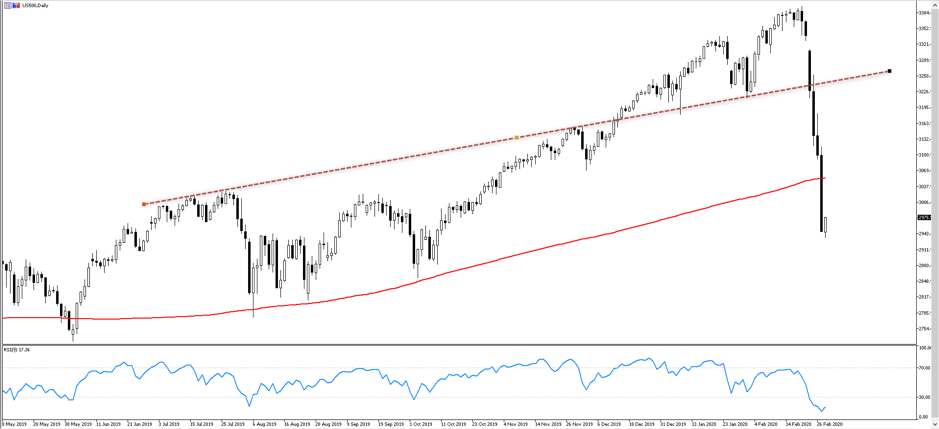
The chart that has garnered so much attention today is that of the S&P 500, with price smashing through trend support and the 200-day MA. Strange things happen below the 200-day MA, but how long it can stay below here is now key. But we’re insanely oversold and unloved levels, but timing the move is the clear issue, and on current news flow the question is how high reversion goes before you take profit and flip to shorts again.
S&P 500 daily chart

One to watch, but with vols sky high and equity and credit getting taken to the woodshed, carry structures in FX have been chopped up and it has hurt those who haven’t reacted. A big week ahead though, with some key event risks to navigate your portfolios through, the week ahead video above is designed to offer some light here.
Ready to trade?
It's quick and easy to get started. Apply in minutes with our simple application process.
The material provided here has not been prepared in accordance with legal requirements designed to promote the independence of investment research and as such is considered to be a marketing communication. Whilst it is not subject to any prohibition on dealing ahead of the dissemination of investment research we will not seek to take any advantage before providing it to our clients.
Pepperstone doesn’t represent that the material provided here is accurate, current or complete, and therefore shouldn’t be relied upon as such. The information, whether from a third party or not, isn’t to be considered as a recommendation; or an offer to buy or sell; or the solicitation of an offer to buy or sell any security, financial product or instrument; or to participate in any particular trading strategy. It does not take into account readers’ financial situation or investment objectives. We advise any readers of this content to seek their own advice. Without the approval of Pepperstone, reproduction or redistribution of this information isn’t permitted.
