- English
- 中文版
Learn to trade
What is stochastics and how can I use it in my forex trading strategy
Stochastics is a technical indicator, often referred to as an oscillator. It is placed on the chart and offers theoretical buying and selling opportunities based on the momentum of the underlying asset. It is often used in conjunction with other indicators such as the Relative Strength Index (R.S.I.). Using stochastics in your Forex trading strategy can offer a productive layer of confirmation.
The basic settings of stochastics
The stochastic indicator is produced from a complex formula. In basic terms, it works using the closing price of the product in relation to the high-low range of the price over a set number of past periods. The typical setting is a 14 period.
It produces two lines. The %K line is often referred to as the fast stochastic. The %D line is often referred to as the slow stochastic and is a 3-period moving average of %K.
Like the Relative Strength Index (R.S.I), it works around a range of 0 to 100. The asset is considered overbought above the 80 level and oversold below 20 but that’s only one way of looking at it and serves as another layer of confirmation.
Producing Buy and Sell Signals
The stochastic indicator produces a potential sell signal when the oscillator has moved into overbought territory (above 80) and the slow %D line moves below the faster %K line.
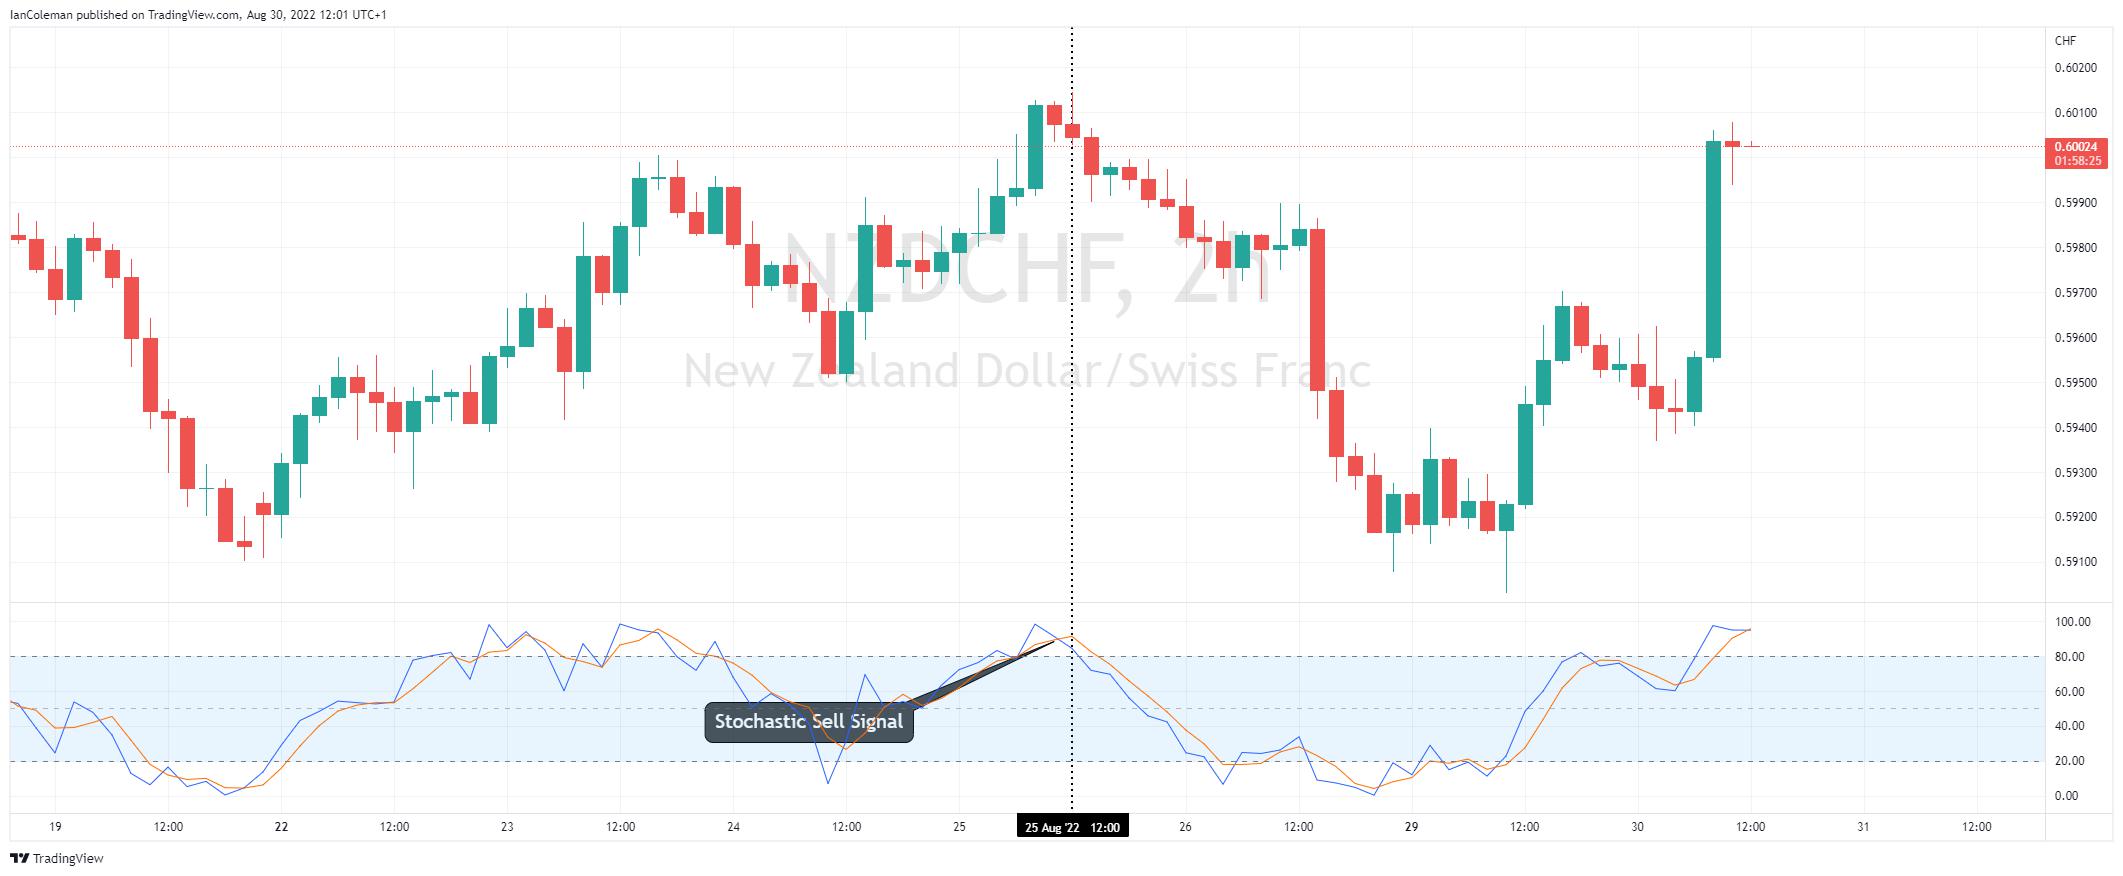
Figure 1 Trading View Stochastic Sell Signal
It produces a potential buy signal when the oscillator has moved into oversold territory (below 20) and the slow %D line moves above the faster %K line.
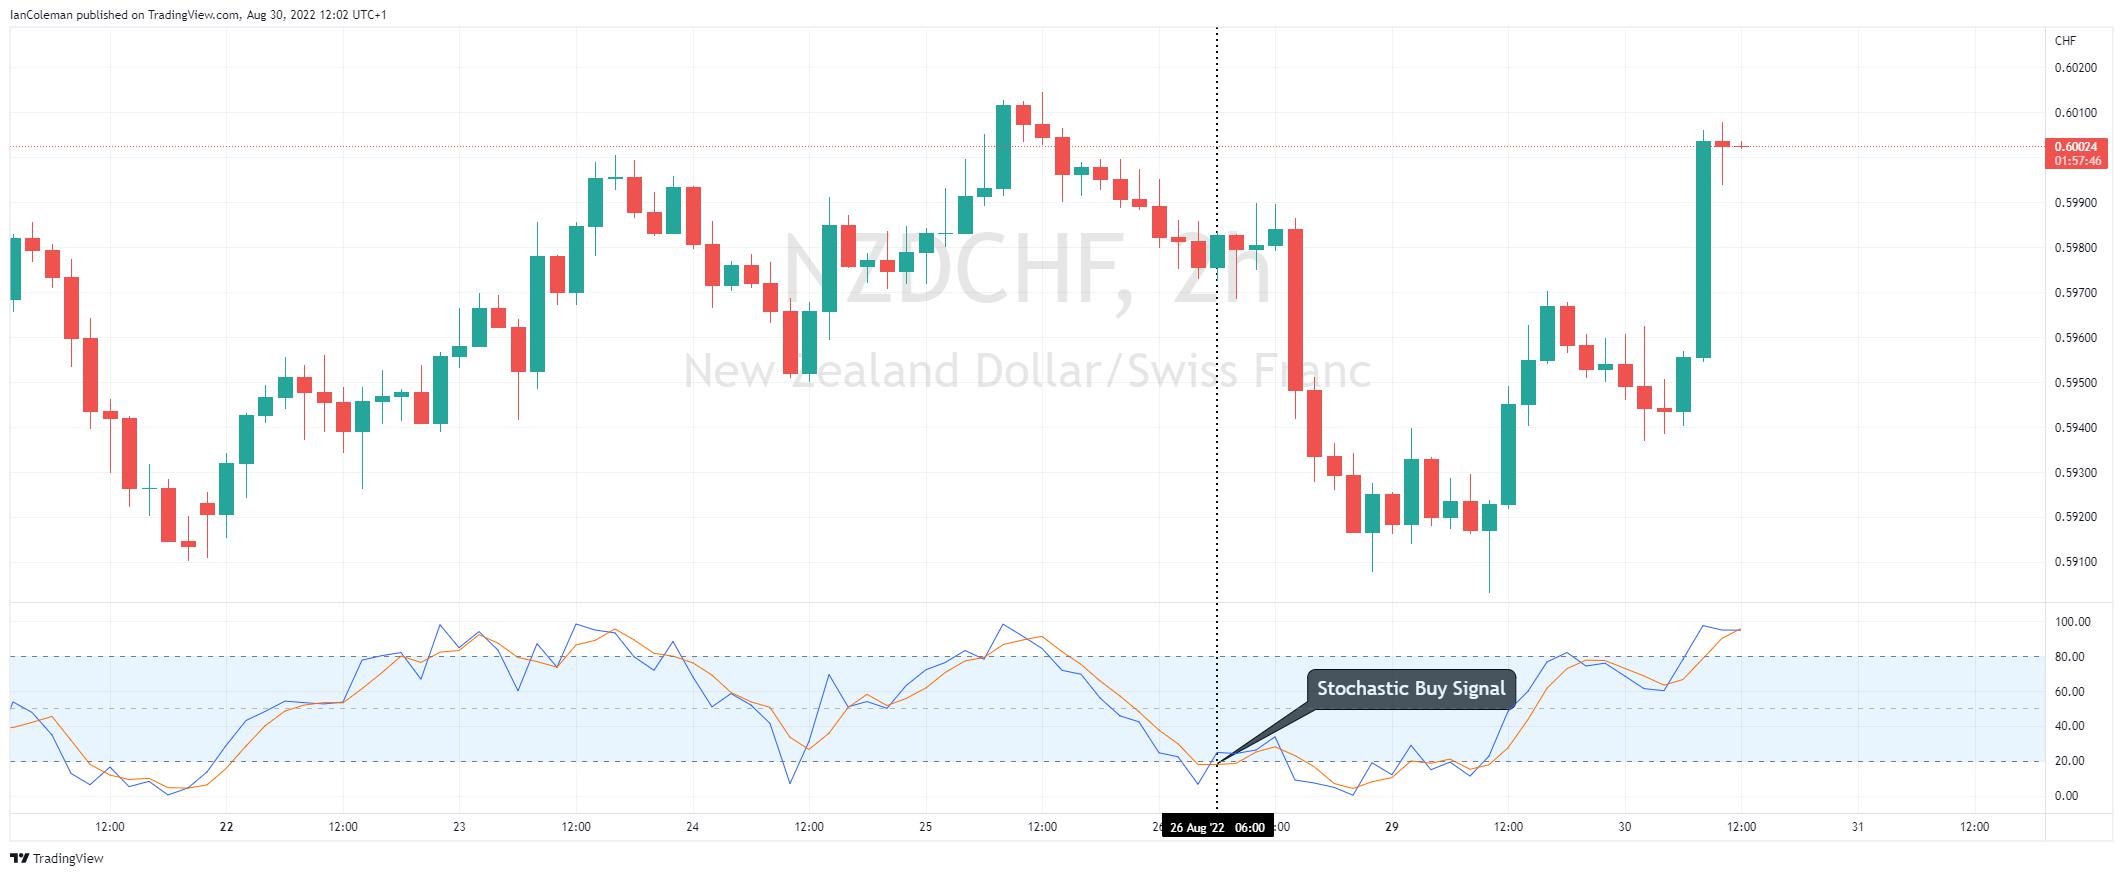
Figure 2 Trading View Stochastic Buy Signal
Dealing with false Signals
As you can clearly see from the chart above, the stochastic indicator can produce false signals. For this reason, it is not recommended as a stand-alone product and should only be used as extra confirmation. Price needs to be studied and analyzed before placing emphasis on indicators.
The power of divergence
The oscillator can also be used to produce bullish or bearish divergence. This highlights that the momentum or strength of the last rally (or selloff) is weakening. Divergence is often seen at the top or the bottom of a trend or can indicate at least a correction in the opposite direction.
Bullish divergence highlights the asset making a lower low while the stochastic indicator makes a higher low.
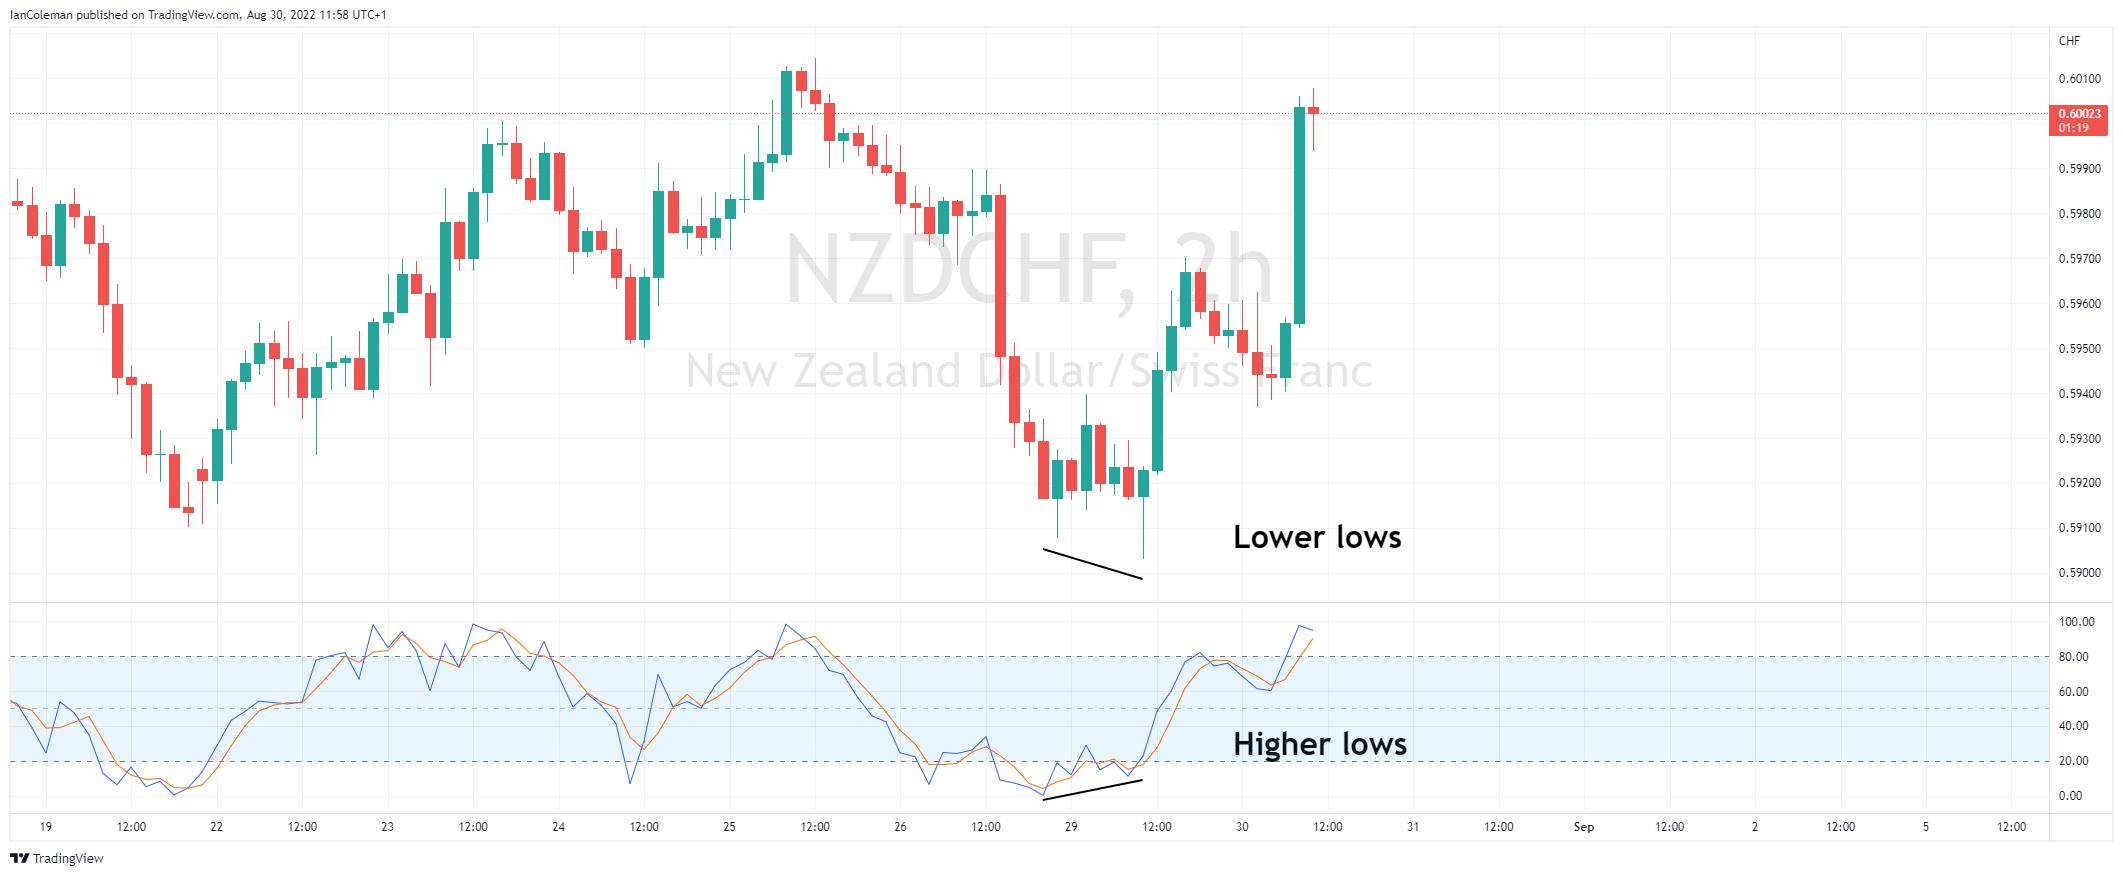
Figure 3 Trading View Bullish Divergence
Bearish divergence highlights the asset making a higher high while the stochastic indicator makes a lower high.
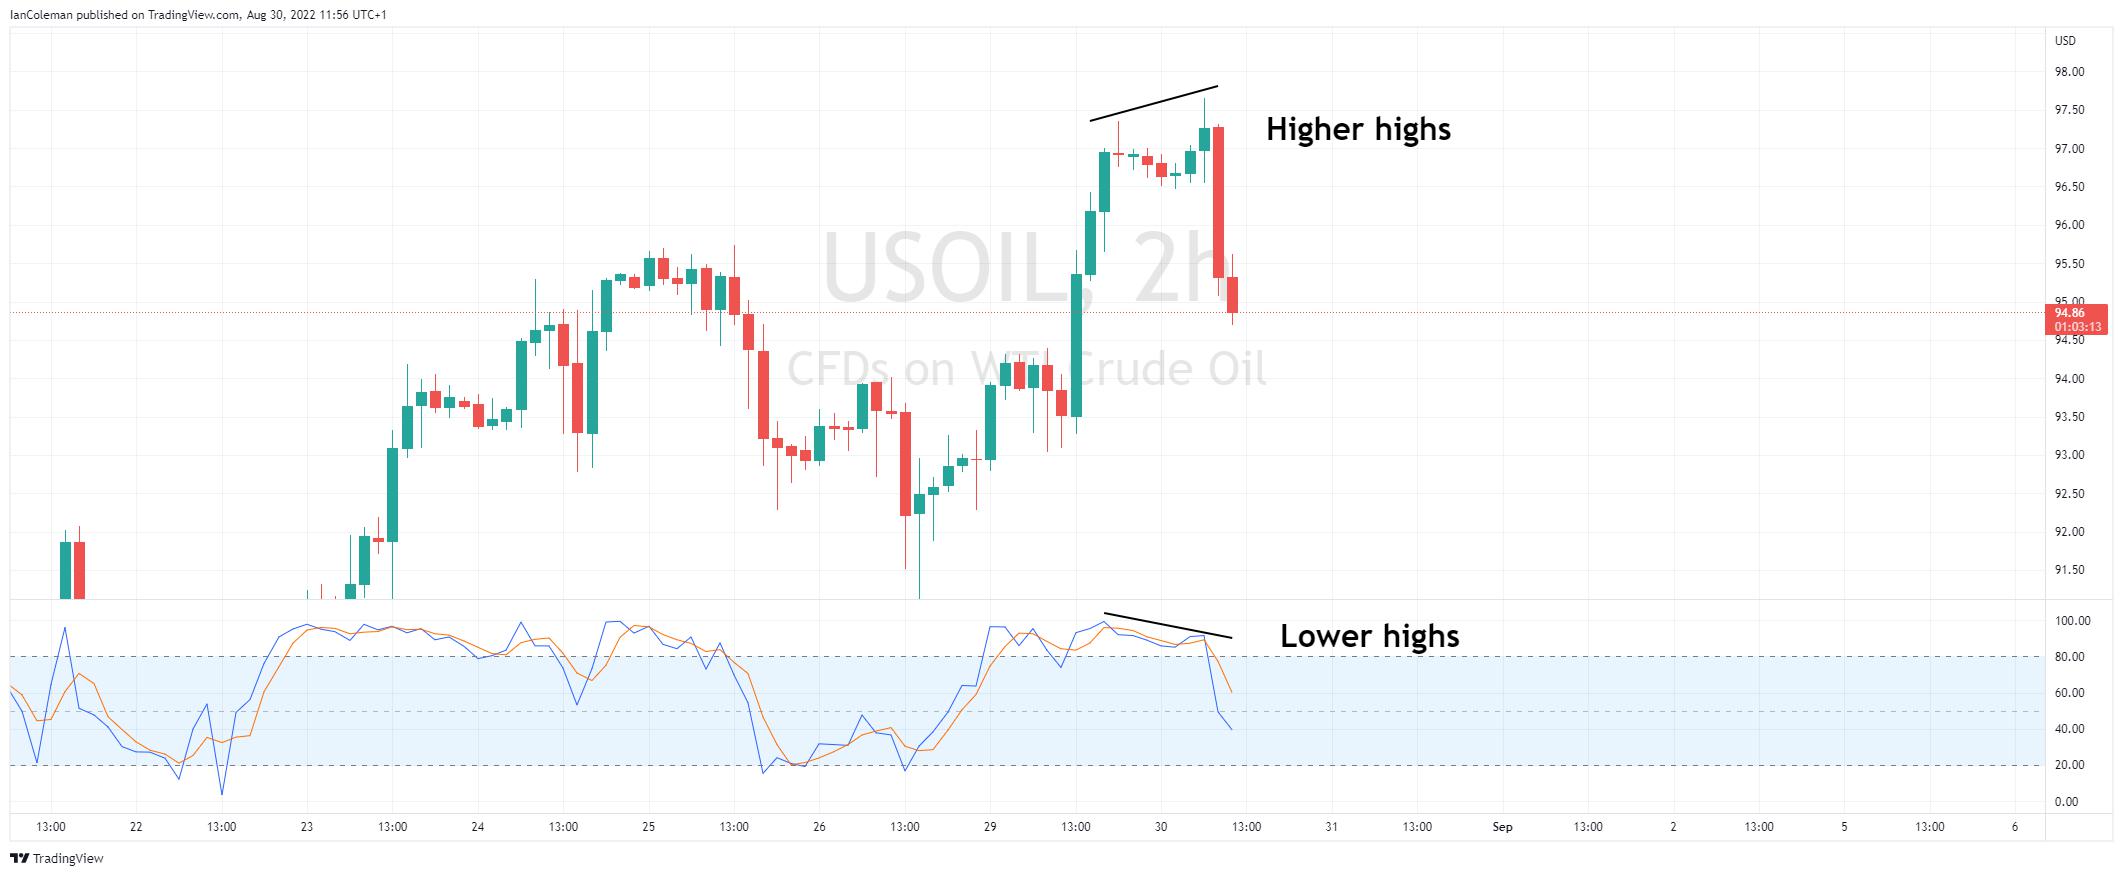
Figure 4 Trading View Bearish Divergence
The power of confirmation
Conclusion: Used in conjunction with other charting methods such as reversal candle formations and divergence, can strengthen the stochastics capabilities.
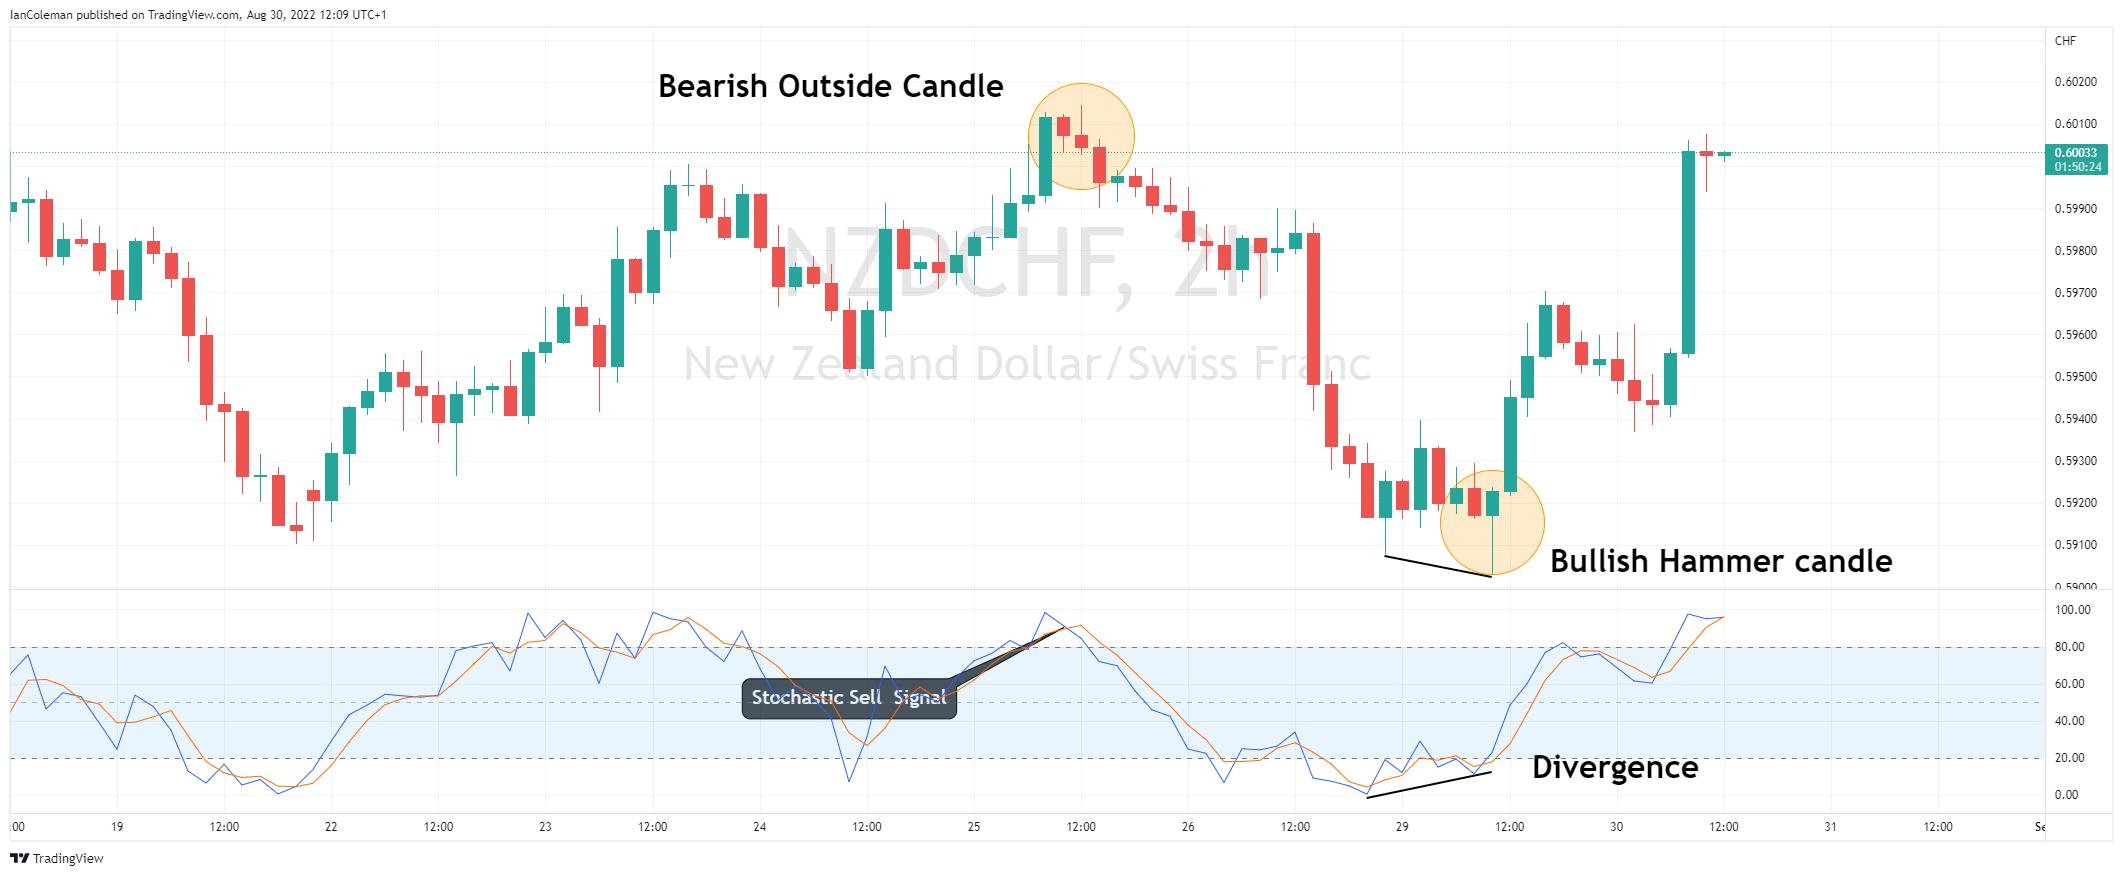
Figure 1 Trading View The Power of Confirmation
Related articles
The material provided here has not been prepared in accordance with legal requirements designed to promote the independence of investment research and as such is considered to be a marketing communication. Whilst it is not subject to any prohibition on dealing ahead of the dissemination of investment research we will not seek to take any advantage before providing it to our clients.
Pepperstone doesn’t represent that the material provided here is accurate, current or complete, and therefore shouldn’t be relied upon as such. The information, whether from a third party or not, isn’t to be considered as a recommendation; or an offer to buy or sell; or the solicitation of an offer to buy or sell any security, financial product or instrument; or to participate in any particular trading strategy. It does not take into account readers’ financial situation or investment objectives. We advise any readers of this content to seek their own advice. Without the approval of Pepperstone, reproduction or redistribution of this information isn’t permitted.