Pepperstone logo
Pepperstone logo
  • English
  • 中文版
  • Ways to trade

    Pricing

    Trading accounts

    Pro

    Premium clients

    Refer a friend

    Active trader program

    Trading hours

    24-hour trading

    Maintenance schedule

  • Trading platforms

    Trading platforms

    TradingView

    Pepperstone platform

    MetaTrader 5

    MetaTrader 4

    cTrader

    Integrations

    Trading tools

  • Markets

    Markets to trade

    Forex

    Shares

    ETFs

    Indices

    Commodities

    Currency Indices

    Cryptocurrencies

    Dividends for index CFDs

    Dividends for share CFDs

    CFD forwards

  • Market analysis

    Market news

    Navigating Markets

    The Daily Fix

    Meet the analysts

  • Learn to trade

    Trading guides

    CFD trading

    Forex trading

    Commodity trading

    Stock trading

    Crypto trading

    Bitcoin trading

    Technical analysis

    Candlestick patterns

    Day trading

    Scalping trading

    Upcoming IPOs

    Gold trading

    Oil trading

    Webinars

  • Pepperstone Pro

  • Partners

  • About us

  • Help and support

  • English
  • 中文版

Learn to trade

Trading

Performance review of Purple Group share price

Pepperstone
Pepperstone
Trading Guides
27 Sept 2022
Share

Some basic information about Purple Group

Purple Group, short code PPE, owns brands offering various financial services from investing in property, to trading and portfolio management.

The Purple Group has a market cap of 2.589 billion ZAR and a P/E ratio (Price to Earnings Ratio) of 45.2.

Preview

Figure 1 Trading View PPE 12/09/2022

The rise in Purple Group share price

In January 2018 the Purple Group share price posted a multi-year low of 6 ZAR. In June 2020 we started to see a steady rise in the share price that gathered strong momentum through 2021 and 2022. This resulted in a 6225% increase to the high trade of 350 ZAR in April 2022.

This was in line with the onset of COVID-19 and a rise in the interest of on-line investing.

Preview

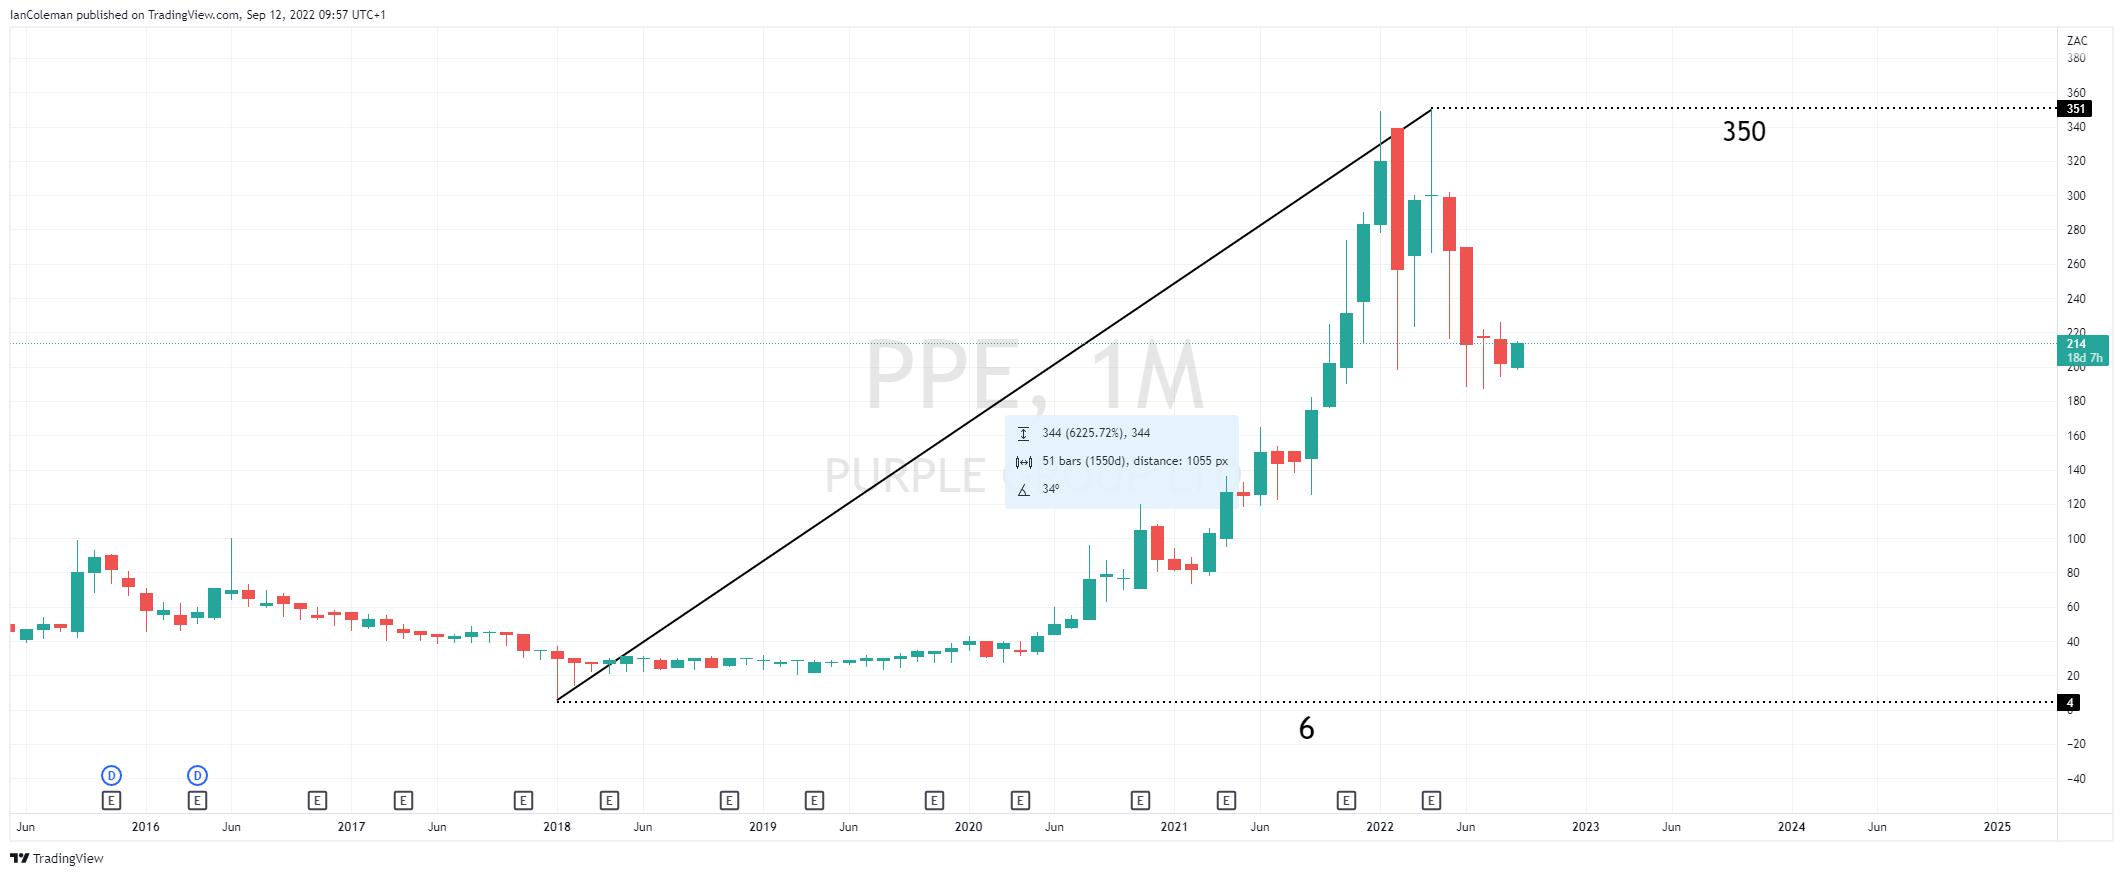
Figure 2 Trading View PPE share price increase of 6225%

A look from a fundamental perspective  

The group's last results were for the 6-months period ending in February 2022. The highlights are:

  • Group revenue increased by 36.0% to R137 million;
  • Group costs increased by 39.7% to R93 million, however, the operating cost per invested EasyEquities client decreased by 24.7% to R80 per client, compared to the prior comparative period; and
  • Profit attributable to shareholders increased by 114.2% to R17.7 million, compared to a profit of
  • R8.3 million in the prior comparative period

An interesting note in the adjoining letter from the CEO “Revenue per EasyEquites’ customer has returned to pre-Covid levels.”

With an interest in on-line flattening off since the world returned to some form of normality, can the strong growth continue?

For more information about fundamental analysis click here.

A look from a technical perspective  

We must look all the way back to 2005 -2007 before we can note a cluster of support and resistance levels. Often, what has previously acted as support will do so once more. This offers a ‘zone’ between 167 and 157 ZAR.

Preview

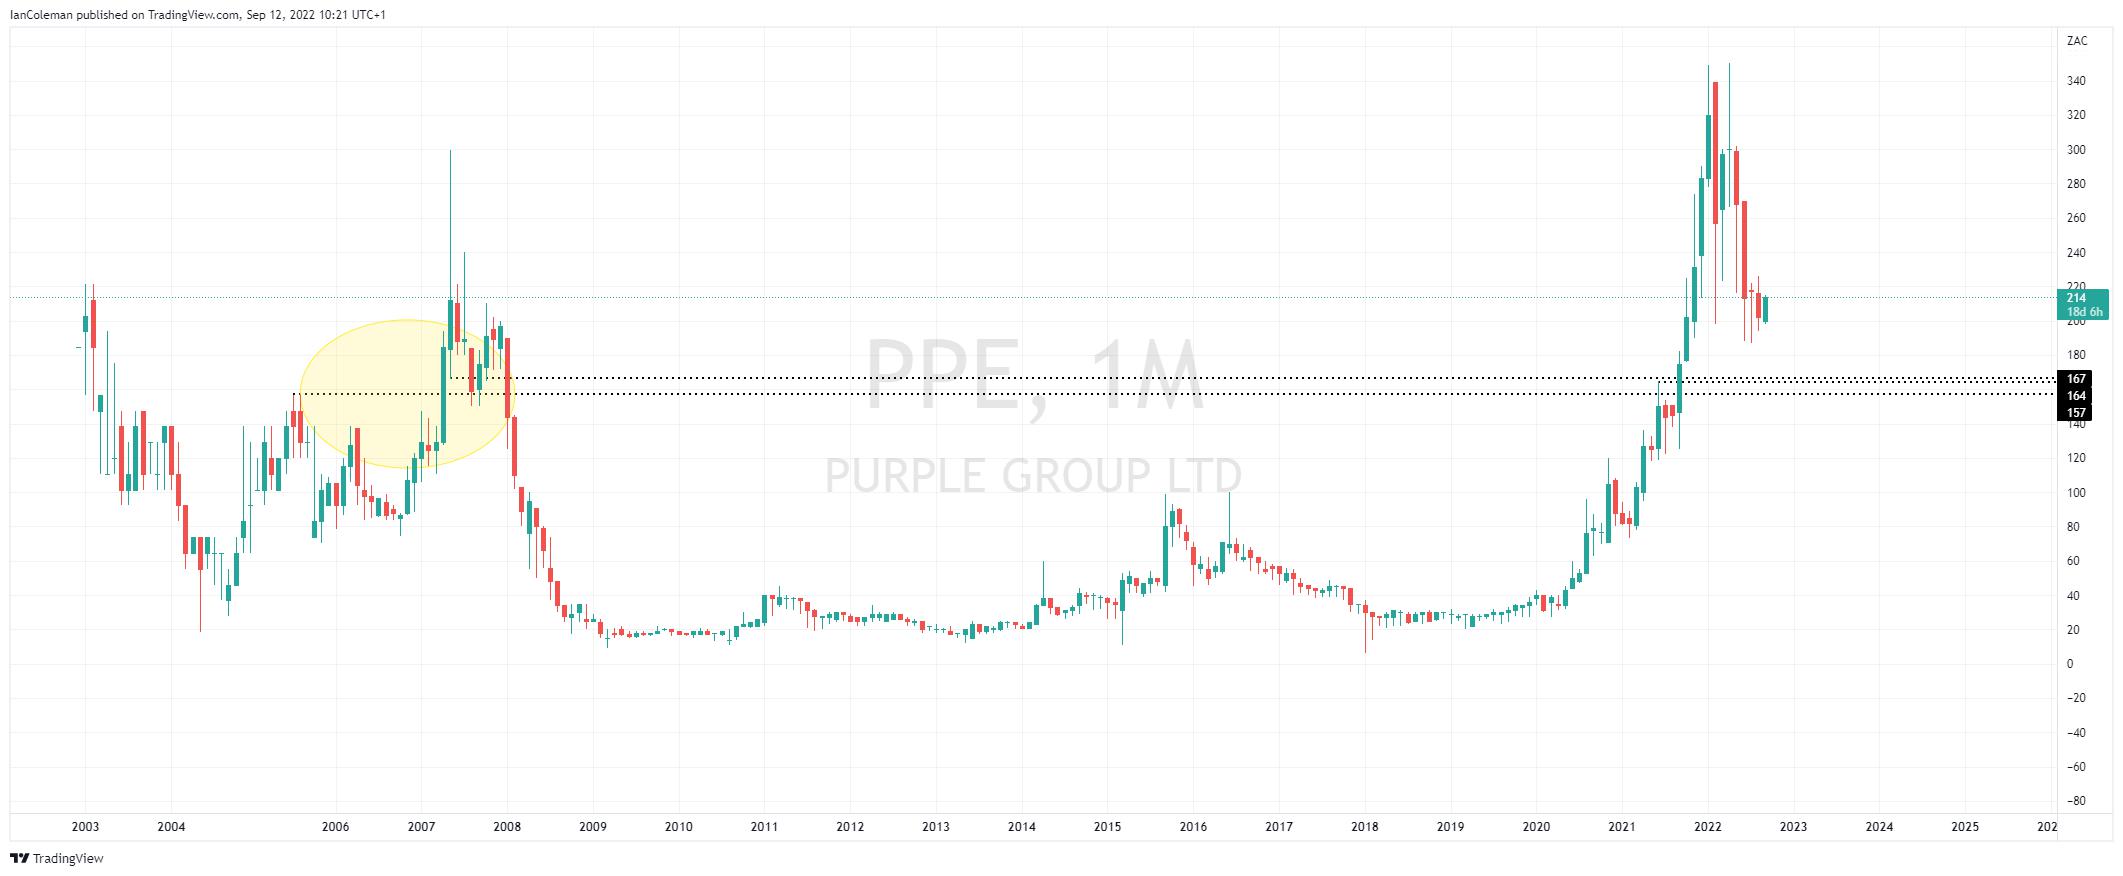
Figure 3 Trading View PPE previous support and resistance zone

We have a possible technical support level at 162 ZAR. A rejection of this level would form the AB leg of a cypher pattern known as Bat formation.

This would then suggest a possible upside correction towards 233 ZAR and possibly 328 ZAR.

Preview

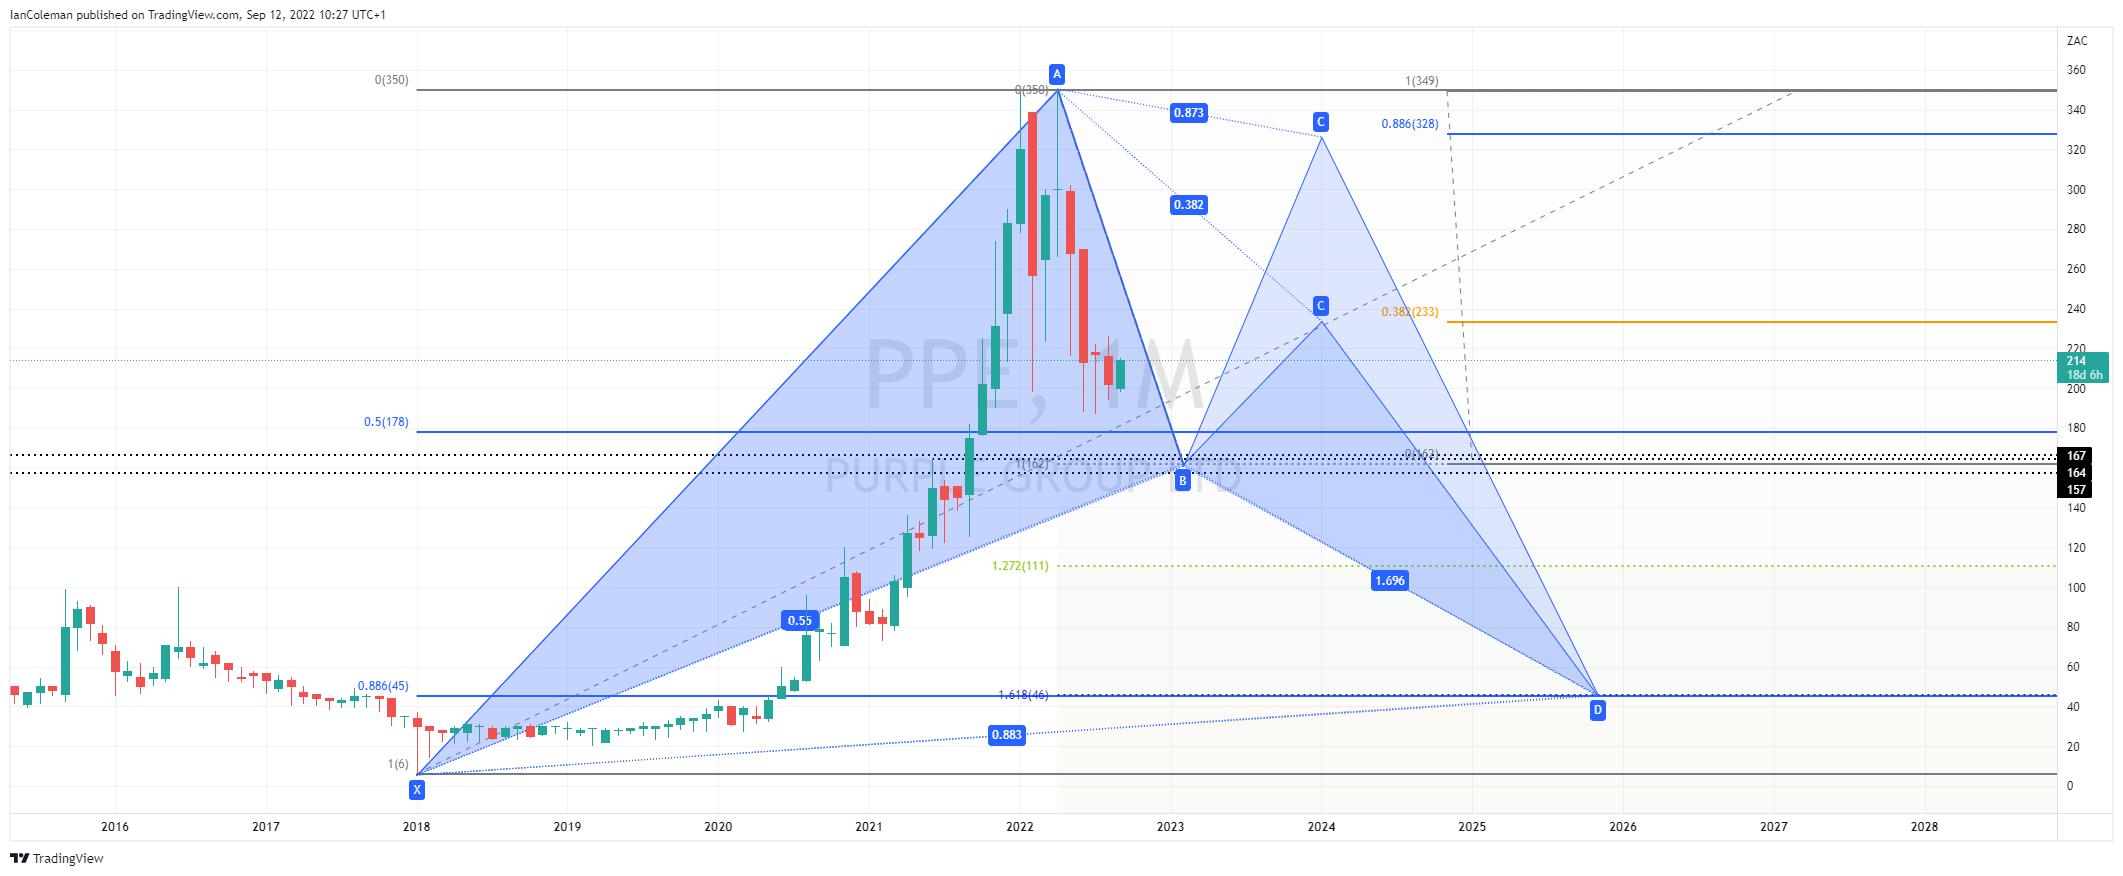
Figure 4 Trading View PPE possible BAT support


Related articles

How is Westpac share price expected to perform during 2022?

How is Westpac share price expected to perform during 2022?

Trading
Performance review of Capitec share price

Performance review of Capitec share price

Trading

The material provided here has not been prepared in accordance with legal requirements designed to promote the independence of investment research and as such is considered to be a marketing communication. Whilst it is not subject to any prohibition on dealing ahead of the dissemination of investment research we will not seek to take any advantage before providing it to our clients.

Pepperstone doesn’t represent that the material provided here is accurate, current or complete, and therefore shouldn’t be relied upon as such. The information, whether from a third party or not, isn’t to be considered as a recommendation; or an offer to buy or sell; or the solicitation of an offer to buy or sell any security, financial product or instrument; or to participate in any particular trading strategy. It does not take into account readers’ financial situation or investment objectives. We advise any readers of this content to seek their own advice. Without the approval of Pepperstone, reproduction or redistribution of this information isn’t permitted.

Other sites

  • The Trade Off
  • Partners
  • Group
  • Careers

Ways to trade

  • Pricing
  • Trading accounts
  • Pro
  • Premium Clients
  • Active Trader program
  • Refer a friend
  • Trading hours

Platforms

  • Trading Platforms
  • Trading tools

Markets & Symbols

  • Forex
  • Shares
  • ETFs
  • Indices
  • Commodities
  • Currency indices
  • Cryptocurrencies
  • CFD Forwards

Analysis

  • Navigating Markets
  • The Daily Fix
  • Pepperstone Pulse
  • Meet the analysts

Learn to Trade

  • Trading Guides
  • Videos
  • Webinars
Pepperstone logo
support@pepperstone.com
1300 033 375
Level 16, Tower One, 727 Colins Street
Melbourne, VIC Australia 3008
  • Legal documents
  • Privacy policy
  • Website terms and conditions
  • Cookie policy
  • Whistleblower Policy

© 2025 Pepperstone Group Limited

Risk Warning: Trading CFDs and FX is risky. It isn't suitable for everyone and if you are a professional client, you could lose substantially more than your initial investment. You don't own or have rights in the underlying assets. Past performance is no indication of future performance and tax laws are subject to change. The information on this website is general in nature and doesn't take into account your personal objectives, financial circumstances, or needs. You should consider whether you’re part of our target market by reviewing our TMD, and read our PDS and other legal documents to ensure you fully understand the risks before you make any trading decisions. We encourage you to seek independent advice if necessary.

Pepperstone Group Limited is located at Level 16, Tower One, 727 Collins Street, Melbourne, VIC 3008, Australia and is licensed and regulated by the Australian Securities and Investments Commission.

The information on this site and the products and services offered are not intended for distribution to any person in any country or jurisdiction where such distribution or use would be contrary to local law or regulation.

© 2024 Pepperstone Group Limited | ACN 147 055 703 | AFSL No.414530