- English
- 中文版
.jpg?height=93&quality=100)
Dollar Index (DXY):
On the topic of Russia and Ukraine, NATO foreign ministers will take place in an emergency meeting today. Yesterday, saw the discussions between Ukraine and Russia yield a temporary ceasefire and a humanitarian corridor created for those trying to leave. Then in the early hours of this morning (GMT), a nuclear power plant was hit by Russian shelling – causing a fire to break out. This raised radiation concerns, however, reports have confirmed that there has been no rise in radiation and the fire is under control. Ukraine’s foreign minister is looking at the option of bringing in international peacekeepers. This would probably scare markets, the reason being – international troops would likely come face to face with Russian troops and this could lead to an accident etc and raise the risks of WW3. Additionally, French President Macron gave an ominous update after his 90-min call with Putin. Essentially, saying the situation is going to get worse.Some are asking if we could we see another dollar funding squeeze occur. I would be shocked if we did given swap lines implemented during the height of the covid financial meltdown should prevent such a scenario. This does come at a time when the Fed is sucking liquidity/dollars out of the economy however. EM margin FX is at greater risk as only a few central banks have access to swaps and rather have to rely on their repo holdings which caps the amount of dollars they can tap. There are 3 indicators which provide insights into the risks of a funding squeeze. 1) Ted spread – differential between three-month Libor rates (inter-bank lending rate) and the T-bill rate. 2) FRA-OIS spread - captures the difference between three-month Libor and the overnight index swap rate. 3) EURUSD 3-month basis – measures the cost of accessing dollars through the margin FX market. The more negative the number the tighter dollar funding conditions are becoming. So far these 3 indicators are showing some pressures building, however, not near panic levels. The FRA-OIS spread particularly shot higher yesterday to around 35bps (80bps during height of covid) which indicates credit risk rising within the banking sector. The economic outlook is increasingly pointing towards stagflation (higher inflation; lower growth) - a central bankers worst nightmare. The risks are tilted negatively – to the upside for inflation and to the downside for growth. The Atlanta Fed has cut US Q1 GDP to 0% in their forecast. During Jerome Powell’s testimony he stated that he felt 25bps was the correct increment to move by at the March meeting, however, he did also caveat that with - if inflation stays hot and persists, we could hike 50bps at a meeting/s. I feel in the current circumstances 25bps would be his increment of choice. He additionally alluded to the Ukraine Russia conflict creating a lot of uncertainty for the US economy. Non-Farm Friday’s didn’t disappoint yet again. We had another massive beat on the headline figure with 678k jobs gained in February vs the consensus of 400k. The unemployment rate ticked down to 3.8% (pre-covid 3.5%). What did surprise on the downside was average hourly earnings, coming in at 5.1% YoY vs 5.8% exp. This was due to a larger chunk of employment gains coming from low-wage hires and longer average hours being clocked up. The participation rate rose while unemployment dropped – that’s a good sign, however, not enough in my opinion to push the Fed into a 50bps hike. Next week Thursday’s inflation print will be key to get another read on inflationary pressures.
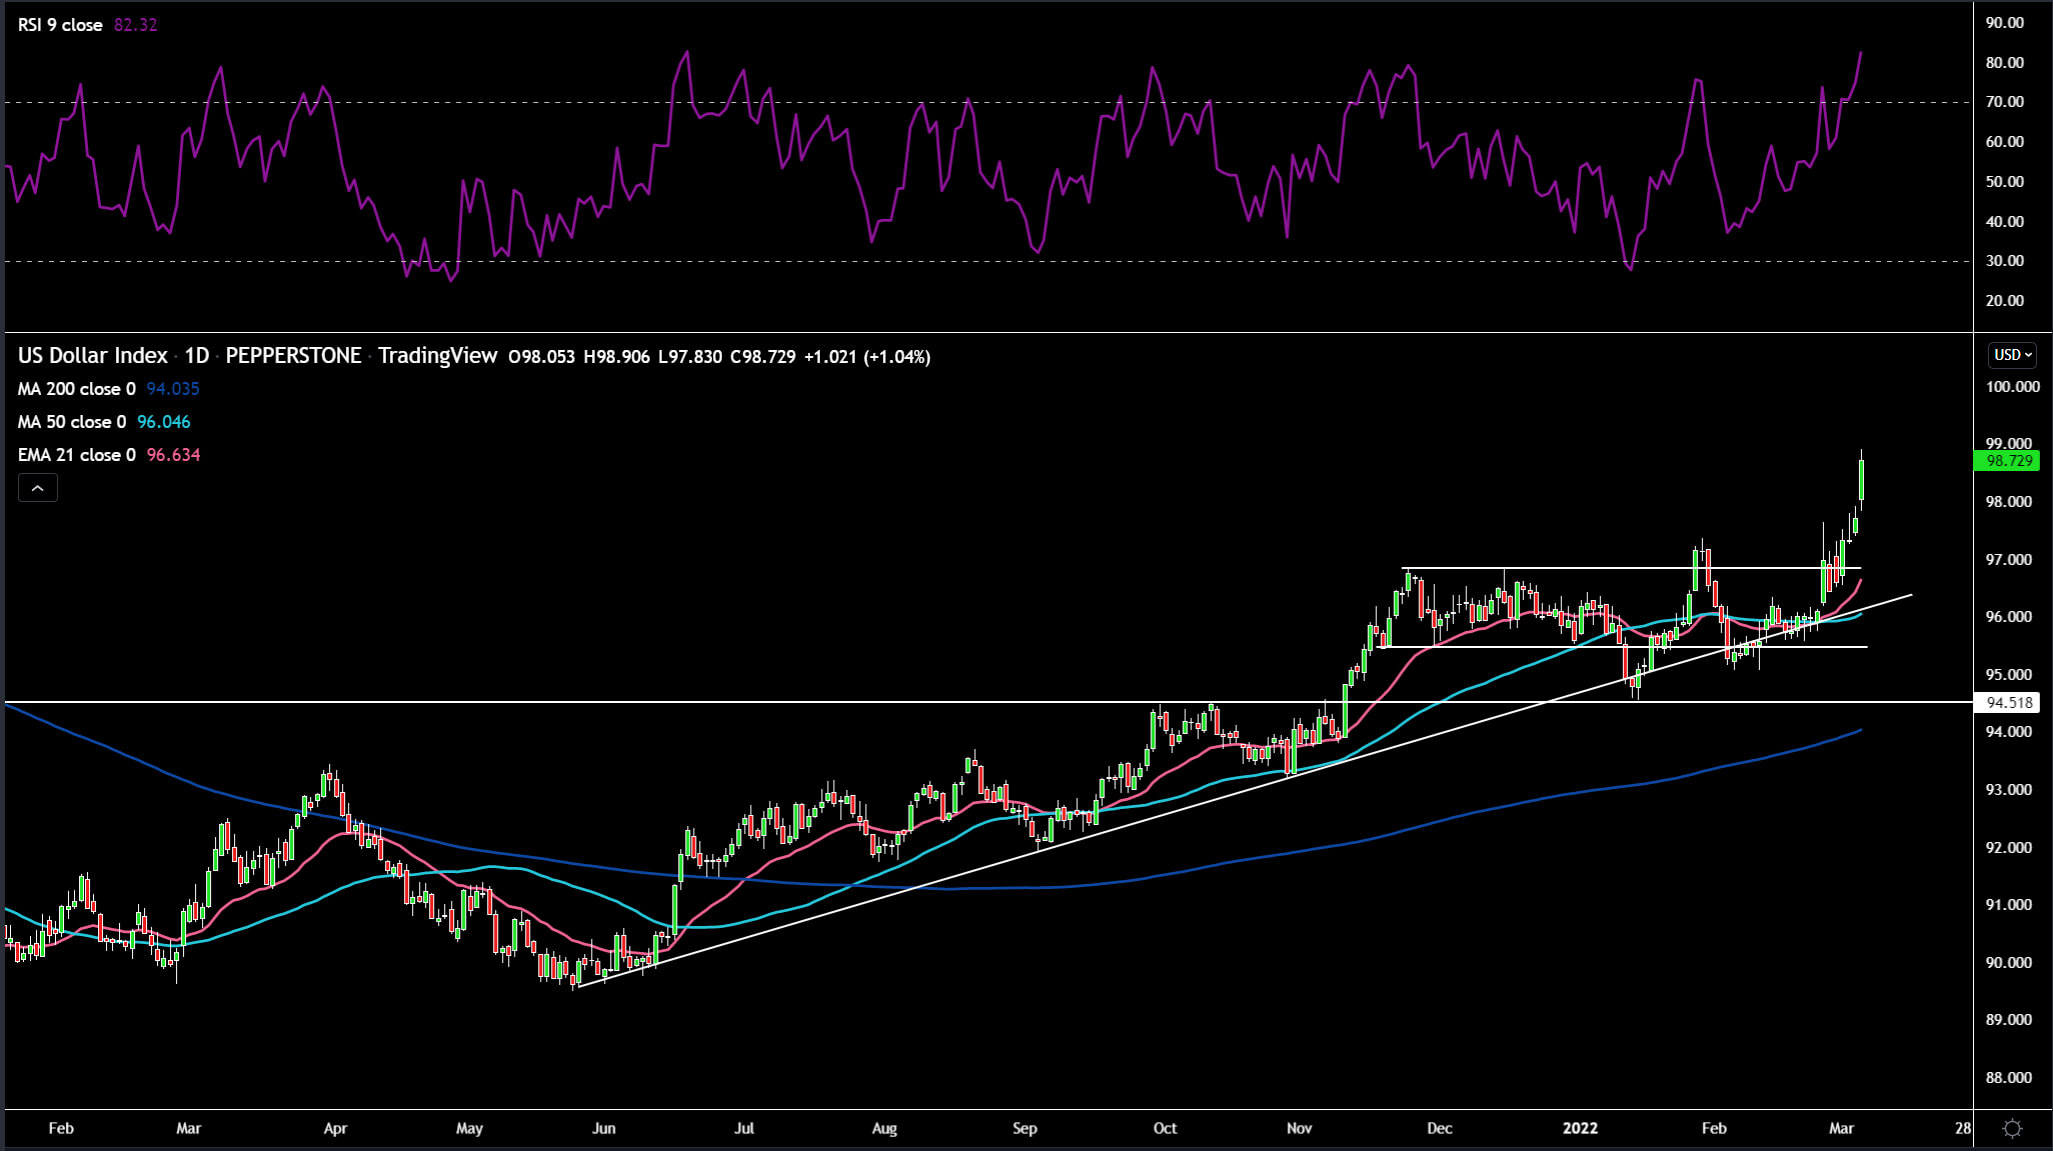 (Source: TradingView - Past performance is not indicative of future performance.) It's quite hard to perform technical analysis at the moment as charts are being driven by erratic news flow. DXY is deeply overbought on the RSI indicator and has surged recently. 100 comes into view on the upside. On the downside the former range resistance around 97 would be the level to watch.
EURUSD:
Bond markets were carnage on Tuesday with sizeable bps moves lower. Italian 10-year yields dropped by more than 30bps. A complete recalibration of rate expectations and significant short positioning in front end bonds was the potent combination which saw the squeeze. ECB Governing Council member Olli Rehn (known for being a hawk) remarked on Tuesday about assessing and reflecting on the speed of normalizing monetary policy as well as avoiding a premature exit before the impact of the war has been properly assessed. Wednesday saw EURUSD make a new low around 1.105, these levels were last seen in May 2020. the ECB are in a very tough situation. The higher energy prices climb the lower the euro falls. This creates a nasty inflationary spiral effect. The ECB finds themselves in a precarious position. Speaking of inflation, it’s red hot over in Europe. On Tuesday Germany’s harmonised inflation rate topped estimates coming in at 5.5% on a YoY basis. Eurozone inflation out on Wednesday was strong too, printing at 5.8% vs the est of 5.4% YoY. Core also outperformed at 2.7% YoY.The US will be less affected by the fallout from Ukraine and Russia and this will allow the Fed to continue to outpace the ECB in terms of normalizing policy as well as being less likely to perform a policy reversal. The volatility skew for 3 month 25 delta risk reversals (difference between implied volatility of out the money puts and calls), heavily favours downside protection via puts (large negative number). EURUSD sliced through 1.10 today, taking out stops on its way. The minutes out yesterday from the ECB clearly indicated a shift in thinking due to fears of out of control inflation. Next week’s meeting looked to be where the big “pivot” would have taken place, but with the conflict in Ukraine I sense this will now be put on the back burner until more clarity can be gained with regards to the outcome of the conflict. Parity is creeping ever closer on EURCHF – keep it on the radar.  (Source: TradingView - Past performance is not indicative of future performance.) 1.10 has been breached. That’s a key psychological level for EURUSD, signifying lots of technical damage. It looks like 1.09 is the next level to watch, we got just below there intra-day. The RSI is deeply oversold, but in these kind of markets, we can become even more oversold. 1.05 is the word on the street. I think parity would be a bit of a stretch, but who knows if things get really bad.
GBPUSD:
With zilch in terms of key economic data for GBP traders, attention was shifted towards the speeches of Catherine Mann and Michael Saunders (both voted for 50bps hike at the previous meeting). Saunders advocates a prompt tightening schedule which he believes will allow for a shallower overall path of hikes. He is concerned about inflation expectations becoming unanchored and wants flexibility to be able to cut rates for the next crisis. Saunders, however, also said just because he voted for 50bps at the last meeting doesn’t mean he will do so at the next. Catherine Mann at her event stated the policy strategy is a front loaded one in order to counter expectations. In terms of extreme moves within bond land, 10-year gilt yields slid by 30bps (largest 1 day decline since 1992). Clearly a big risk-off move. EURGBP is looking very interesting with price now taking out the previous almost 6 year low. Will this break below 0.83 actually push lower towards 0.82? We’ll have to wait and see, but with current conditions now seems like the moment it could.
(Source: TradingView - Past performance is not indicative of future performance.)
Cable got drilled just like the euro today with a big bearish candle on the charts. The 61.8% Fibonacci level has been broke. The 1.32 round number support is coming into view. Not as deeply oversold as EURUSD, so still room for a further fall here. 1.34 would be where I watch on any rallies to the upside.
USDJPY:
Dollar yen remains rangebound around the 115.5 zone, supported by the 50-day SMA on the downside. Japan is a large net oil importer so will be feeling the strain through their terms of trade figures. This should in theory allow the dollar to have the slight edge over the yen as the safe haven of choice.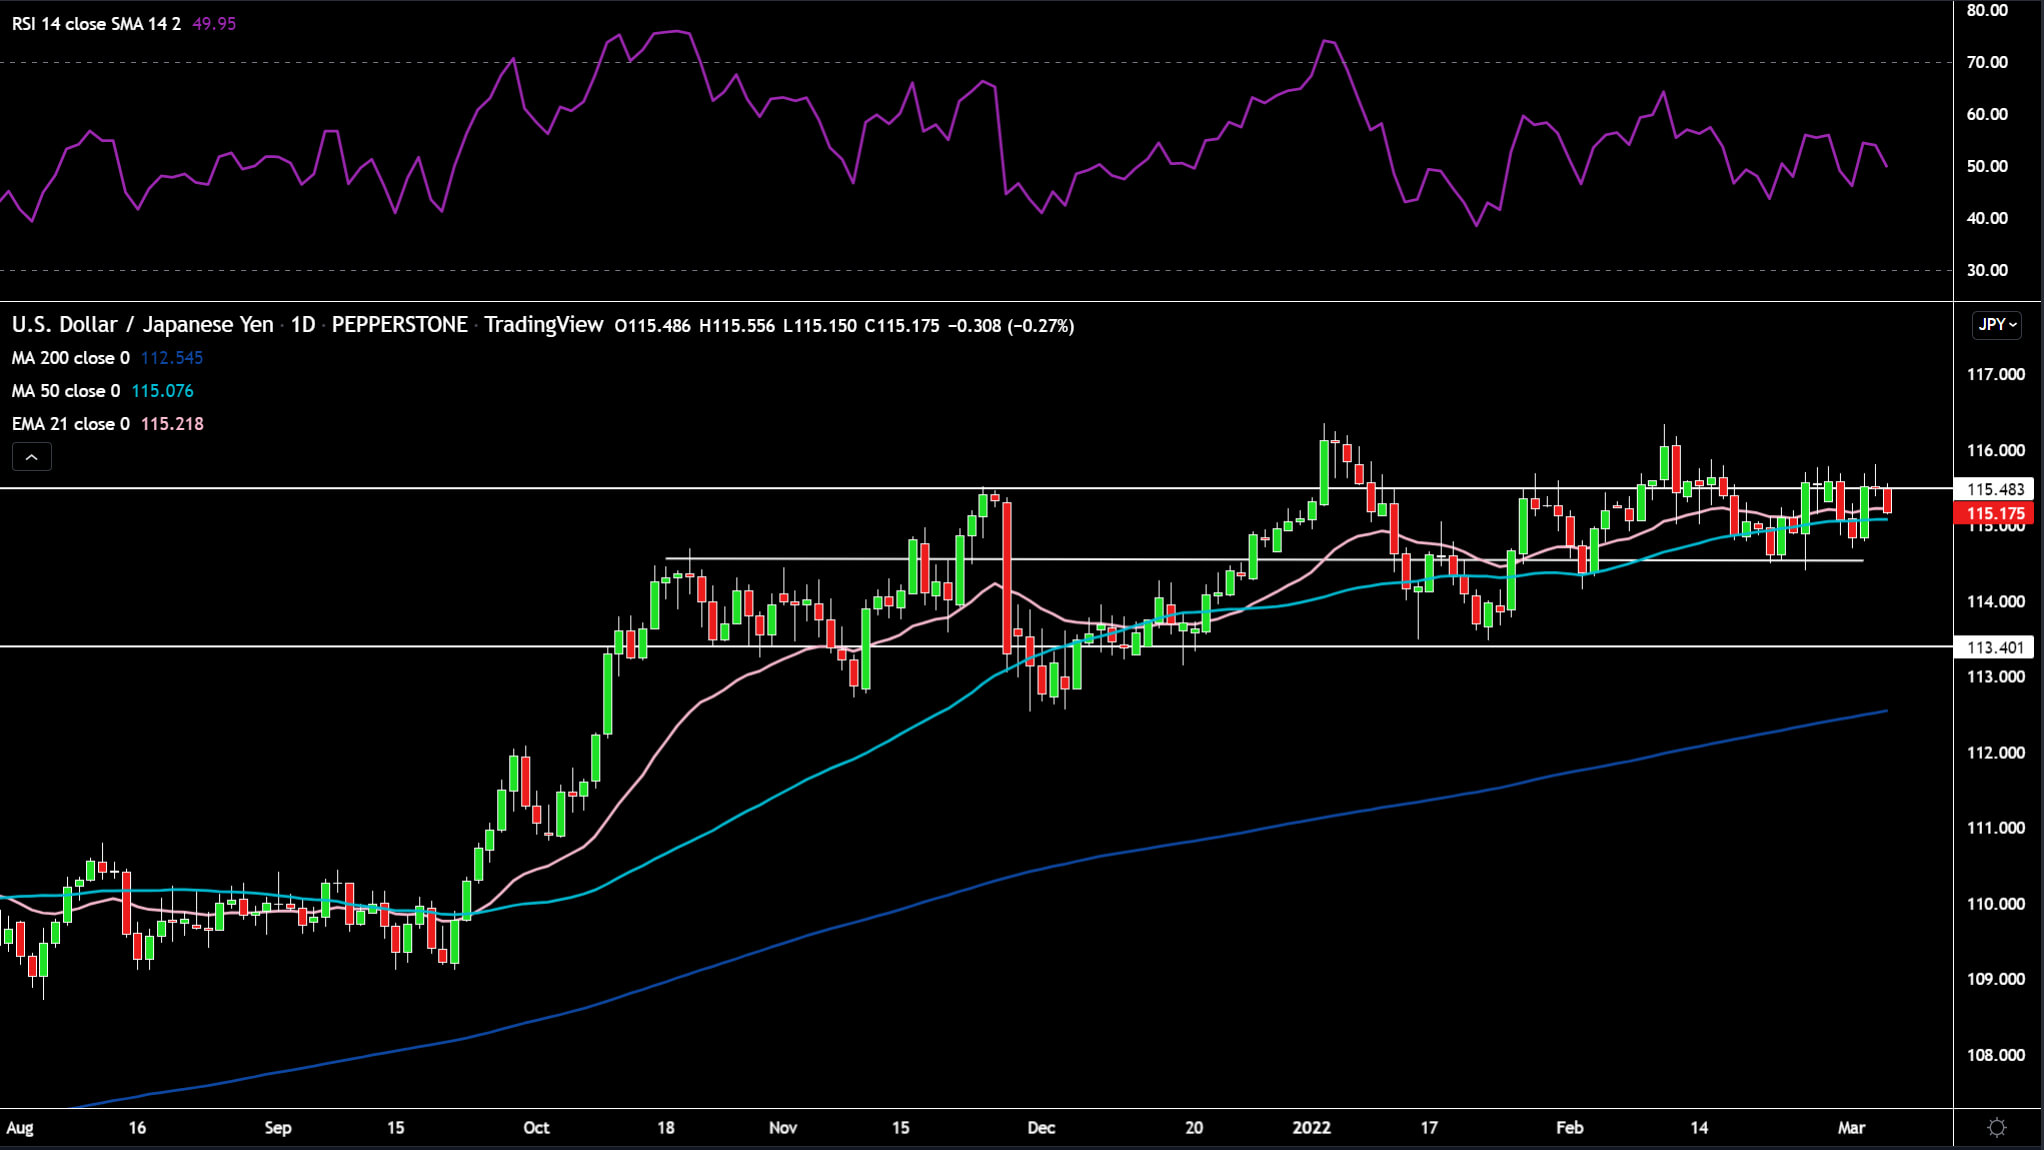
(Source: TradingView - Past performance is not indicative of future performance.)
Gold:
Gold has a few factors working in its favour currently. Geopolitical risks are seeing flows directed towards the yellow metal in a rapacious manner. Real yields have also collapsed which removes a headwind to further price gains. Almost made a complete round trip in US 10-year real yields as -1% is in the sights. Lastly, options market sentiment is showing a sizable vol skew in favour of upside (calls higher than puts). I wrote a more comprehensive piece here on gold.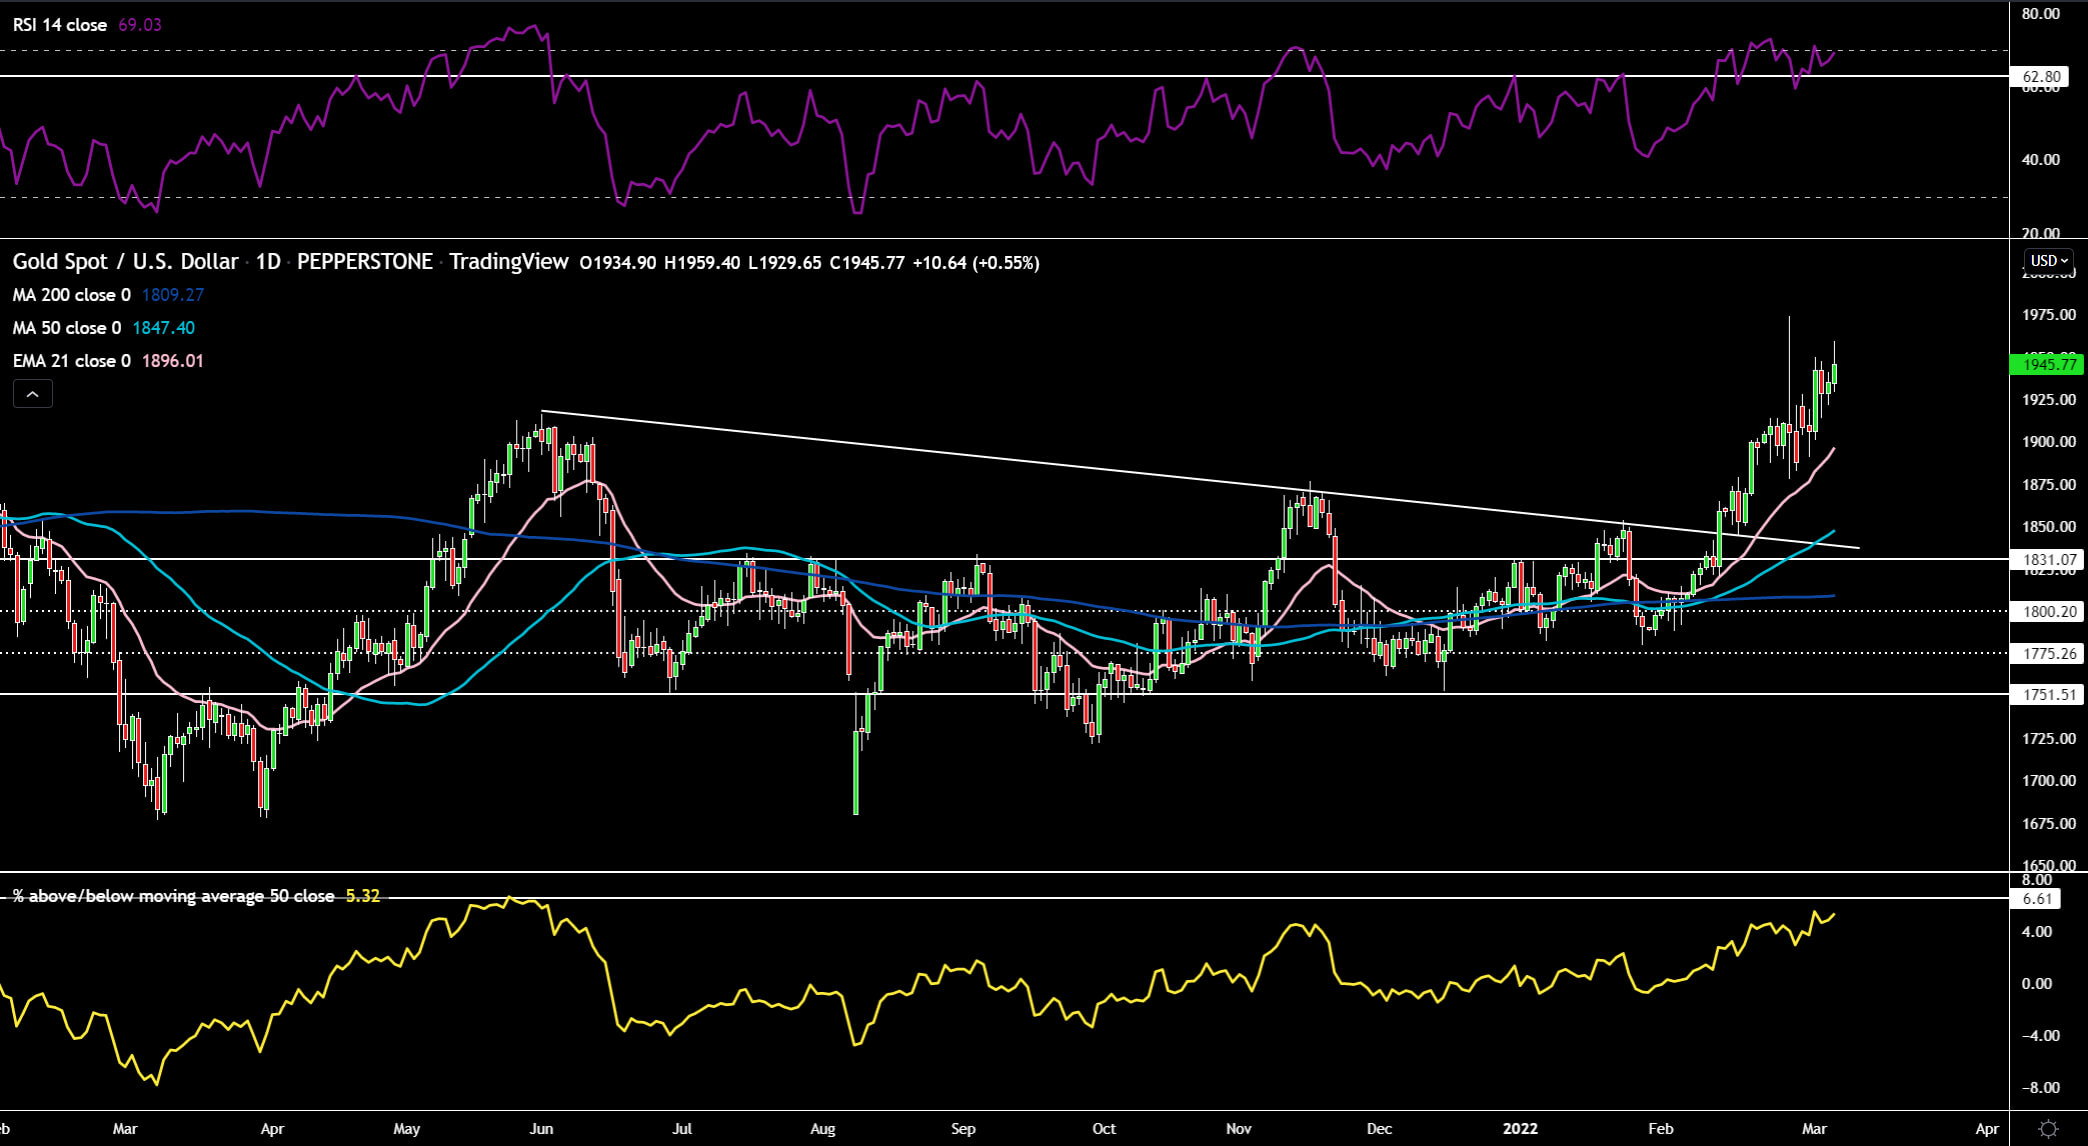
(Source: TradingView - Past performance is not indicative of future performance.)
Gold is chugging away higher with the former high of $1975 back in play. Price has just crept back into overbought territory on the RSI and the %above/below the 50-day SMA indicator in the bottom pane is approaching 6.61 (marked the peak for the May rally). Doesn’t mean we’ll see a reversion, but definitely something to think about. $1900 would be the level I watch on any sell-offs.
Crude Oil:
Oil the traders choice to hedge against the conflict in Ukraine and Russia tagged $120 a barrel on Wednesday. The driving narrative for oil and many other assets currently is the conflict. However, there are some other key developments which bears discussing. Nuclear talks with Iran seem to be progressing well with those in the know now saying a deal is imminent. Logically a deal now seems far more likely with Russian crude supply not being utilized. Iranian supply would not solve the entire problem, but would help somewhat to reduce the massive deficit between demand and supply. However, there is still some teething issues which need to be resolved – the IAEA found Iran had raised its share CFD of highly-enriched Uranium by 83%. Although there was a carve out within sanctions which excluded Russia’s energy exports from being targeted, no one is touching it. Trafigura tried to move Russian Urals crude by putting it up at a significant discount and still had no bids. Russian crude oil loadings are also showing material drops at key ports. An SPR release of 60 million barrels did nothing given it pales in comparison to the Russian supply now not being used. OPEC+ stuck to their guns and increased supply by 400k bpd. The next meeting is on the 31 March. Major investment houses are coming out with some scary targets for the price of crude. Bank of America has the scariest with $200 a barrel as a potential.
There are a few levers which can be pulled to avoid such horror scenarios 1) OPEC+ increases supply 2) Much larger coordinated SPR releases 3) US shale production ramps up 4) Iranian crude hits the market with a conclusion to a nuclear deal. Additionally, there will naturally be significant demand destruction which occurs at prices north of $120 for prolonged periods of time. 
(Source: TradingView - Past performance is not indicative of future performance.)
Oil seems unstoppable with price looking like it wants to have another go at the former high of just north of $120. The RSI is deeply overbought and there is significant space between the key moving averages and price. Despite the sharp rally I’d be very hesitant trying to short oil here as there is large option activity around the $120 strike which could lead to gamma squeezes taking place, pushing price higher. On the downside, I think $100 will be a key level drawn in the sand.

Ready to trade?
It's quick and easy to get started. Apply in minutes with our simple application process.
The material provided here has not been prepared in accordance with legal requirements designed to promote the independence of investment research and as such is considered to be a marketing communication. Whilst it is not subject to any prohibition on dealing ahead of the dissemination of investment research we will not seek to take any advantage before providing it to our clients.
Pepperstone doesn’t represent that the material provided here is accurate, current or complete, and therefore shouldn’t be relied upon as such. The information, whether from a third party or not, isn’t to be considered as a recommendation; or an offer to buy or sell; or the solicitation of an offer to buy or sell any security, financial product or instrument; or to participate in any particular trading strategy. It does not take into account readers’ financial situation or investment objectives. We advise any readers of this content to seek their own advice. Without the approval of Pepperstone, reproduction or redistribution of this information isn’t permitted.