- English
- 中文版

This week’s 50bp cut was supposed to calm markets but instead caused market panic. It seems monetary policy can do little to help markets against the virus fallout despite pricing for significant rate cuts.
It was the biggest sell-off since the Global Financial Crisis (GFC). Last week, markets priced such extreme probabilities of rate cuts that global central banks had no choice but to work together and slash rates across the board. But when the US Federal Reserve gave markets what they wanted and slashed the benchmark rate by 50bp (basis points) in an emergency meeting on Tuesday morning - the first since the GFC - markets still couldn’t find relief and instead equities sold-off and safe havens surged as virus panic took hold once again.
For the 18 March meeting, rate cuts are even more extreme. Right now markets are pricing a 100% chance of a 50bp rate cut and a 10% chance of a 75bp cut. Last week, markets had only half discounted a 50bp cut. The next one is fully priced in. The magnitude of this rate pricing only forces the Fed into cutting, otherwise causing market volatility and chaos. If they only cut by 25bp on 18 March, or not at all, at these probabilities the USD would rally uncontrollably.
The current implied policy curve (blue) sees rates falling as low as 0.33% one year from now. That would be the 0.25 - 0.5% target range. The outlook is vastly different to the implied curve just one month ago.
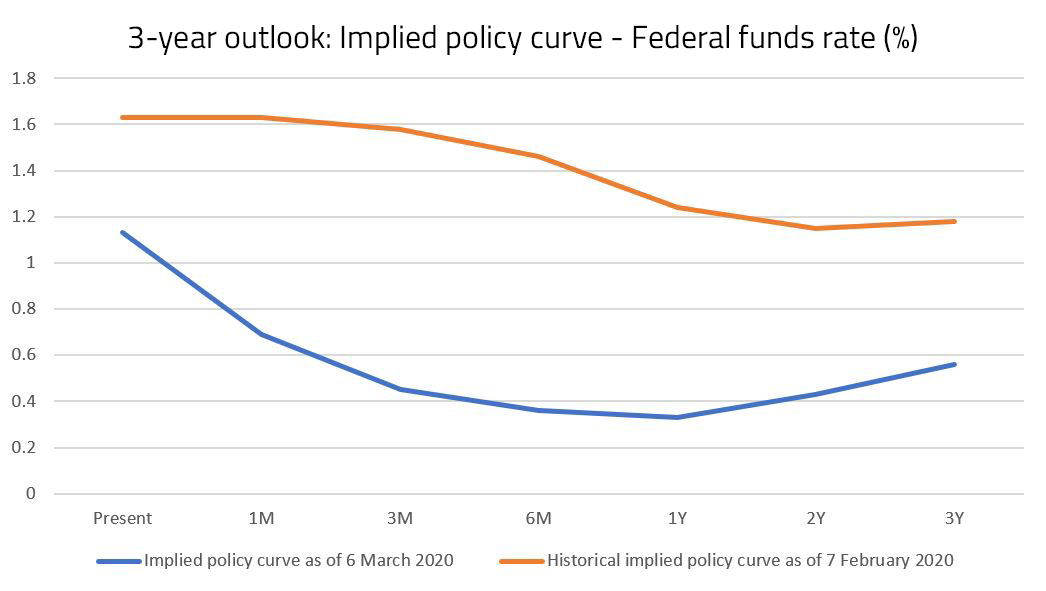
Source: Pepperstone, Bloomberg
The virus has only spread further since the Fed’s emergency cut and California has declared a state of emergency. As the US ramps up testing, confirmed cases will only increase, inciting more panic, voluntary isolation, reduced travel, and withheld spending. As rates markets price in more cuts, we’re looking at the zero lower-bound within a year.
Can drastic rate cuts support markets?
Fed Chair Jerome Powell acknowledged rates won’t be enough to prevent a downturn after announcing the emergency 50bp cut. Sure rate cuts will help a recovery once the virus is contained, but until then, rate cuts can’t prevent cities going into lockdown, cancelled travel plans and withheld spending.
An emergency cut in 1998 saw US stocks rally 50% in the following six months but was criticised for extending the dotcom bubble, which eventually crashed. Then the 2008 emergency cut did nothing to prevent the downturn and stocks fell another 50% before bouncing back.
Of course this is not a liquidity crisis like the GFC, rather it’s a supply and demand crisis as quarantines prevent people from working and spending. With global supply chains as interconnected as they are, particularly the dependence on China, the threat is significant.
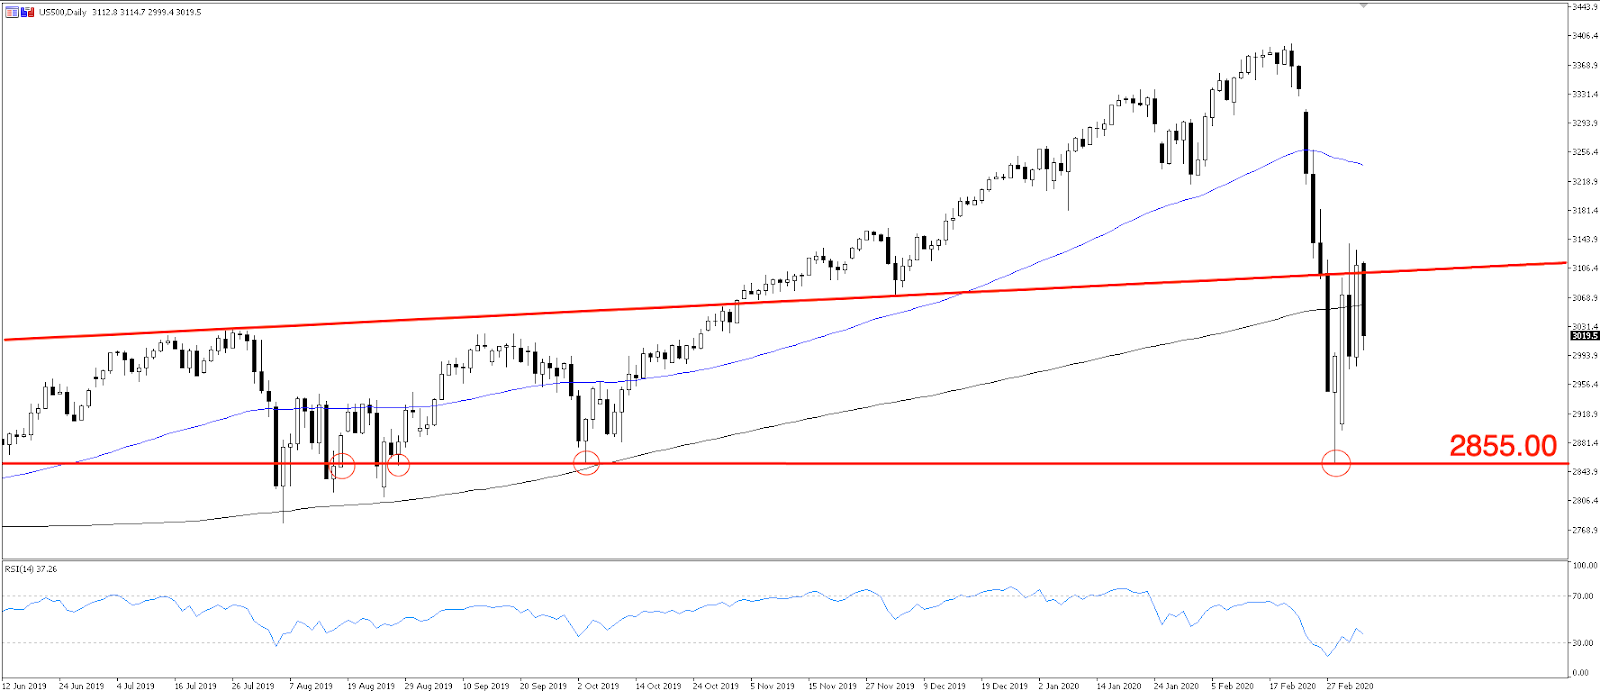
The benchmark S&P 500 index has strong support at the 2855.00 level and is currently hovering near the 200-day moving average (MA). A break of support at 2855.00, confirmed by a daily close below that level, would signal considerable weakness in the equity market and build the case for a move lower. For now, we expect choppy sideways price action until the bad news that virus cases climb significantly, or the good news that the virus has been contained.
These markets are seeing big moves up and down, so don’t get too carried away when the market swings higher. The chart below shows the huge daily percentage moves, both up and down, as markets collapsed during the GFC. Until there’s better clarity on whether this will cause a considerable slowdown or even recession, as record low US 10-year Treasury yields are suggesting, it would take a brave soul to buy the dip. Something to be cautious of.
1-day price change percentage in the S&P 500 index from January 2008 to today.
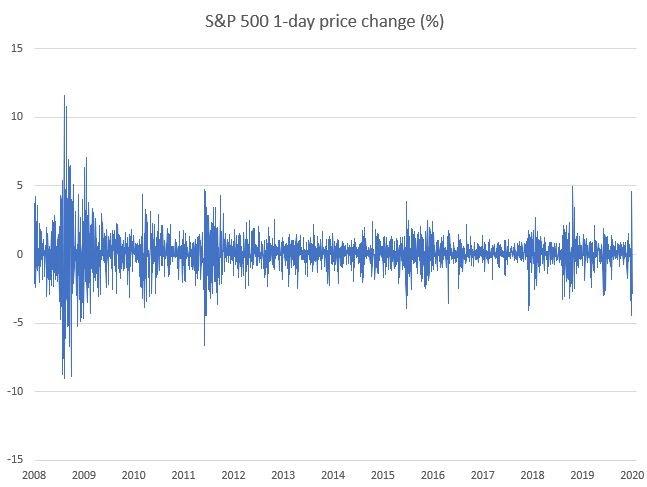
Source: Pepperstone, Bloomberg
What is the Fed watching?
This is a global production slowdown, so the Federal Reserve will be monitoring ISM data closely to understand the contagion impact on US companies. In February, Apple was the first major company to cause panic when it announced it would miss Q1 revenue guidance due to the supply disruption. Soon enough several other major companies revealed the same fate.
China’s manufacturing PMI for February printed at a miserable 35.7. Any number below 50 reflects a contraction, so this shows China in a deeper manufacturing contraction than during the GFC. See below China’s manufacturing PMI (yellow) against US ISM manufacturing (blue). The two tend to follow a similar trend over time.
US ISM Manufacturing (blue) against China PMI Manufacturing (yellow). How much downside does China’s lowest level threaten US manufacturing?
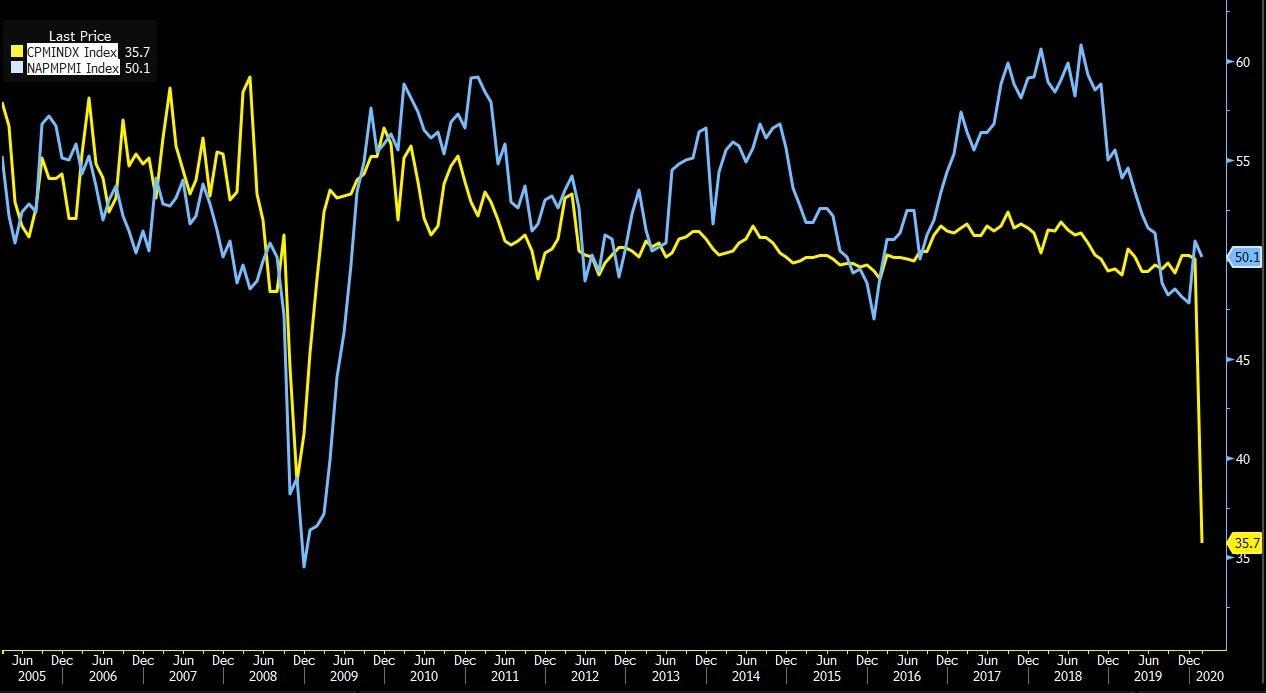
Source: Bloomberg
The US is bound to be affected by China’s downturn, but by what magnitude remains to be seen. US manufacturing sector certainly feels vulnerable. After spending the last five months of 2019 in contractionary territory amid the dragging trade war, US manufacturing only bounced back into expansion this January. At 50.1, it’s on the verge of contracting once again. A few more months of manufacturing data will reveal the full impact on US production as recession fears linger once again. Although rate cuts can’t prevent further virus outbreak and quarantines, they can encourage the economic recovery when it all blows over.
Considering the grim outlook, markets are unlikely to respond to improving data in any meaningful or sustainable way. Chances are markets will prey on weaker data as the downturn proliferates.
Farewell to the carry king
The US dollar has become increasingly strong the last few years. As the global economic outlook stagnated, the US economy and its dollar have been the least dirty shirt in the global laundry basket, or the best house in a bad neighbourhood.
Even early in the virus outbreak, USD strength marched on due to a strong domestic economy and what seemed like relative isolation from the virus. This markedly changed when CoVID-19 inevitably hit US shores and President Trump acknowledged the threat.
The US dollar index (USDX) has cooled 3.4% since a 2.5-year high on 20 February. In the same time, EURUSD has risen 4.3% and even AUDUSD, a global risk proxy, has pushed back above 0.6600 after falling as low as 0.6434.
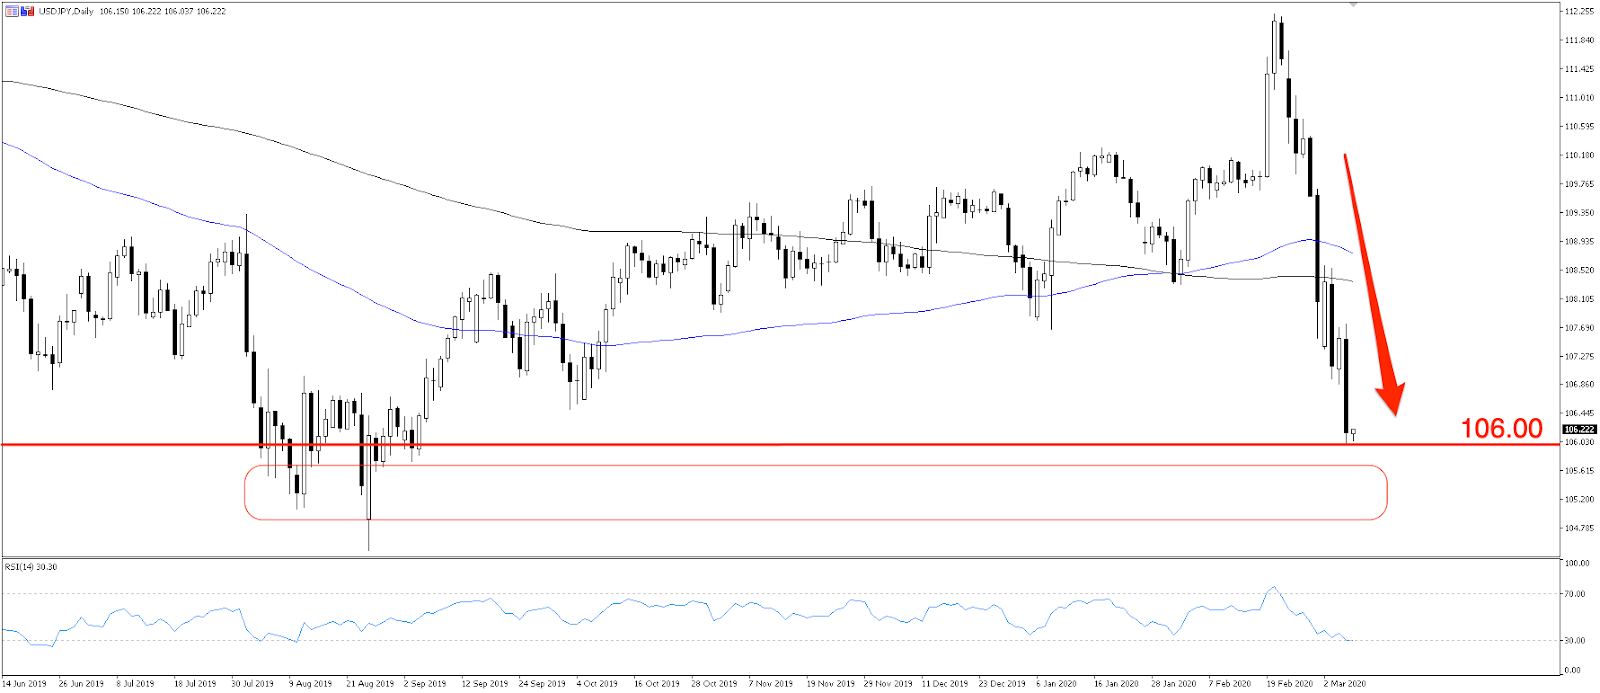
The USD weakness is best seen in the flight to safe havens. Weak GDP numbers in Japan weakened the yen and briefly pushed USDJPY above the 110.00 level before its safe haven qualities kicked in. The Japanese yen has strengthened 5.5% so far in the rush to safety. Testing the 106.00 level, USDJPY looks ready to take this downtrend to last year’s lows at the 105.00 level.
The USDJPY daily chart shows a strong downtrend as markets flee to safety. A few more bad headlines and the pair should have a go at the 105 level.
Coordinated policy response
As central banks coordinated a policy response to the global slowdown, the Reserve Bank of Australia (RBA) led the way with a 25bp rate cut to an historic low of 0.50%. The RBA has left the door open to more cuts when they meet again in April. The more the Fed cuts, the more measures other central banks will take - and the Fed has the most room to ease with higher rates than its major counterparts.
Since the Fed’s emergency cut, the Bank of Canada (BoC) has slashed by 50bp. The Bank of England (BoE), Bank of Japan (BoJ) and the European Central Bank (ECB) have pledged to use policy tools to ease conditions. The Reserve Bank of New Zealand (RBNZ) is expected to cut by up to 50bp at the 25 March meeting.
As countries reach the zero-lower bound, and some already have, we’ll be looking at government fiscal stimulus or unconventional measures like quantitative easing (QE).
When will central banks hike out of the lows?
In this low-rate, low-growth, low-inflation world: it will be a long time before central banks take rates higher. The sluggish backdrop was looming over the global economy long before the virus outbreak. Until inflation meaningfully picks up, we’re stuck with low rates for a good few years.
Ready to trade?
It's quick and easy to get started. Apply in minutes with our simple application process.
The material provided here has not been prepared in accordance with legal requirements designed to promote the independence of investment research and as such is considered to be a marketing communication. Whilst it is not subject to any prohibition on dealing ahead of the dissemination of investment research we will not seek to take any advantage before providing it to our clients.
Pepperstone doesn’t represent that the material provided here is accurate, current or complete, and therefore shouldn’t be relied upon as such. The information, whether from a third party or not, isn’t to be considered as a recommendation; or an offer to buy or sell; or the solicitation of an offer to buy or sell any security, financial product or instrument; or to participate in any particular trading strategy. It does not take into account readers’ financial situation or investment objectives. We advise any readers of this content to seek their own advice. Without the approval of Pepperstone, reproduction or redistribution of this information isn’t permitted.