- English
The big US Treasury cash rebuild; volmageddon or a nothing burger?

We have no understanding of the timetable, but already the debate is whether the significant level of Treasury bill issuance will result in a major headwind for global financial markets, while others believe this is pure hype.
Some are contrasting what lies ahead as a massive liquidity withdrawal from financial markets – Quantitative Tightening (QT) on steroids – where we will essentially see USD liquidity sucked out of the system.
The process of raising cash levels
To raise and rebuild its now low cash balances, the US Treasury Department (UST) will look to issue around $1.3t of US T-bills over the following 12 months. Around $700b of this T-bill issuance will be fast-tracked, tapping up the market within a matter of months, with the private sector expected to buy what the Treasury is selling.
US Treasury bills (‘T-bills’) are high-quality debt instruments which have a maturity of less than 12 months.
With the US Treasury replenishing its cash balances it would be able to make ongoing payments and meet its obligations. Plus they will keep its additional capital on the Fed’s balance sheet (under the Treasury General Account or ‘TGA’) for future payments.
The effect on markets
The concern in the market is around the notion of a “liquidity drain” – whereby the UST remove such staggering levels of liquidity out of the system, in a short period, that we see bank funding costs heading markedly higher and USD rates rising to highly concerning levels. Could this dynamic cause renewed concerns in the US regional banks?
Drilling into the theme - the potential stress in markets really comes down to who exactly absorbs the issuance, as this is key in determining the potential impact on system liquidity.
A drawdown in RRP balances
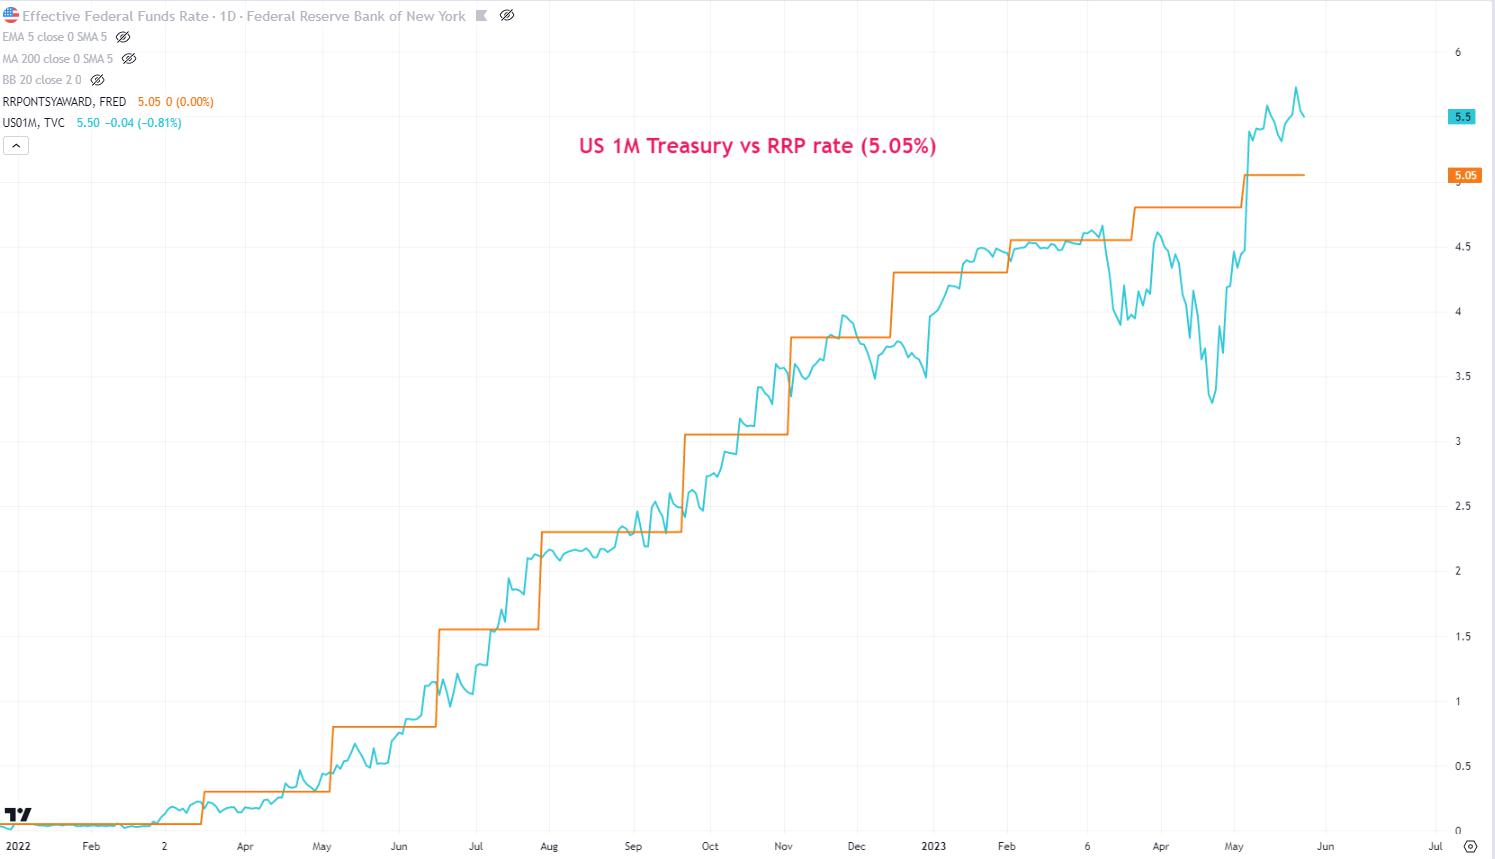
US money market funds (MMF) have historically been the big buyers of T-bill issuance and could again play a key role in supporting the USTs quest to recapitalize. Money funds currently have near-exclusive access to the Fed’s Reverse Repo facility or ‘RRP’ (TradingView code – RRPONTSYD), and have around $2.2t parked there, where they get 5.05% (annualized) risk-free.
If US T-bills are issued to the public at a yield close to the RRP rate (of 5.05%), then there’s a case that we see money funds withdrawing a sizeable level of holdings from the RRP facility and supporting the US T-bill issuance.
It is widely considered that risk assets (e.g. equities) would not be impacted when a large percentage of the USTs issuance is funded by RRP balances. In fact, some are saying this could be a net positive given there has been a scarcity of high-quality T-bills in the system of late.
A drain in bank reserves would be more problematic for markets
Banks are required to hold a level of reserves as a percentage of their deposit base. However, banks/depository institutions often hold reserves in excess of their regulatory requirements - this can be highly advantageous should they have to meet increasing deposit withdrawals.
Instead of keeping these excess reserves (cash equivalent) on their balance sheet, they can be offered to the Fed, where since 2008 they will receive interest paid at 5.15% (annualized) through the Fed’s IORB facility (Interest on Reserve Balances - TV code: WRBWFRBL).
The RRP and IORB spread guides overnight lending rates
With the RRP rate currently at 5.05% and IORB paid at 5.15% this spread represents the corridor by which the fed funds effective rate (EFFR) – the rate at which banks will borrow/lend cash overnight – trades. This is the fundamentals of how the Fed sets monetary policy and to date, it has been very effective.
The concern from some is where money funds have less involvement in supporting UST T-bill issuance - resulting in a comparatively low RRP drawdown – with a large percentage of the issuance supported by a drain of bank reserves.
Some strategists estimate that of this potential $700b in near-term T-bill issuance around $400b to $500b of this will be funded by the liquidation of bank reserves balances. That could the scenario where we could – in theory - see higher market volatility.
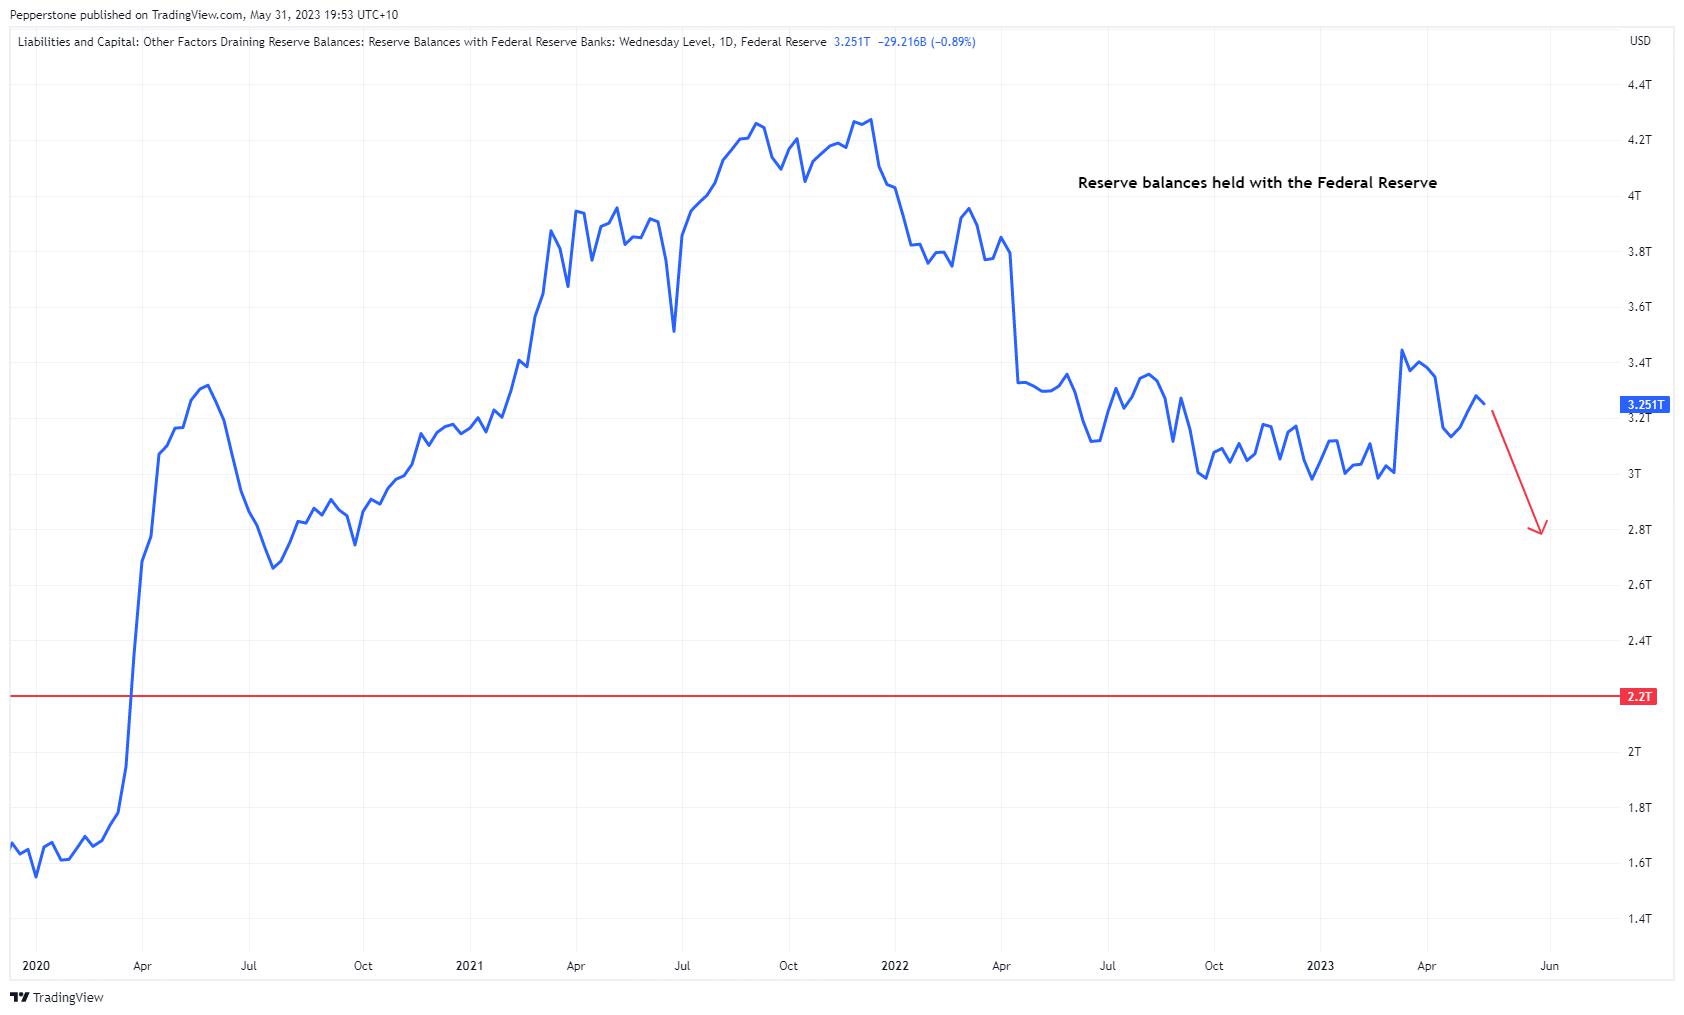
It’s really about a scarcity of reserves
There are currently $3.28t of excess bank reserves parked on the Fed’s balance sheet - so if we were to see a $500b drawdown in reserves then this balance would fall quite rapidly to around $2.8t. This is important because many feel the Lowest Comfortable Level of Reserve (LCLoR) that must be in the financial system is between $2.5t and $2.2t.
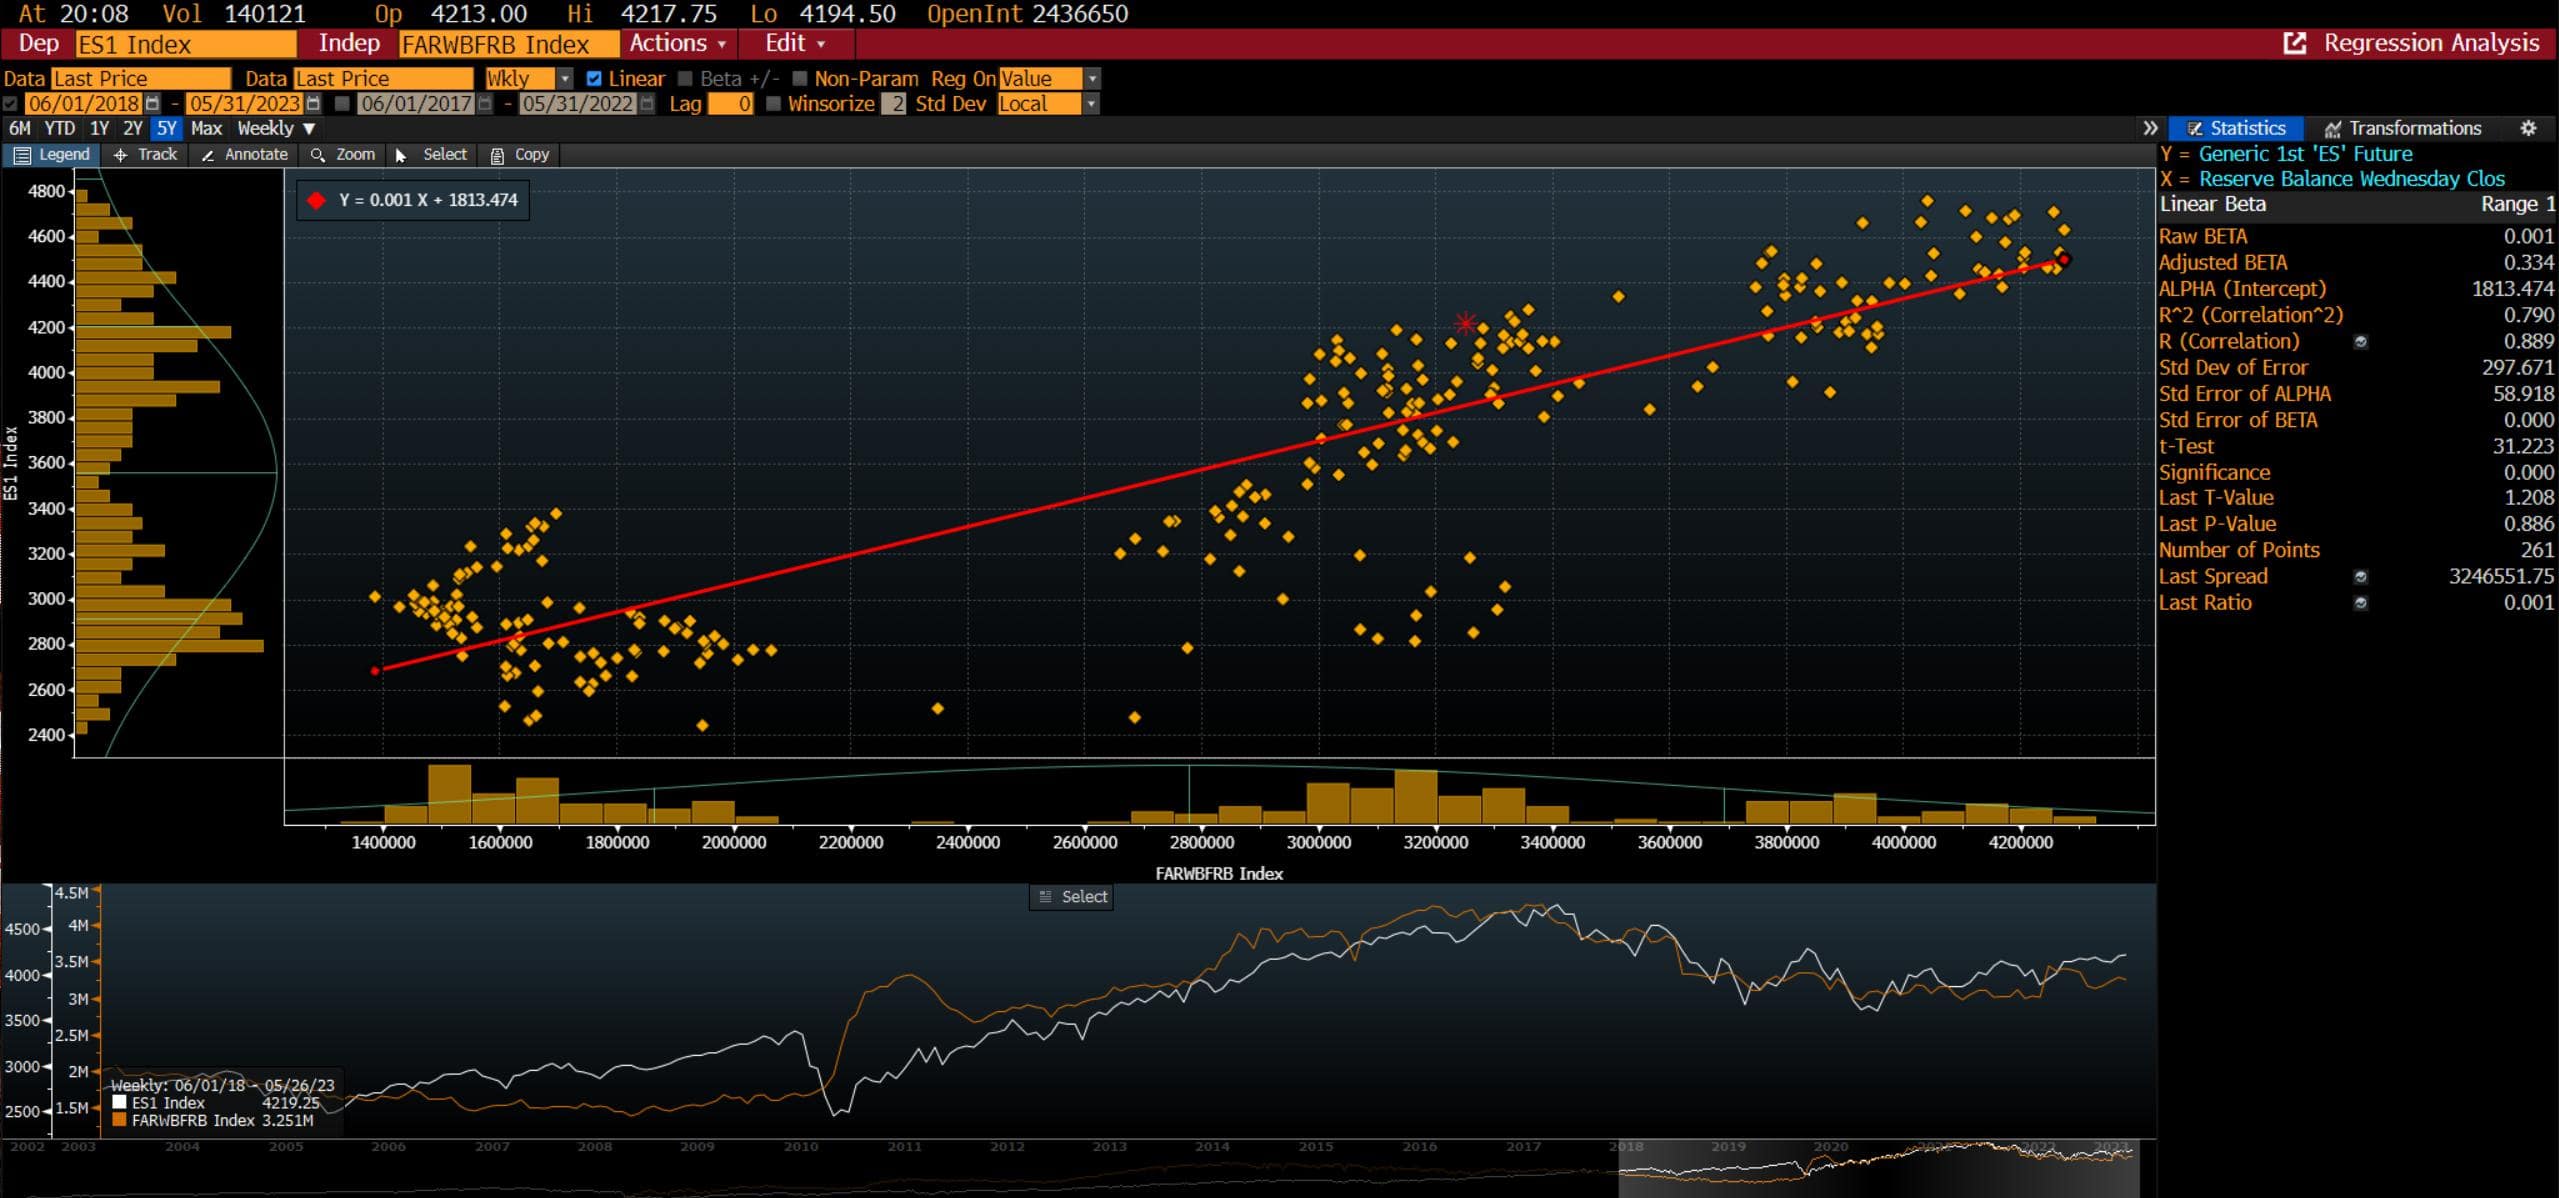
Interestingly, some feel an aggressive decline in reserves would be a headwind for risk assets – if we look at the regression between reserves and S&P500 futures, we can see an R^2 of 0.79. In effect, 79% of the variance in US equity futures can be explained by reserves – statistically, it’s very meaningful.
So this injects some credence to the idea that reserve drawdown could be a short-term headwind for risk. However, where this becomes interesting, and where we would see true stress in the system is through monitoring the spread between the Fed’s effective rate (TradingView Code: EFFR) and upper bound of the rates channel and Interest paid on Reserve Balances (on TradingView code: IORB).
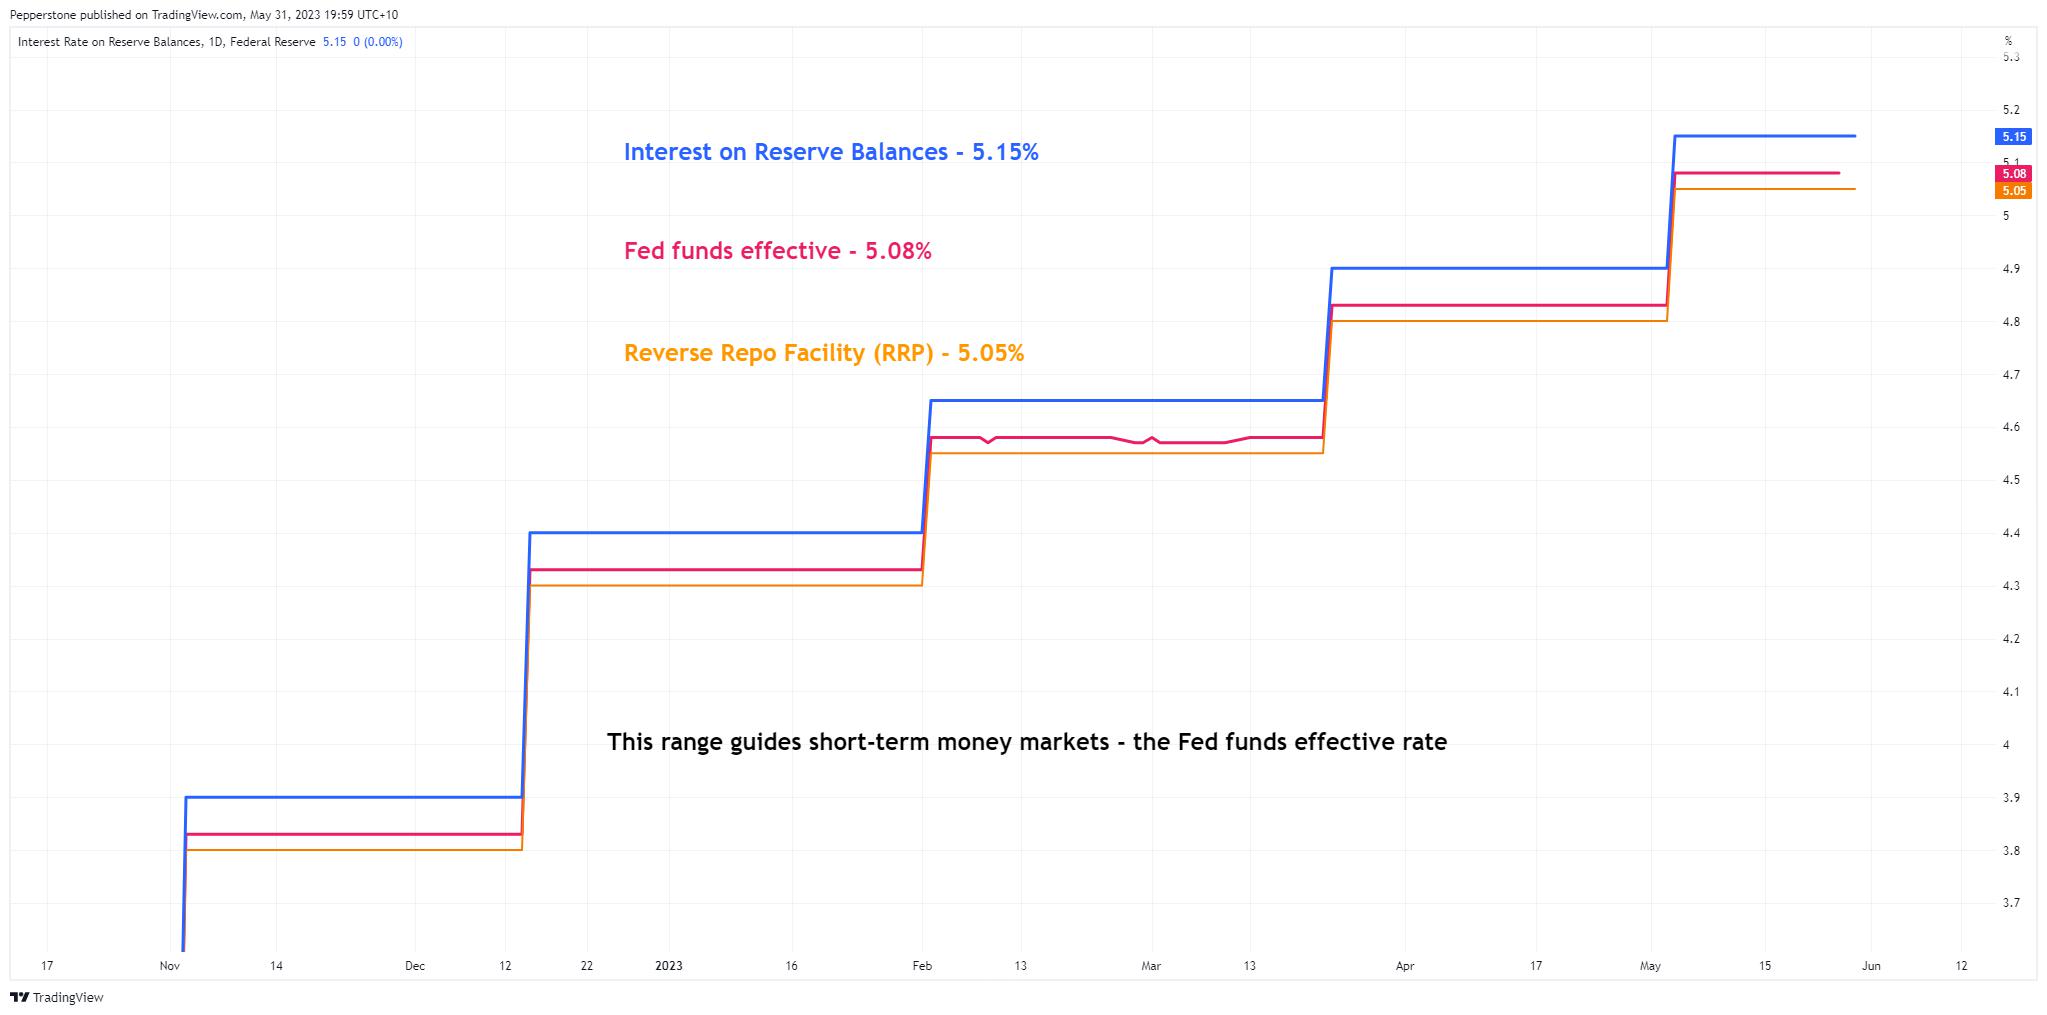
Currently, this spread sits at -7bp, but if we were to see the fed funds effective rate (EFFR) moving to the top of this corridor and even trading at a premium to IORB, it’s at this point where the market is telling us that we’re moving closer to a scarcity of reserves in the system.
This is where things would be far more prone to breaking, and the Fed will need to act swiftly.
When EFFR trades at a premium to IORB it essentially portrays that the money market channels are breaking and demand for short-term loans is becoming increasingly inelastic – subsequently, those in need of short-term loans will continue to pay ever higher prices.
Of course, this may not play out. We may see reserves falling precipitously and risk assets and the USD show no relationship at all to this dynamic. However, it is a risk, and we need to recognise the triggers and be open to the possibility it does cause a higher volatility regime, especially given it comes at a time when EU banks are having to pay back E500b of TLRO loans to the ECB.
Price is true, but I will be the moves in the KRE ETF (US regional bank ETF), as well as watching the EFFR- IORB spread as this could be far more important for the USD and signs of increased risks in the financial system.
The material provided here has not been prepared in accordance with legal requirements designed to promote the independence of investment research and as such is considered to be a marketing communication. Whilst it is not subject to any prohibition on dealing ahead of the dissemination of investment research we will not seek to take any advantage before providing it to our clients.
Pepperstone doesn’t represent that the material provided here is accurate, current or complete, and therefore shouldn’t be relied upon as such. The information, whether from a third party or not, isn’t to be considered as a recommendation; or an offer to buy or sell; or the solicitation of an offer to buy or sell any security, financial product or instrument; or to participate in any particular trading strategy. It does not take into account readers’ financial situation or investment objectives. We advise any readers of this content to seek their own advice. Without the approval of Pepperstone, reproduction or redistribution of this information isn’t permitted.