- English
Analysis

2019 will likely be remembered in the financial world as the year of the trade wars. With phase one of the trade deal now signed with China, the US economy is showing strong signs of growth, causing a surge in indices such as the S&P 500 and the Dow. On Friday 17 February, one of the more important news events of the month ‘Non-Farm Payrolls’ was released with the US economy adding 225,000 new jobs, far outpacing the 163,000 forecast. This news coupled with the trade deal and other strong numbers is giving traders an opportunity to revisit their charts and potentially identify new trading opportunities.
The relationship between the US Dollar and other currencies
The US Dollar index USDX is a measure of the value of the United States dollar relative to a basket of foreign currencies. The index will rise if the US strength or value is greater compared to other currencies and weaken if the value is less than other currencies.
The US Dollar index is made up of the following currencies:
- Euro (EUR), 57.6% weight
- Japanese yen (JPY) 13.6% weight
- Pound sterling (GBP), 11.9% weight
- Canadian dollar (CAD), 9.1% weight
- Swedish krona (SEK), 4.2% weight
- Swiss franc (CHF) 3.6% weight
The US Dollar index has long been regarded as a great instrument to carry out technical analysis studies to evaluate the strength or weakness of a currency. This analysis can then be used to help traders apply a bias on dollar strength and more specifically, compare it to the EURUSD, where the Euro makes up approximately 57.6% of the index weight. If a pattern or trend is presenting on the USDX, traders can generally assume that the EURUSD will have an inverse reaction. As an example, if the US dollar is strengthening, the EURUSD will most likely be weakening. This cross analysis is specifically beneficial when looking at long-term timeframes and patterns.
USDX inverse head and shoulders pattern
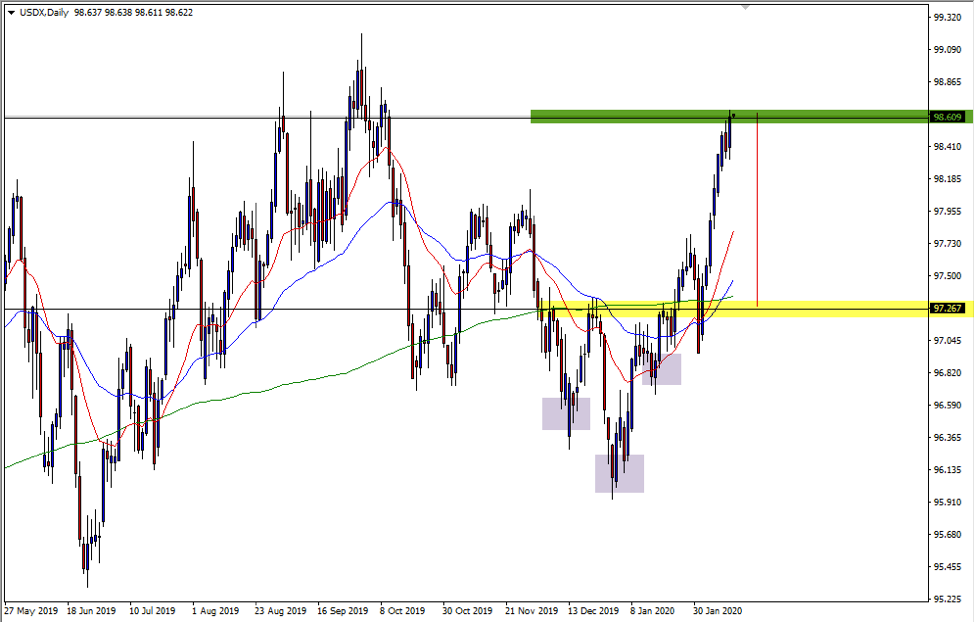
Even before the strong 17 February Non-Farm Payroll result, we saw a strong pattern on the USDX. This is a great example of an inverse Head & Shoulders pattern where the right shoulder is higher than the left, indicating bullish momentum. Another nice technical in this trade was where the USDX broke past the neckline (the yellow highlighted area). You can see that price broke the 200 Daily SMA soon after. This was followed by a cross of the 20 (EMA) and 50 (EMA) in the direction of the trade, providing a volatile but sound role reversal opportunity to enter the trade long after the break in the 97.26 zone.
EURUSD head and shoulders pattern
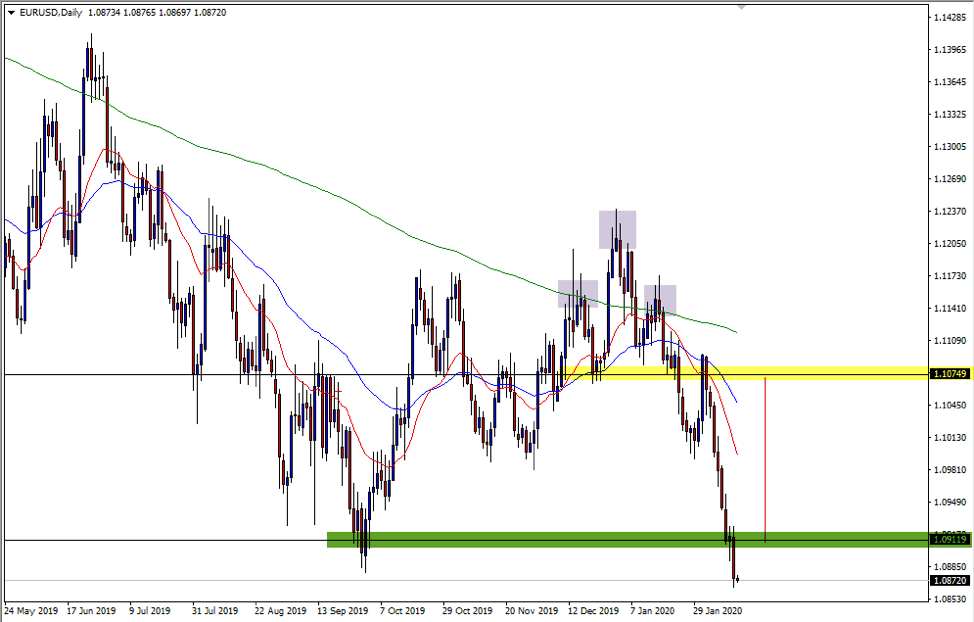
As mentioned earlier, what happens on the USDX generally occurs inversely on the EURUSD. Above you can see another head and shoulders pattern with a break of the neckline (the yellow highlighted area), followed by a cross of the 20 (EMA) and 50 (EMA), creating another role reversal opportunity to enter the trade short at the 1.1080 zone.
The risks to China’s GDP and economic outlook
The recent outbreak of the Coronavirus in the Hubei province has shaken the worlds’ markets, and all eyes are now on China’s management of the situation with millions of people flocking to cancel their planned holidays. From an economic standpoint this couldn’t have happened at a worse time for China. With an already slowing economy due to the trade wars and the potential need for further stimulus from the CCP, China’s GDP figures are under a real threat and volatility is increasing.
Trading Asia during an unexpected event, the CN50 index daily support
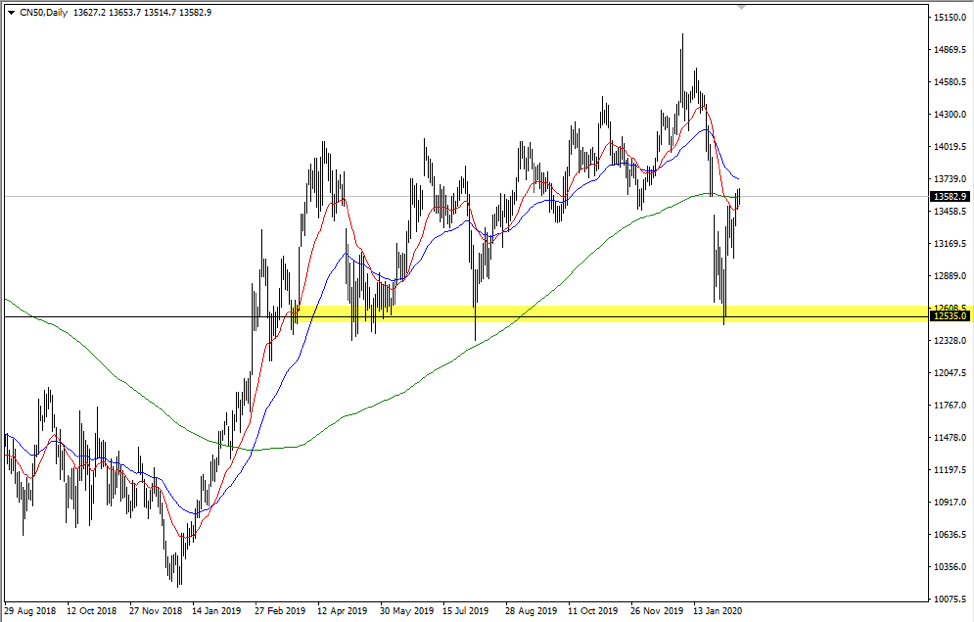
The fallout from news of the Coronavirus was sharp and fast on the CN50 index, but as the yellow highlighted area on the chart above shows, a key level that has acted as support several times in the past is again propping up the price.
The CN50 index divergence on the 4hr time frame
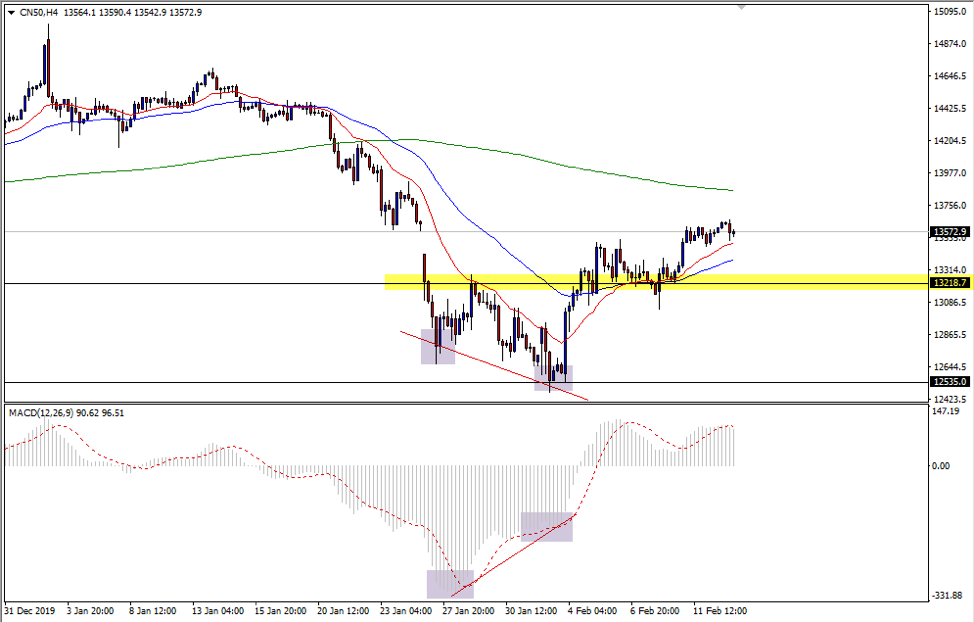
The chart above shows a new lower low being formed by price into the daily 12500 support level. Meanwhile, the MACD indicates a weakening signal, with the new lower low formed by price not being replicated by a lower MACD level. This chart action demonstrates Class A bullish divergence. The break above the yellow highlighted zone confirms further bullish momentum, indicating that the initial selling of the market may now be over.
Trading fundamental news with technical analysis correlation
The practice of cross correlation like the above USDX and EURUSD examples are important tools in any technical analysis traders’ arsenal. Similarly, when unexpected news events occur, it is important to look at the key levels and wait for confirmation before making any trading decisions. The analogy ‘never try and catch a falling knife’ is certainly a mantra that might be worth considering on the next news event.
Ready to trade?
It's quick and easy to get started. Apply in minutes with our simple application process.
The material provided here has not been prepared in accordance with legal requirements designed to promote the independence of investment research and as such is considered to be a marketing communication. Whilst it is not subject to any prohibition on dealing ahead of the dissemination of investment research we will not seek to take any advantage before providing it to our clients.
Pepperstone doesn’t represent that the material provided here is accurate, current or complete, and therefore shouldn’t be relied upon as such. The information, whether from a third party or not, isn’t to be considered as a recommendation; or an offer to buy or sell; or the solicitation of an offer to buy or sell any security, financial product or instrument; or to participate in any particular trading strategy. It does not take into account readers’ financial situation or investment objectives. We advise any readers of this content to seek their own advice. Without the approval of Pepperstone, reproduction or redistribution of this information isn’t permitted.