Trading and understanding the US Volatility Index with Pepperstone
Volatility is one of the most essential inputs in trading – it affects how much risk we take in a position, arguably the core element of any trading system. Volatility (vol) should be the key determinant of position size for each trade, but also our emotional state, where higher vol regimes can see traders lose discipline, act recklessly and often overtrade the account.
But how should we view and measure volatility?
Volatility can be split into ‘realised’ and ‘implied’ volatility.
Realised volatility (vol) is a statistical measure of how far prices move (on each bar) away from the average of a set period – the 20-day average is commonly used here. The further, or more dispersed prices move away from the average, the higher the measured volatility (vol).
Importantly, the greater the vol, the wider the stop loss should be on the trade. As a consequence of taking on more risk, a trader could reduce the position size and/or leverage rate, and vice versa.
The majority of volatility indicators used by traders are based on realised volatility and are determined by past price moves – some of the most popular volatility measures include Bollinger Bands, ATR (Average True Range), Keltner Bands, standard deviation, and even pivot points.
We can loosely argue that because most market players are making bets on future movement, that the moves in price are anticipatory and therefore contain some element of forward-looking information. However, these moves are not a direct expression of future or implied volatility – that is where the US Volatility Index can be a useful measure of expected equity volatility and can be activity traded by Pepperstone clients.
While it is not an exact science, given the composition of the options expiries involved, as we highlight in this article - https://pepperstone.com/en-au/trading/instruments/vix/ - by dividing the current US Volatility index by 15.9 we can understand the expected daily moves (higher or lower) in the US500 over the coming 30 days. This calculation typically overstates where US equity volatility realises, but it is a good guide on market expectations around movement and traders can therefore trade the US volatility index based on whether or not they agree with this implied move.
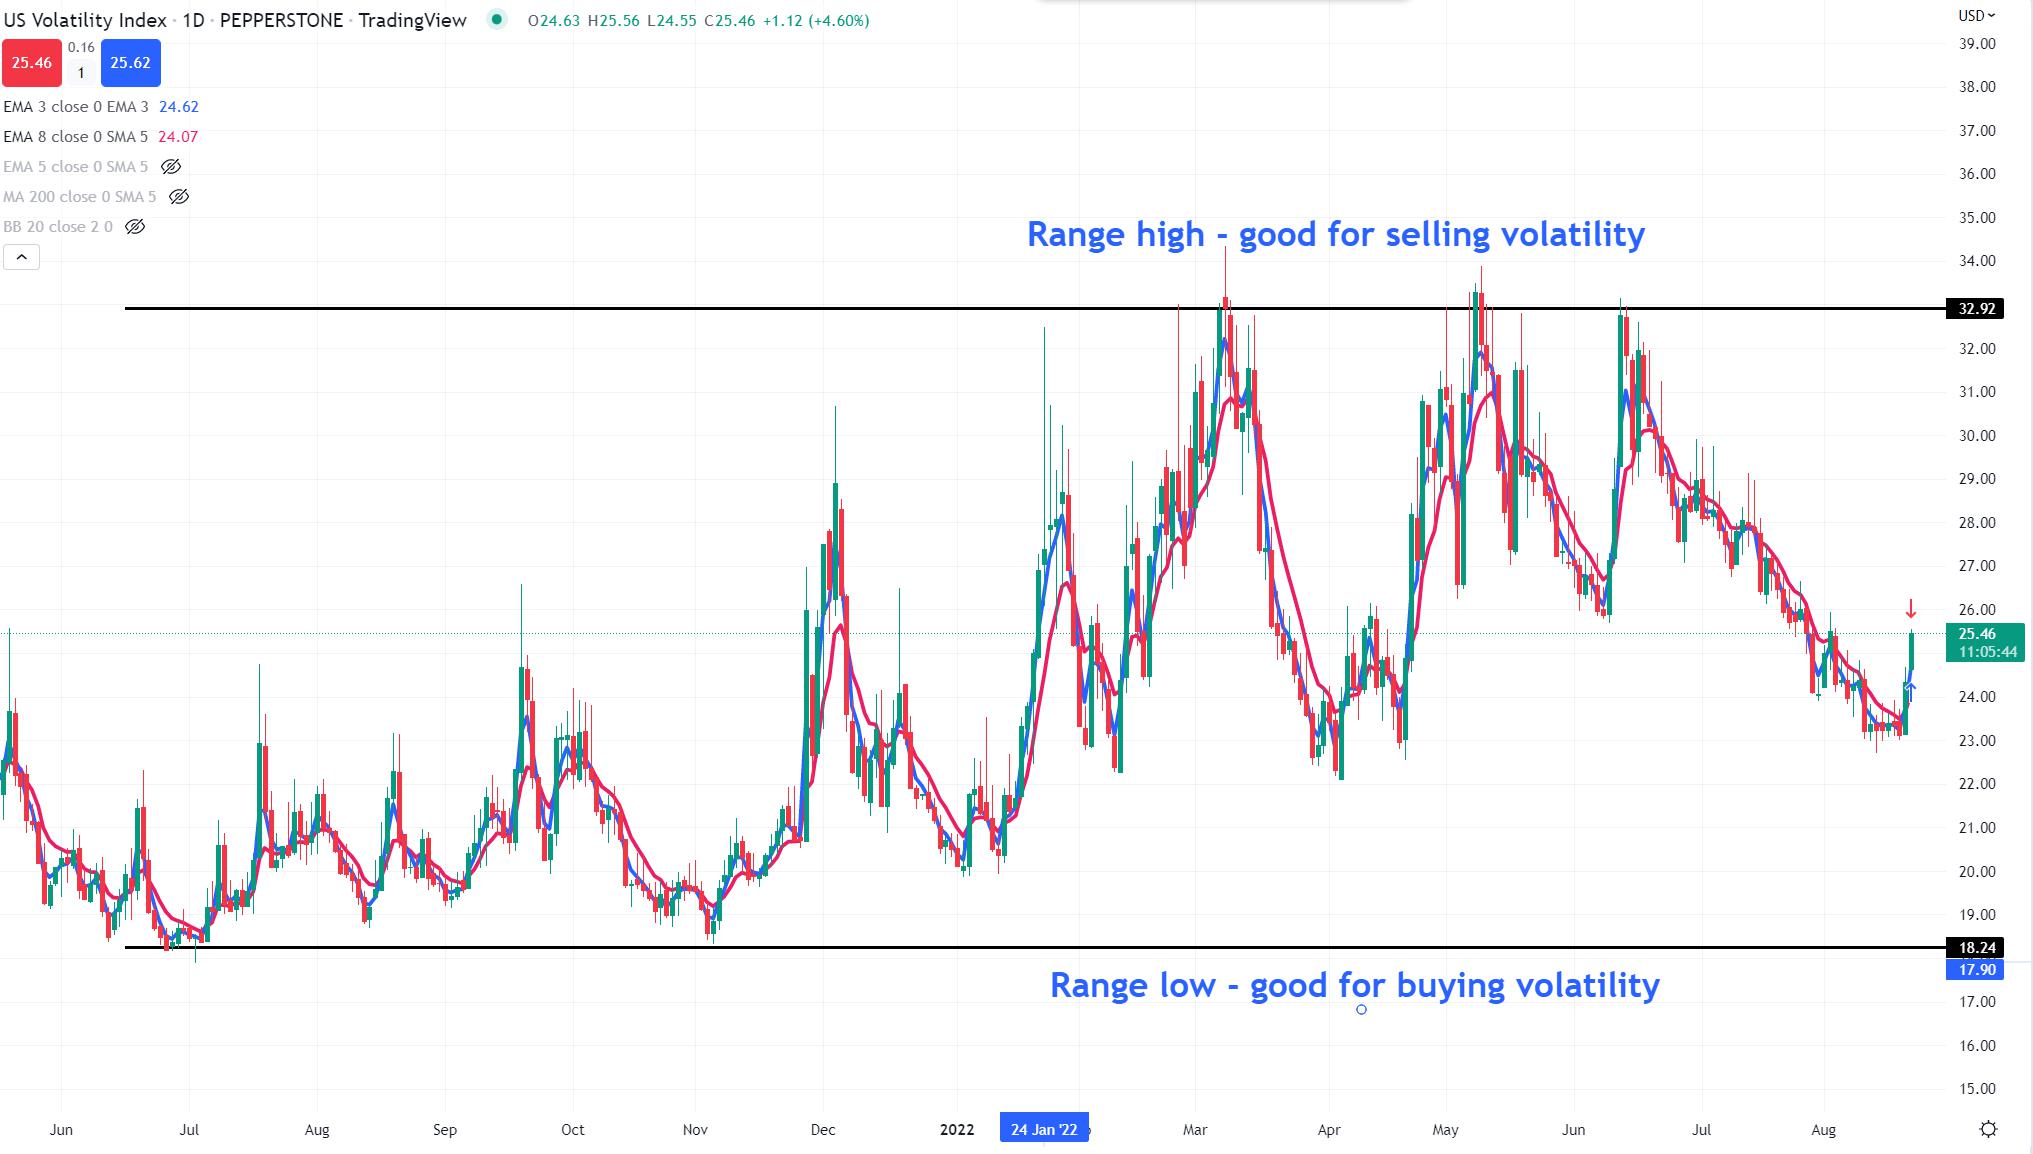
(US volatility index – daily chart)
What is the US volatility index?
The CBoe volatility index (VIX index) incorporates the price of various S&P500 options, which have between 23 and 37 days to expiry – these are weighted to create a blended maturity of 30 days. The demand for options is a function of whether traders feel the instrument will move above the strike price by the expiration date – the higher the probability of the S&P500 moving ‘in-the-money’, the greater the demand and subsequently the higher the price of the option - it’s here where we see the US Volatility index rising.
Importantly, the US Volatility index is expressed, quoted and traded in percentage terms as an annualised standard deviation number – this makes it unique in that you’re trading a parentage number and not an index level per se.
How is the US volatility index priced?
As is the case with most spot prices, the VIX index is a valuation of the options used in the calculation – you can’t directly trade the underlying VIX index and for that, we turn to the VIX futures – it’s the VIX futures where the US Volatility index takes its price.
The US volatility index is set off a calendar-weighted blend between the front- and second-month VIX futures contracts. In essence, as we get closer to the expiration of the front-month futures contract the US volatility index will take increased influence from the price of the second-month contract – this allows for an efficient continuous rolling position for clients to trade.
Example:
Today is the 18 August 2022.
Front month VIX September futures (expiry date of 21 September) = 24.5%
Second-month VIX October futures (expiry date of 19 October) = 26.2%
For simplicity’s sake let us say today is the 18 August, the day after the VIX August 2022 futures expiry. There is just under a full month to the expiration of the VIX September futures contract, and therefore very little influence from the October futures contract. As such, we see the US Volatility index trading at 24.8%.
However, as each day passes, and we approach the VIX September futures expiry (on the 21 Sept), the US Volatility index will edge closer to the VIX October futures price.
If today was the 20 September (the day before the September VIX futures expiration), the US volatility index would be almost fully aligned with the October VIX futures price and trading closer to 26.2%.
How to trade the US volatility index?
Pepperstone tries to make position sizing simple for traders and so 1 lot of US volatility index equates to a $1 per point move in the index. Importantly,we price the move off the number before the decimal point.
For example – I buy 100 lots of the US Volatility index at 24.80% (the quote was 24.64 - 24.80) – on that day, the bid price goes up to 25.80% - my profit is, therefore, $100. Given an outsized daily move in the US volatility index is around 4 points (or ‘4 volatilities’), we need to consider this in our lot sizing and traders will typically trade a far higher lot size than they would in say in EURUSD or NAS100.
If a trader believes there will be increased movement in the US equity market – and notably moves lower in the US500 – believing market participants will increase their demand for portfolio hedges and paying higher prices for S&P index options - then being long the US Volatility index would be a position to consider.
Consider that typically the further out you go in the futures contract the higher the level – this is normal in the VIX futures, and represents holding costs – the ‘steepness’ in the futures curve represent the cost of carry and its why.
*Clients pay swaps on long positions held past the rollover point.
If a trader felt implied levels of equity market volatility were going lower – perhaps the US Volatility index is at the top of its multi-month range and there could be an event that holds a high probability of reducing market anxiety (and volatility) – perhaps actions from a central bank, increased corporate buy-backs or a better corporate earnings season, then being short volatility may be a position to take.
*Clients receive swaps on short positions held past the rollover point.
Trade the US Volatility index with Pepperstone
Simplistically, a rising equity market is synonymous with a falling US volatility index, as traders sell volatility which reduces the price of S&P options. Anticipation of a move lower in the US500 should see demand for the US volitivity index rise, which lifts the US volatility index. Some traders will simply use the index as a guide on the current risk regime – if the US volatility index is above 30%, they may want to lower position size, reduce leverage and even cut their hold times so they only hold positions when in front of the screens.
What’s your position?