What are stop-loss & take-profit orders and how do you set them up?
Discover how stop-loss and take-profit orders can help you manage risk and set goals in trading. These essential tools enable you to automate the buying and selling of assets at predetermined prices, saving you time and helping you stay disciplined.
Introduction
When it comes to trading the financial markets, managing risk is crucial. Let’s face it—no one likes losing money. That’s where stop-loss and take-profit orders come in handy. These are two powerful tools that can help you protect your investments, maximise your potential gains, and ultimately take control of your trading experience.
Imagine not having to watch every price movement because your trades are automatically closed at specific levels. That’s exactly what stop-loss and take-profit orders do—they help you maintain discipline, minimise losses, and secure profits.
This guide will walk you through what these orders are, their pros and cons, and how to use them effectively as part of your overall trading strategy—whether you’re trading on a popular platform like Pepperstone or elsewhere.
Understanding stop-loss orders
A stop-loss order is like a safety net for your trade. It’s a preset instruction that tells your trading platform to close a trade if the market moves against you and reaches a specific current price level. By setting this threshold, you can limit how much you’re willing to lose on a trade—helping you avoid those gut-wrenching moments when the market isn’t in your favour. This threshold is based on the current market price at the time of placing the stop-loss order.

Example 1: Let’s say you’re trading the EUR/USD pair on Pepperstone, and you decide to buy at 1.2000. You’re willing to risk 50 pips, so you set your stop-loss at 1.1950. If the price drops to 1.1950, your trade is automatically closed, and you limit your loss to 50 pips. This way, you avoid the temptation of holding on to a losing position in the hope that things will turn around.
Example 2: Imagine you’re trading GBP/USD on the Pepperstone platform and think the price will go down, so you enter a short position at 1.3100. To protect yourself, you set a stop-loss order at 1.3150. If the market moves against you and reaches 1.3150, the trade is closed, and you contain your losses to 50 pips. This is especially useful in a volatile market where prices can change dramatically in a short time.
Understanding take-profit orders
A take-profit order is like setting a goal for your trade. It’s an instruction to close a trade when the market reaches a level that secures the profit you’re aiming for, based on the current price. The current market price is key to determining the take-profit point because it allows you to predict where the market may head and lock in gains.This is great for when you have a clear profit target in mind and want to make sure you lock it in without constantly watching the market.
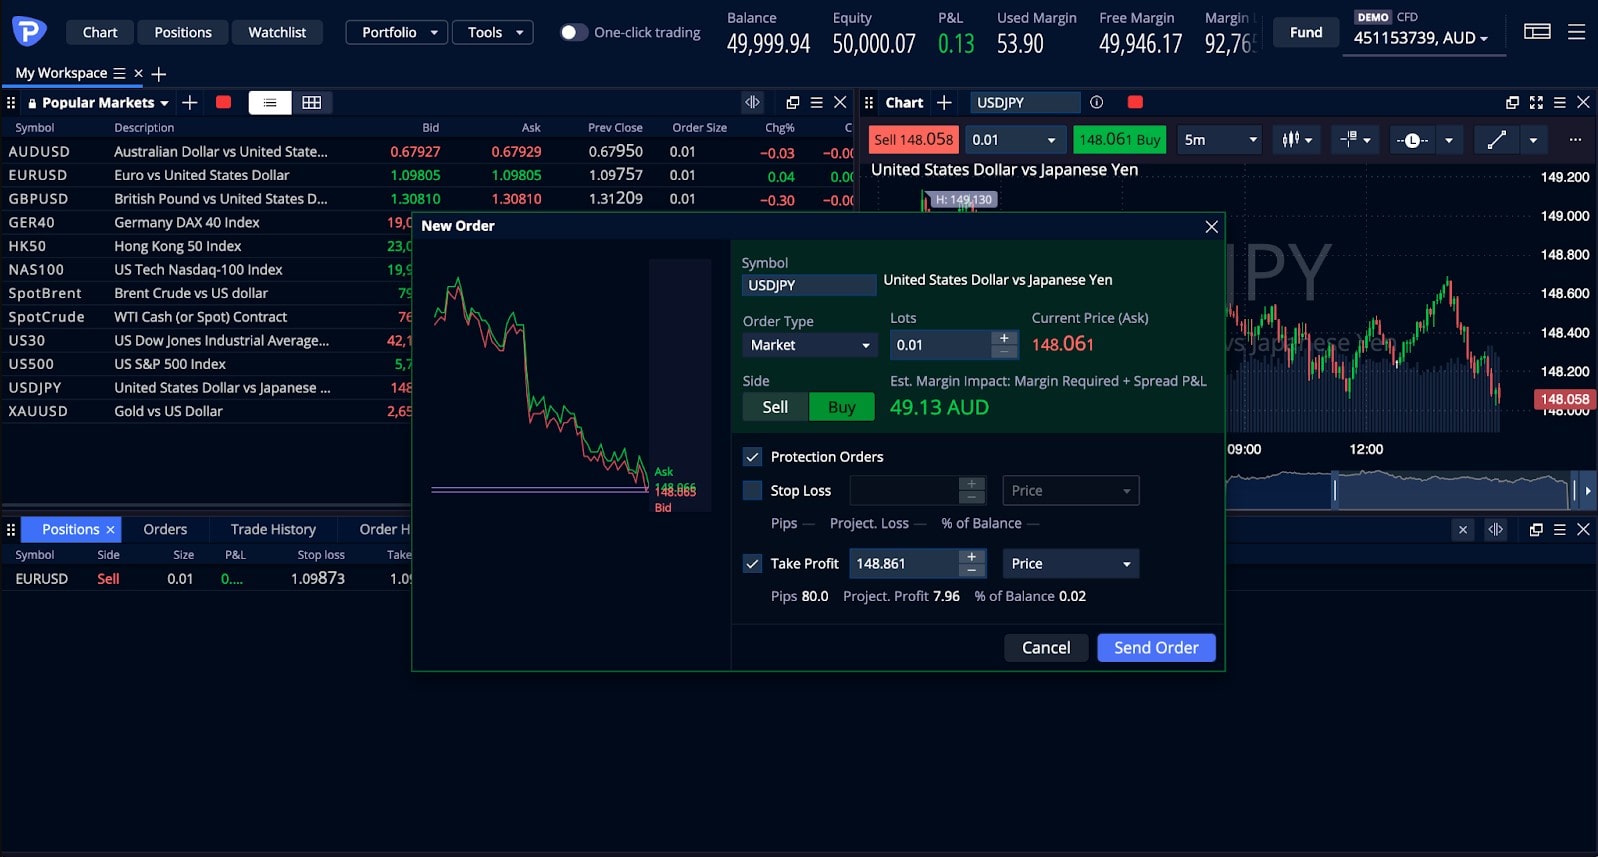
Example 1: Suppose you buy USD/JPY at 110.00 through Pepperstone, and you’re targeting a profit of 80 pips. You set your take-profit order at 110.80. If the market moves in your favour and hits that level, the order will be executed automatically, and you’ll secure your profit. This prevents you from getting greedy and holding out for more—only to see the market reverse and wipe out your gains.
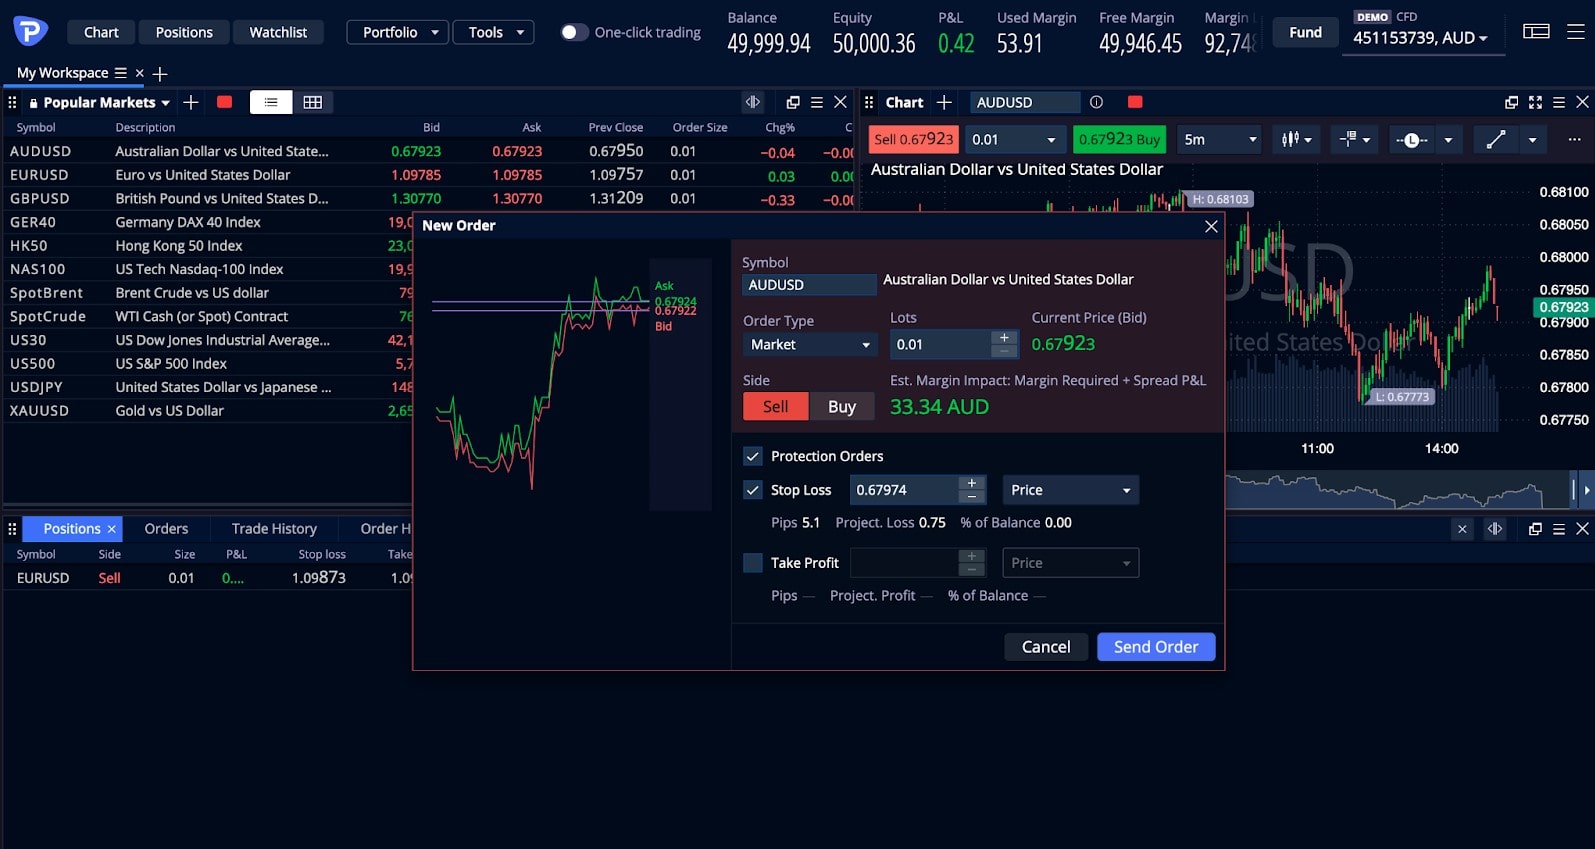
Example 2: Let’s say you’re trading AUD/USD on Pepperstone and enter a trade at 0.7500, with a target of 0.7550. You place a take-profit order at 0.7550, and when the market moves to that level, your trade is closed, and you book a 50-pip profit. This helps you take profits off the table without needing to be glued to your screen.
Advantages and disadvantages of stop-loss orders
Advantages:
- Minimise Losses: The biggest advantage of a stop-loss order is that it limits how much you can lose. If things aren’t going your way, it helps you exit the trade before losses get out of hand.
- Automation: You don’t need to constantly watch the market. Once you set a stop-loss order on a platform like Pepperstone, it works on autopilot—saving you time and reducing stress.
- Discipline: Emotions can often get in the way of making good trading decisions. Stop-loss orders enforce discipline by automatically exiting trades, which helps remove emotion from the equation.
Disadvantages:
- Market Fluctuations: Sometimes, a stop-loss order can be triggered by short-term price fluctuations, even if the market eventually moves back in your favour. This is known as getting “stopped out” too soon.
- Slippage: In fast-moving markets, there’s a chance that the stop-loss order won’t be executed at the exact level you set, especially during major news events. This means you could end up losing slightly more than you planned.
Advantages and disadvantages of take-profit orders
Advantages:
- Lock in Profits: A take-profit order allows you to automatically close trades in the green, without having to sit in front of your screen all day.
- Prevents Greed: Greed can be a trader’s worst enemy. Take-profit orders prevent you from holding on to a trade for too long, helping you lock in your gains before the market changes direction.
- Efficient Use of Time: Once you set a take-profit order on your Pepperstone platform, you can focus on other opportunities instead of worrying about when to exit your trade.
Disadvantages:
- Limited Upside Potential: If the market keeps moving in your favour after hitting your take-profit level, you’ll miss out on additional gains. This is the trade-off of securing your profit at a fixed level.
- Over-Dependence: Relying solely on take-profit orders might make you less flexible. Markets can change quickly, and sometimes it’s better to adjust your profit targets as conditions evolve.
How to Determine Your Stop-Loss and Take-Profit Levels
Setting the right stop-loss and take-profit levels depends on a few factors, including how much risk you’re comfortable with, your trading strategy, and the market conditions.
- Risk tolerance: The first step is to decide how much you’re willing to lose. Many traders use a percentage of their total capital—like 1% or 2%—as a guide. For example, if you have $10,000 in your trading account, you might decide not to risk more than $100 on a single trade. This means setting your stop-loss at a level that equals a potential $100 loss.
- Technical analysis: Support and resistance levels are great tools to help you set your stop-loss and take-profit levels. For instance, if you’re buying, you might place your stop-loss just below a support level to minimise risk. On the flip side, you could place a take-profit order near a resistance level to lock in gains before a potential reversal. For example, if EUR/USD is trading between 1.1000 (support) and 1.1200 (resistance), you might enter at 1.1050, set your take-profit at 1.1200, and your stop-loss at 1.0950.
- Volatility: The more volatile the market, the wider your stop-loss and take-profit levels may need to be. For example, in a calm market, you might use a 30-pip stop-loss and a 60-pip take-profit. In a highly volatile market, those levels might be expanded to 80 pips and 160 pips to account for larger price swings.
In this chart below, the green arrow represents a stop-loss order, which is set at 1.09656. This stop-loss is placed just below the support level of 1.09710, ensuring that if the price drops significantly, the trade will automatically close to minimise losses. The stop-loss acts as a safety net, protecting the trader from a larger downward move if the price moves against the trade.
On the other hand, the take-profit level, marked by the red arrow, is typically placed near a resistance level. For example, a take-profit could be set around 1.09951, which are key resistance levels where the price is expected to reverse. If the price reaches one of these levels, the trade will automatically close, locking in the profit.
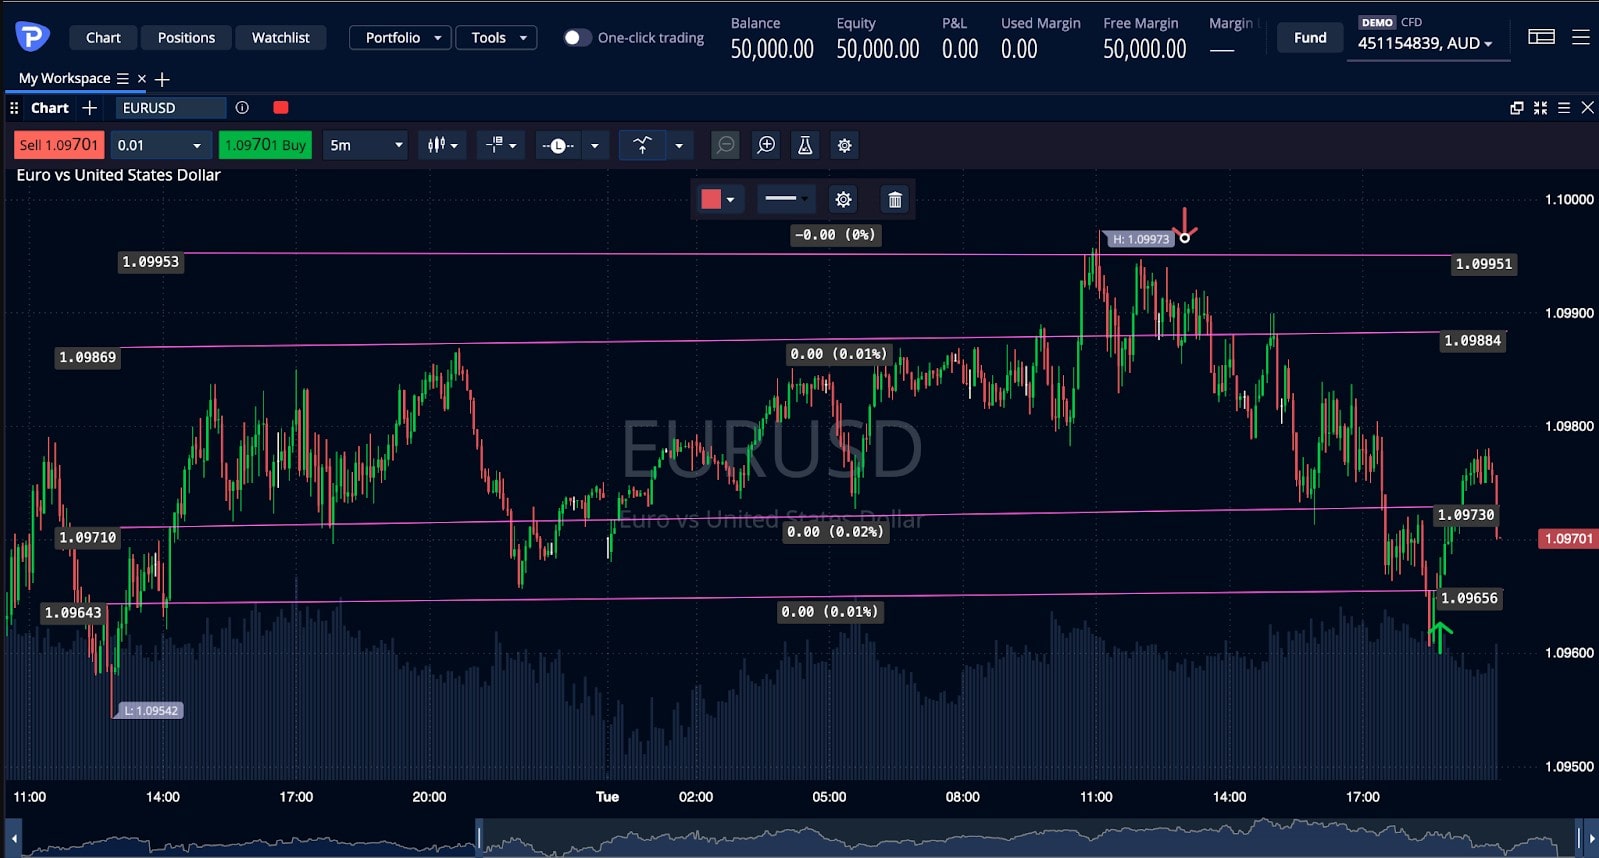
In summary, the stop-loss limits potential losses by closing the trade if the price moves down, while the take-profit locks in gains by closing the trade at a higher, pre-defined price level.
Setting stop-loss and take-profit orders
It's quite straightforward to set stop-loss and take-profit orders on most trading platforms, including at Pepperstone:
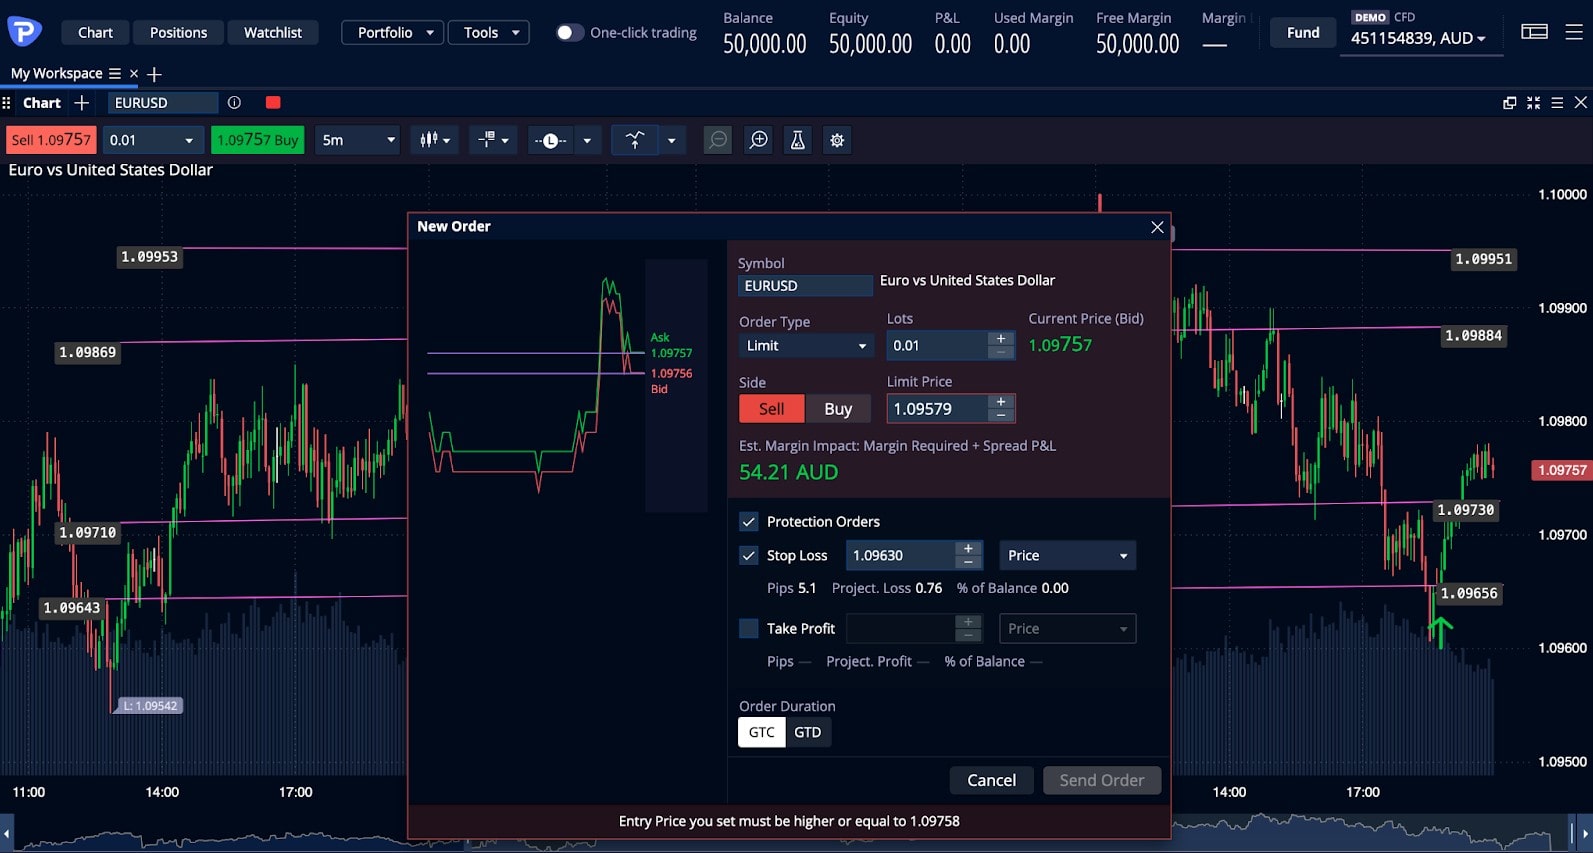
- Open the Trade: Start by opening a new trade on your platform. Let’s say you’re buying EUR/USD.
- Locate the Stop-Loss/Take-Profit Fields: In the order entry window, you’ll see fields for stop-loss and limit price levels—these are optional but recommended.
- Enter Your Price Levels: Set your desired stop-loss and take-profit levels. For example, if you buy at 1.2000, you might set your stop-loss at 1.1900 and your take-profit at 1.2200.
- Confirm the Order: Once everything looks good, confirm the order. You can then see these levels marked on your trading chart, making it easier to track your potential risk and reward.
Advanced order types
Some trading platforms offer advanced order types, like trailing stop-loss orders. A trailing stop automatically adjusts as the market moves in your favour, helping you potentially take gains off the table, while still protecting your downside.
Example: Suppose you buy EUR/USD at 1.2000 and set a trailing stop of 50 pips. If the price moves up to 1.2100, your trailing stop will move up to 1.2050, locking in at least 50 pips of profit. If the market then drops to 1.2050, the trade will close, and you’ll have secured your gains.
Trailing stops are particularly handy in trending markets, where prices are likely to move consistently in one direction.
Risk management techniques
Stop-loss and take-profit orders are essential parts of a good risk management plan. One popular strategy is the risk/reward ratio, which identifies the potential profit from the trade compared to the potential risk.
Example: Let’s say you’re willing to risk 50 pips on a trade and aim for a profit of 100 pips. This gives you a risk/reward ratio of 1:2, meaning the potential reward is twice the potential risk. If you stick to a good risk/reward ratio, even if only half your trades are successful, you could still come out ahead.
FAQ
What is the purpose of stop-loss and take-profit orders in trading?
These orders are used to automatically close trades at predetermined price levels, helping you manage risk and lock in profits without needing to watch the market all the time.
How does a stop-loss order protect traders from losses?
A stop-loss order protects you by automatically closing a trade when the market moves unfavourably to a specified level, limiting the potential loss.
What factors should traders consider when setting their stop-loss and take-profit levels?
You should consider your risk tolerance, key support and resistance levels, and the current market volatility.
Can stop-loss and take-profit orders be modified after they are placed?
Yes, most platforms, including Pepperstone, allow you to modify these orders even after they’ve been placed. This is useful if market conditions change.
How do stop-loss and take-profit orders differ in terms of execution during high market volatility?
During high volatility, both stop-loss and take-profit orders might experience slippage, meaning they could be executed at a slightly different price than the one you set.
Conclusion
Stop-loss and take-profit orders are essential tools for any trader who wants to manage risk and stay disciplined. By understanding how these orders work, their pros and cons, and how to set appropriate levels, you can protect your capital and enhance your trading performance. Remember, while these tools can help you stay on track, flexibility is key—markets can change rapidly, and being prepared to adapt is crucial.
The material provided here has not been prepared in accordance with legal requirements designed to promote the independence of investment research and as such is considered to be a marketing communication. Whilst it is not subject to any prohibition on dealing ahead of the dissemination of investment research we will not seek to take any advantage before providing it to our clients.
Pepperstone doesn’t represent that the material provided here is accurate, current or complete, and therefore shouldn’t be relied upon as such. The information, whether from a third party or not, isn’t to be considered as a recommendation; or an offer to buy or sell; or the solicitation of an offer to buy or sell any security, financial product or instrument; or to participate in any particular trading strategy. It does not take into account readers’ financial situation or investment objectives. We advise any readers of this content to seek their own advice. Without the approval of Pepperstone, reproduction or redistribution of this information isn’t permitted.