- English
Gold Near Historic Highs: What’s Next?
Positive Factors for Gold in 2024
The positive trend in gold this year has been fueled by several key aspects. First, geopolitical tensions, particularly war-related conflicts shaking the international stage, have played a decisive role. The ongoing conflict in Ukraine and recent events in the Middle East, such as hostilities between Israel and Gaza, as well as tensions with Iran, have increased demand for safe-haven assets. These events have acted as catalysts for gold prices, which tend to rise in times of heightened uncertainty.
Additionally, physical demand for gold from central banks reached record levels in the first half of 2024. This demand reflects efforts by countries like Russia and China to diversify their reserves away from the U.S. dollar. Although this demand has moderated in recent months due to rising gold prices, it remains a positive factor for the metal.
Lastly, the start of monetary policy normalisation by major central banks has played a crucial role. Expectations for aggressive rate cuts by the Federal Reserve have recently been tempered as U.S. economic data shows solid performance. However, the prospect of a less restrictive monetary policy, combined with most global central banks already cutting interest rates, has supported gold’s upside potential, leaving the question: How far can gold prices go?
Could Gold Reach $3,000?
In the markets, we are starting to hear comments suggesting that gold could reach $3,000 per ounce in the “relatively near future.” However, I personally believe that breaking $2,700 sustainably will be more challenging than some investors and traders expect in the medium term. External factors, such as Donald Trump’s possible return to the White House, could significantly influence gold’s behaviour.
A victory for the former president, who has been rising in the polls, could trigger an initial positive reaction for gold due to the uncertainty his volatile leadership could generate in the global economy. However, his profile and policies, focused on imposing tariffs and mass deportations, could increase inflationary pressures. Tariffs would raise import costs, while deportations could drive up labor costs in the U.S., two factors likely to favour inflationary dynamics, which could limit the impact of further rate normalisation and strengthen the U.S. dollar—both factors that do not favour gold.
Additionally, if Trump fulfils some of his campaign promises, such as ending geopolitical conflicts, it could neutralise one of the main drivers of gold’s rise in 2024: global uncertainty. This development could reduce gold’s appeal as a safe-haven asset, limiting its growth potential.
Long-Term Outlook
Despite these factors, I do not foresee a radical drop in gold prices. The global economic environment remains uncertain, and central bank demand for gold will likely continue in the coming years as they seek to diversify their international reserves. Furthermore, the growing U.S. debt may eventually become a longer-term support factor for gold.
Gold Price Technical Analysis
Monthly Chart XAU/USD
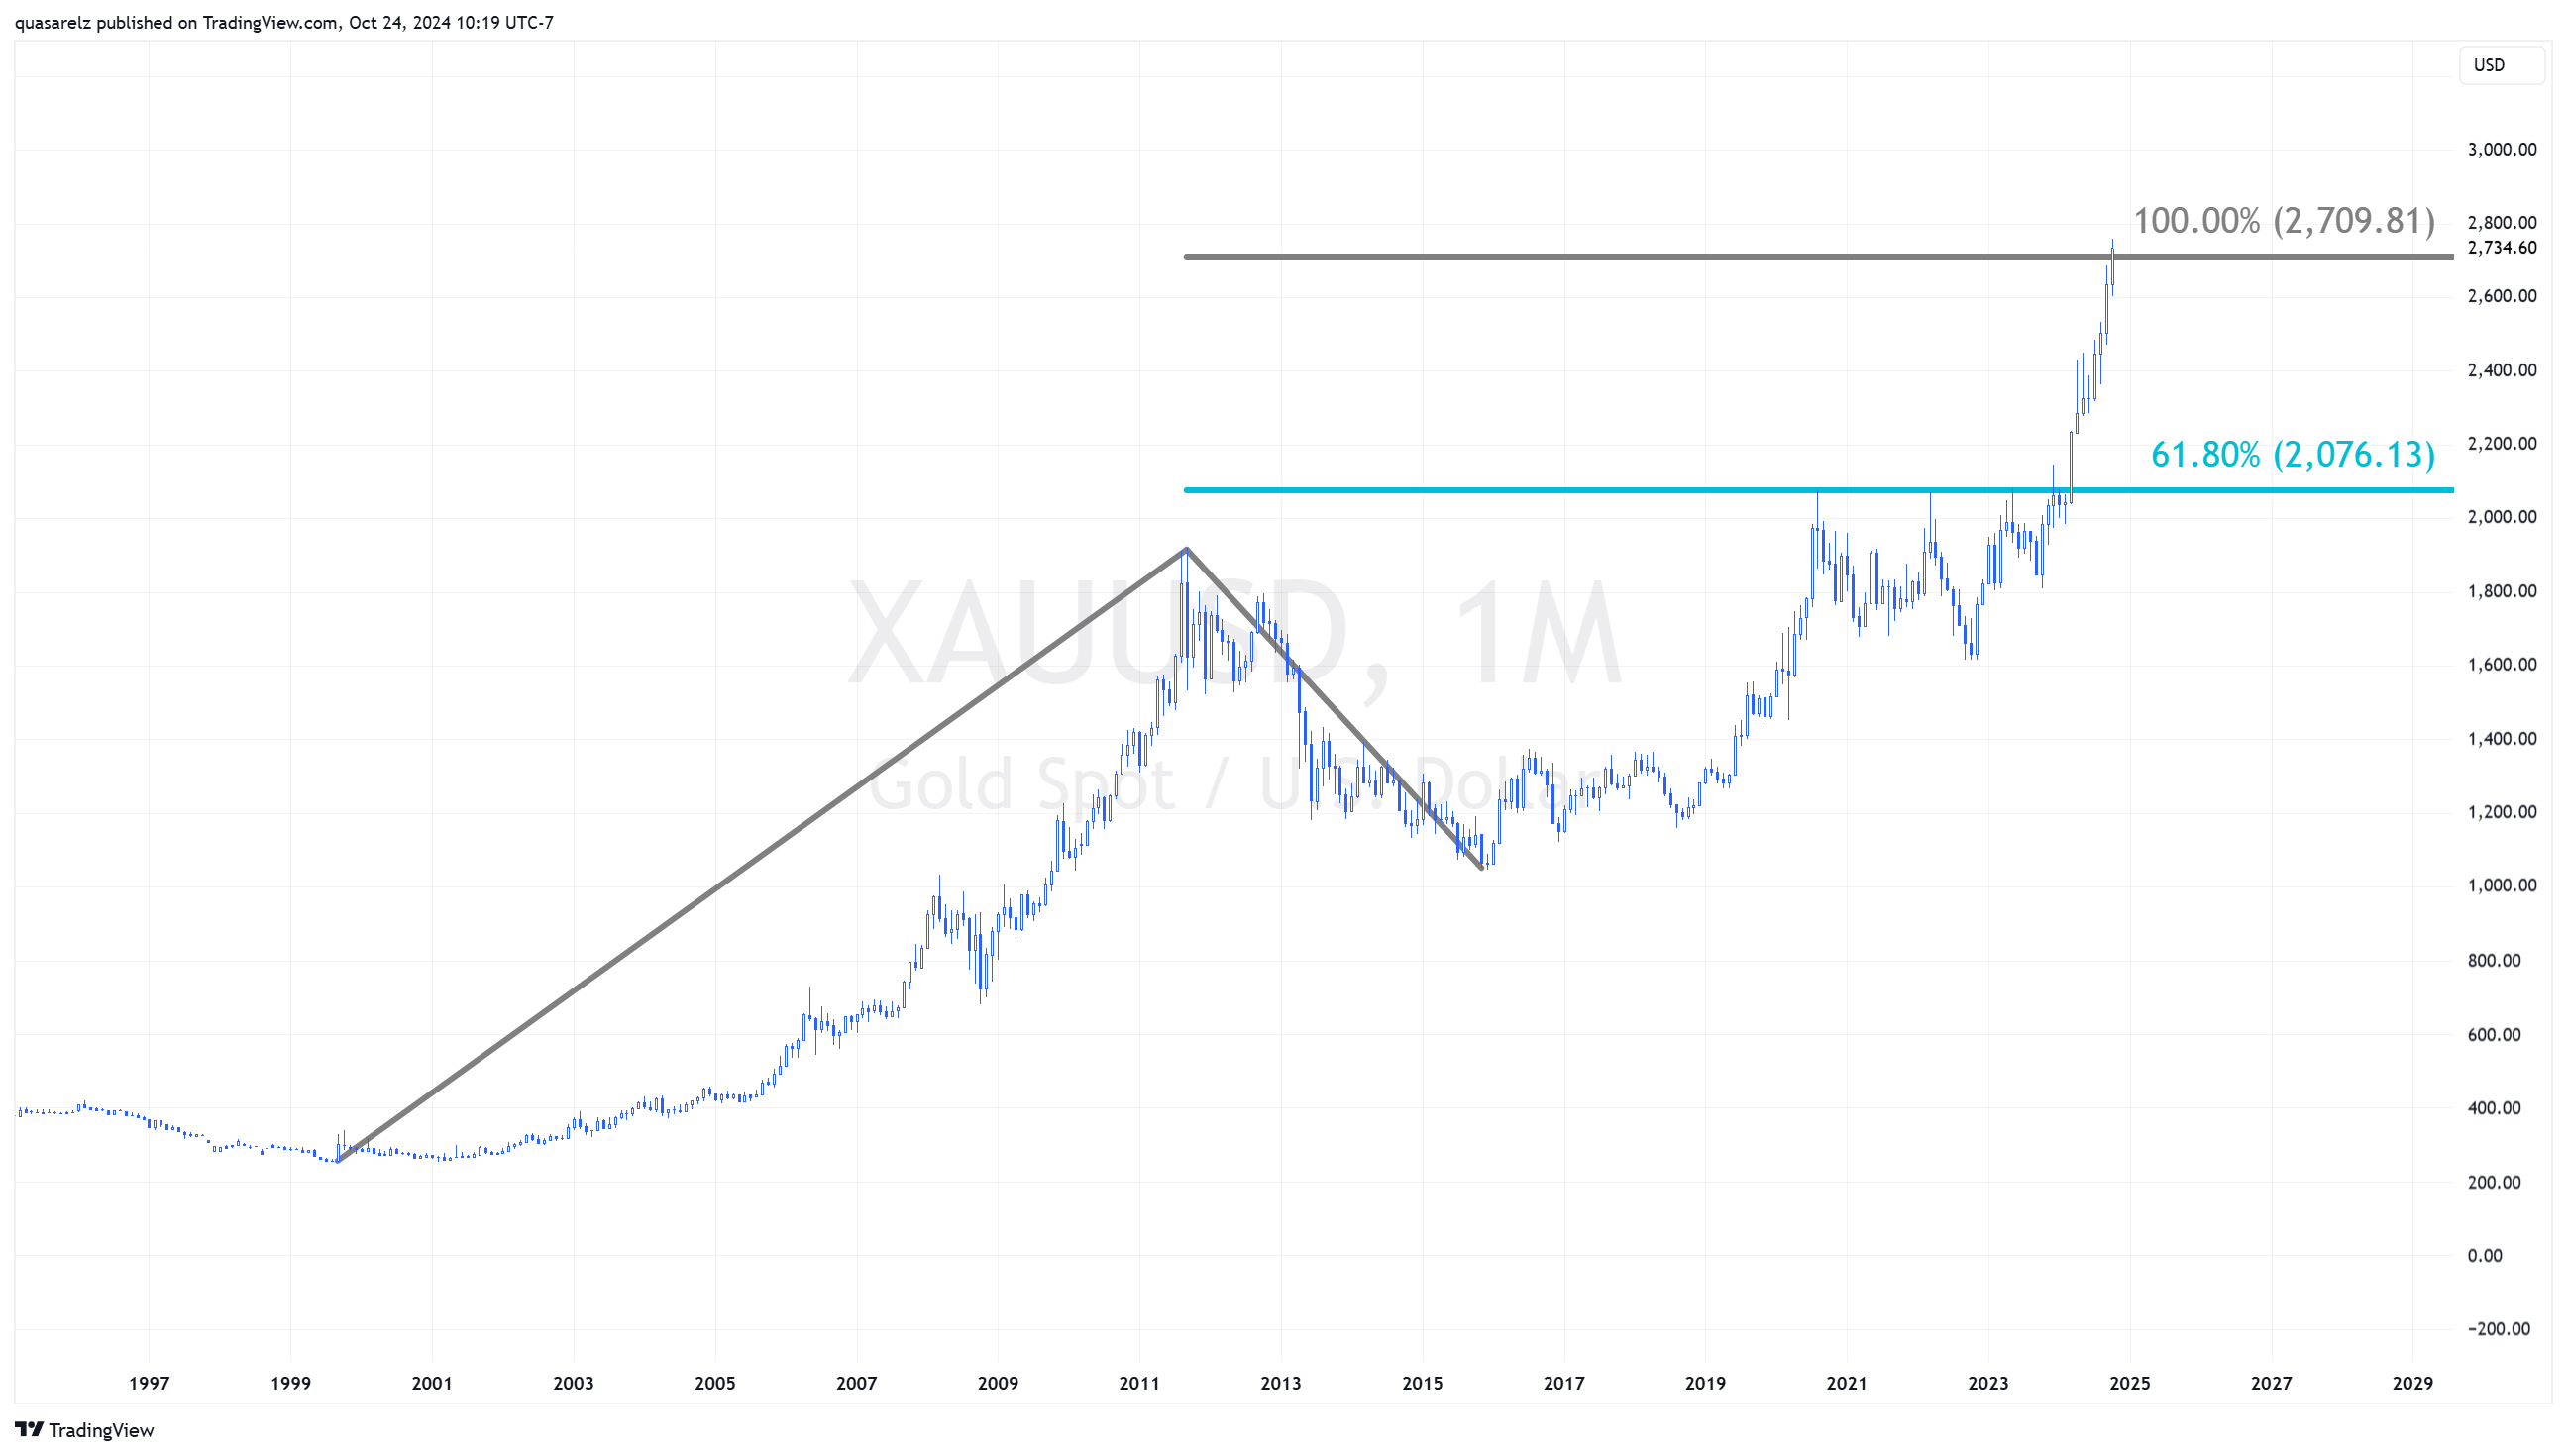
From a long-term perspective, gold prices have reached a critical 100% Fibonacci expansion level, derived from the previous uptrend structure that occurred during the 2000s and the subsequent correction during the 2010s. This level represents a highly significant technical point, suggesting we may be at a key area of potential resistance.
Weekly Chart XAU/USD
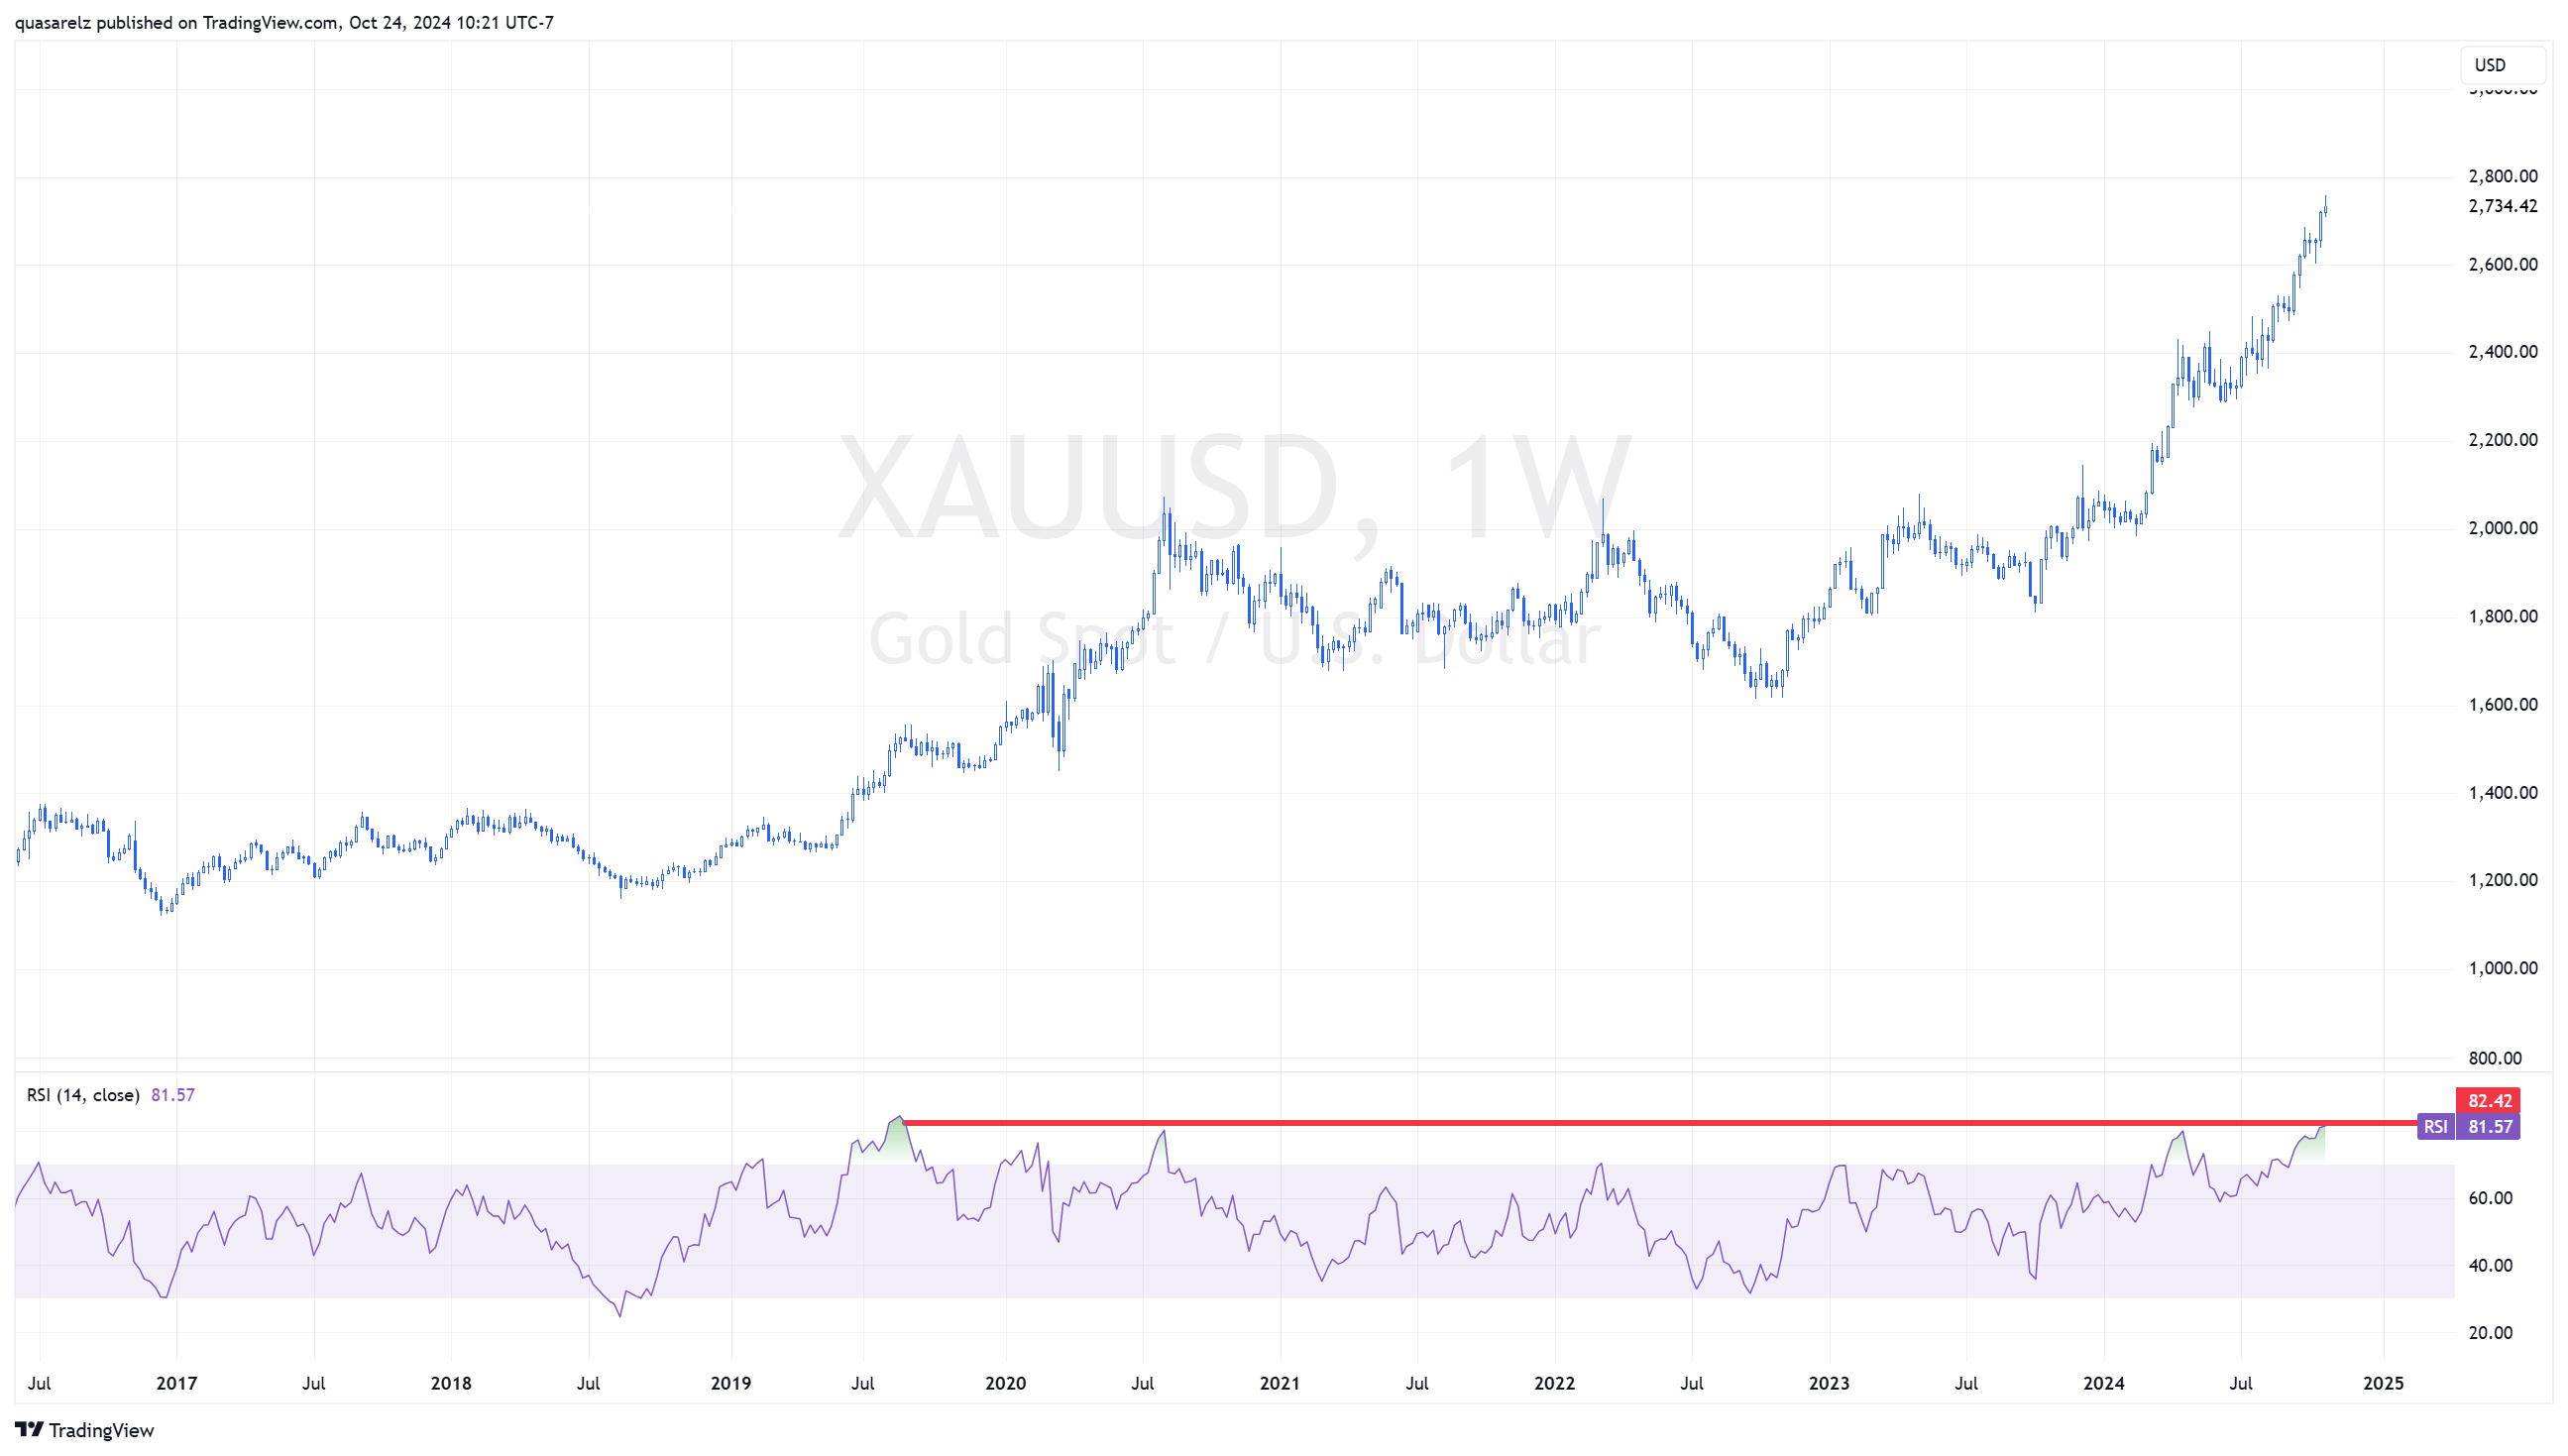
In the weekly chart, gold prices show overbought levels not seen since 2019. While this phenomenon does not necessarily signal an imminent pullback, the confluence with the key resistance level around $2,700 per ounce suggests we could see a pause in gold’s advance in the short term. This resistance area is technically significant and could trigger a consolidation phase or even a slight correction before resuming the upward trend.
Conclusion
In summary, gold has performed exceptionally well in 2024, reaching levels close to $2,760 per ounce. While some factors may limit its advance in the medium term, the metal remains an attractive investment in uncertain times.
Ready to trade?
It's quick and easy to get started. Apply in minutes with our simple application process.
The material provided here has not been prepared in accordance with legal requirements designed to promote the independence of investment research and as such is considered to be a marketing communication. Whilst it is not subject to any prohibition on dealing ahead of the dissemination of investment research we will not seek to take any advantage before providing it to our clients.
Pepperstone doesn’t represent that the material provided here is accurate, current or complete, and therefore shouldn’t be relied upon as such. The information, whether from a third party or not, isn’t to be considered as a recommendation; or an offer to buy or sell; or the solicitation of an offer to buy or sell any security, financial product or instrument; or to participate in any particular trading strategy. It does not take into account readers’ financial situation or investment objectives. We advise any readers of this content to seek their own advice. Without the approval of Pepperstone, reproduction or redistribution of this information isn’t permitted.