- English
- عربي
Dow Jones Industrial Average (DJIA) Explained: A Guide to the US 30
US 30
The US 30 (also known as WS30, DJ30 or Wall Street 30) – often also referred to as the Dow Jones Industrial Average, Dow Jones, Dow, or DJIA – is a stock market index tracking 30 of the most prominent industrial companies listed on stock exchanges within the United States. These companies are not necessarily the largest by overall company value, but they are well-established and influential.
Understanding the Price-Weighted Index
It is one of the oldest, and most widely followed, equity indices, particularly by financial media, although most money tracking the US equity market has since migrated to follow the broader US 500.
In contrast to most other major equity indices, the US 30 is price weighted, rather than market cap weighted, meaning that the higher an individual stock’s price, the greater the weight that it will have in the index.
Calculating the US 30
The DJIA's value is relatively simple to calculate. It's done by adding the stock prices of all 30 member companies and then dividing that sum by a factor called the "Dow Divisor." This divisor is adjusted whenever a stock split occurs within the index but currently sits around 0.1517.
Selection Process and Focus on Diverse Representation
There is no specific selection process by which stocks are selected to become members of the Dow, with the selection committee instead focusing on a range of criteria including “an eligible company's reputation, its history of sustained growth, its interest to investors, and its sector representation of the broader market”.
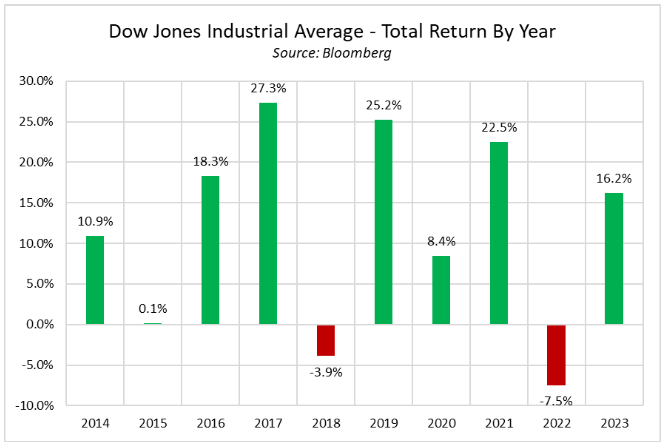
Past Performance Not a Future Guarantee
The historical performance of the US 30, which is no guarantee of future results, is shown below.
The weightings of US 30 constituents, at the time of writing, is as follows:
Position | Stock | Ticker | Weighting as of 01/10/2024 |
1 | Unitedhealth Group Inc | UNH | 9.03% |
2 | Goldman Sachs Group Inc | GS | 7.73% |
3 | Microsoft Corp | MSFT | 6.64% |
4 | Home Depot Inc | HD | 6.2% |
5 | Caterpillar Inc | CAT | 6.07% |
6 | Amgen Inc | AMGN | 5% |
7 | Mcdonald S Corp | MCD | 4.71% |
8 | Salesforce Inc | CRM | 4.3% |
9 | Visa Inc Class A Shares | V | 4.27% |
10 | American Express Co | AXP | 4.21% |
11 | Travelers Cos Inc | TRV | 3.67% |
12 | Apple Inc | AAPL | 3.54% |
13 | Intl Business Machines Corp | IBM | 3.43% |
14 | Jpmorgan Chase & Co | JPM | 3.27% |
15 | Honeywell International Inc | HON | 3.22% |
16 | Amazon.com Inc | AMZN | 2.92% |
17 | Procter & Gamble Co | PG | 2.69% |
18 | Johnson & Johnson | JNJ | 2.51% |
19 | Boeing Co | BA | 2.43% |
20 | Chevron Corp | CVX | 2.26% |
21 | 3m Co | MMM | 2.13% |
22 | Merck & Co. Inc. | MRK | 1.77% |
23 | Walt Disney Co | DIS | 1.49% |
24 | Nike Inc Cl B | NKE | 1.39% |
25 | Walmart Inc | WMT | 1.24% |
26 | Coca Cola Co | KO | 1.11% |
27 | Dow Inc | DOW | 0.86% |
28 | Cisco Systems Inc | CSCO | 0.82% |
29 | Verizon Communications Inc | VZ | 0.7% |
30 | Intel Corp | INTC | 0.37% |
The material provided here has not been prepared in accordance with legal requirements designed to promote the independence of investment research and as such is considered to be a marketing communication. Whilst it is not subject to any prohibition on dealing ahead of the dissemination of investment research we will not seek to take any advantage before providing it to our clients.
Pepperstone doesn’t represent that the material provided here is accurate, current or complete, and therefore shouldn’t be relied upon as such. The information, whether from a third party or not, isn’t to be considered as a recommendation; or an offer to buy or sell; or the solicitation of an offer to buy or sell any security, financial product or instrument; or to participate in any particular trading strategy. It does not take into account readers’ financial situation or investment objectives. We advise any readers of this content to seek their own advice. Without the approval of Pepperstone, reproduction or redistribution of this information isn’t permitted.