However, as a guide, the consensus estimate of the 79 economists polled by Bloomberg sits at 145,000 jobs, with the range being 185K to 85K. The six-month average is 149K, while the 12-month average is a touch higher at 179K, with the top-rated economist (Canadian Imperial Bank of Commerce) calling for 166K. Good luck to all those participating in this lottery.
The week ahead
It’s that time of the week again when we can look ahead at the week that’ll be and plan accordingly as part of the trading process. I’ve put together a video (see above) looking of the key macro and big-picture themes, data points that’ll affect markets, and the trading considerations that can help with our risk-to-reward assessment.
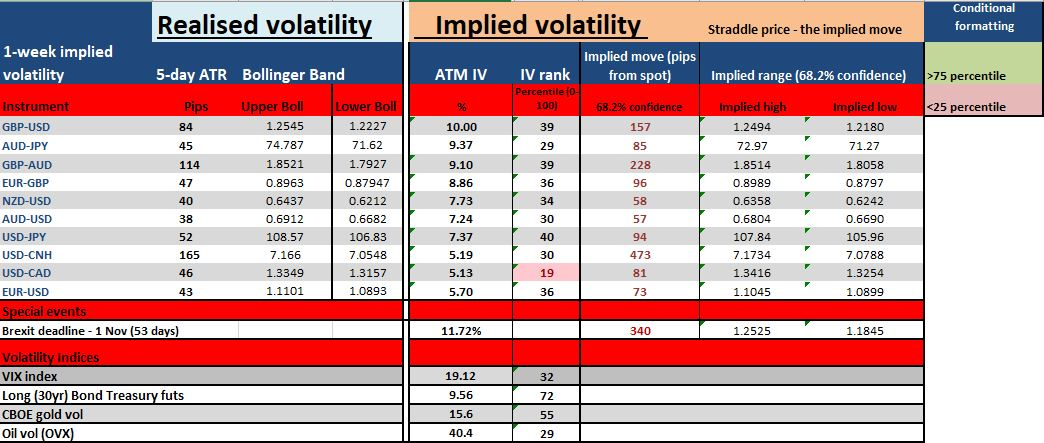
These considerations, notably the implied volatility report, can help define our position-sizing and even offer a confidence factor for automated traders. For example, if our EA performs well in low vol periods, which are the conditions in FX we currently see by judging the implied vol (IV), then we can have greater confidence in our system. Of course, in periods where realised and implied volatility are too high, then we may look at reducing position-sizing or even turn the system off.
While I cover this in the video, here’s the table of both realised and implied volatility, as well as the expected move in the underlying based-on options (straddle) pricing. I’ve also added vol reads on equity, oil, gold and bonds. For those interested in gaining a deeper perspective on using volatility effectively here, please take a look at my recent webinar on the subject. Do subscribe to the channel for regular market updates, education and strategy.

Interest rate pricing
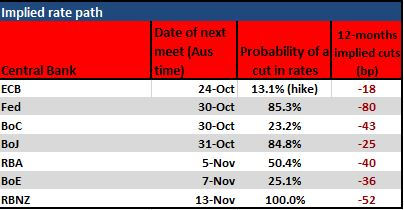
Here, we can see what the market is expecting from central banks. I’ve looked at the implied probability of a cut at the respective upcoming meetings, and then in the last column the expected easing (in basis points) over the coming 12 months. We can assess this from the interest rate and swaps market pricing.

I didn’t cover off on this in the video, but on the left table we can see weekly risk reversals or the skew of 25-delta call vs put volatility. The more negative the number, the greater the demand for put option volatility over calls, which really shows that traders see a greater probability of downside risk in that instrument. The higher the number shows that traders have been relative buyers of 25-delta call options (over puts) and thus expect a greater probability of upside.
The right table is the weekly Commitment of Trader (CoT) report, which looks at the reported net position held by non-commercial players. This will be updated tonight, but it gives some idea of the positioning in the market.

Pepperstone doesn’t represent that
The material provided here has not been prepared in accordance with legal requirements designed to promote the independence of investment research and as such is considered to be a marketing communication. Whilst it is not subject to any prohibition on dealing ahead of the dissemination of investment research we will not seek to take any advantage before providing it to our clients.
Pepperstone doesn’t represent that the material provided here is accurate, current or complete, and therefore shouldn’t be relied upon as such. The information, whether from a third party or not, isn’t to be considered as a recommendation; or an offer to buy or sell; or the solicitation of an offer to buy or sell any security, financial product or instrument; or to participate in any particular trading strategy. It does not take into account readers’ financial situation or investment objectives. We advise any readers of this content to seek their own advice. Without the approval of Pepperstone, reproduction or redistribution of this information isn’t permitted.
