- English
- عربي

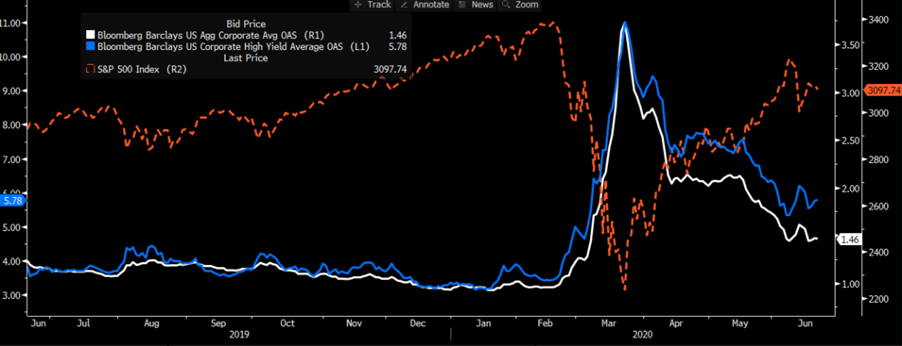
US high yield credit trades at 5.78% (blue lines), while investment-grade (white) trades at 1.46%, both seemingly consolidating after a bullish run. Credit leads equity, so until credit spreads start to narrow again, then it feels like equity will be either be directionless or subject to changes in the data flow. Risk FX such as the AUD, MXN and ZAR will follow.
Equity internals are not giving me much either with small caps starting to underperform large caps, cyclicals losing an edge over defensives leveraged buyback names underperforming the S&P 500.
With futures opening on a slight negative tone, if I look at the US500 (4-hour) we see price pulling below the 3165 to 3074 range and there is scope for a move into 3030 to 3000, with big support into 2960.
Increased focus on the Fed’s balance sheet
It is perhaps no coincidence that risk assets are failing to push higher in a week where the Fed’s balance sheet fell by $74.24b to $7.1t - the first decline since 26 February (or 15 weeks). The core reasoning behind this was that a number of central banks repaid USDs borrowed through the Fed’s swap lines set up in March to elevate the USD funding blow out. We now see the ECB, BoE, SNB, and BoJ lowering the frequency of its seven-day swap facility to three times per week (from daily) – it seems the world has enough USD’s and as many of the swap terms expire the Fed will receive USDs, which could further reduce the balance sheet and put modest upside in the USD.
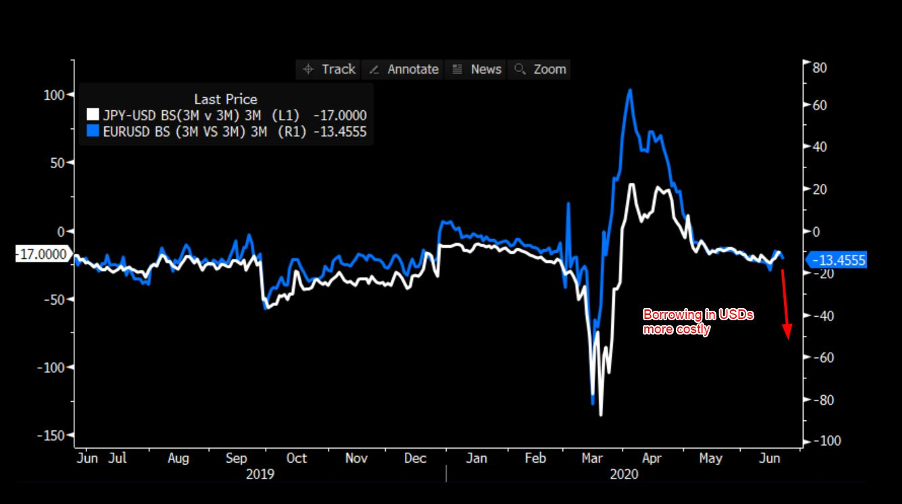
Strategists will be watching FX basis and the broad cost for USD funding. If we see a widening of the ‘basis’ it will be seen as an additional cost to hedge investments in the US by foreign entities. So, a wider FX basis could see the USD moving higher on a broad basis in appreciation and that could put downside in risk assets more broadly. Here is a good explainer.
It seems bizarre that risk assets could struggle because global central banks have ample USDs, so the contraction of the balance sheet sends risk FX and equity lower. However, the reduction in the balance sheet is symbolic non-the-less and given current extreme valuation, it won’t take much for the market to see this as a liquidity headwind and when we mix in rising concerns around renewed COVID crisis then it may keep risk on the back foot this week.
Sentiment impacted by economic data flow
I continue to believe liquidity is one key consideration but when it comes to the impact of COVID19 on markets it is all about economic data. If the market gets the sense that the recovery is going to be materially impacted by a new wave and rise in the case count then forget that the Fed is supporting risk assets – the market will go after the Fed and see what is next in their tool kit with the Fed put (strike) well below current market levels. I say Fed as the US accounts for a large percentage of new cases, with the Americas, more broadly, accounting of 63% of new cases.
The US bond market is not buying into the recovery
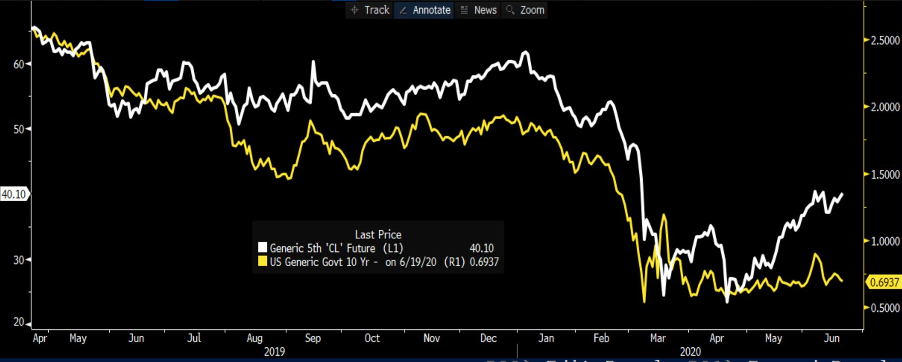
One aspect that has not bought into the economic recovery is the US bond market and while we can point to Fed intervention every sell-off in Treasuries has been bought. The bond market usually gets it right in its economic predictions. I can pull out a number of charts that shows the economic recovery, but the bond market is not directly buying into it. The copper/gold ratio has cleanly diverged from the US 10yr Treasury, as has WTI 5th month future (I look at this as it looks further into the economic recovery phase). I can also look at the daily chart of lumber which has rallied 69% from the April low.
WTI 5th month future vs US10yr Treasury
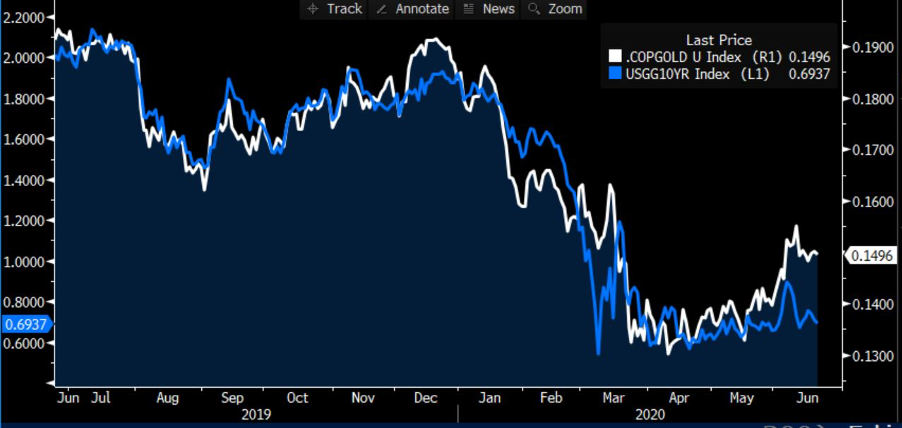
Copper/gold ratio vs US10yr
What’s really interesting for me is that real Treasury yields (i.e. subtracting nominal yields for inflation expectations) are falling hard and at -75bp (on 5yr real rates) are not far off multi-year lows. As we see in the top pane the relationship with gold (I have flipped this to better show the relationship) is strong. In fact, the two-year correlation coefficient between the two variables is 0.904 – incredibly high.
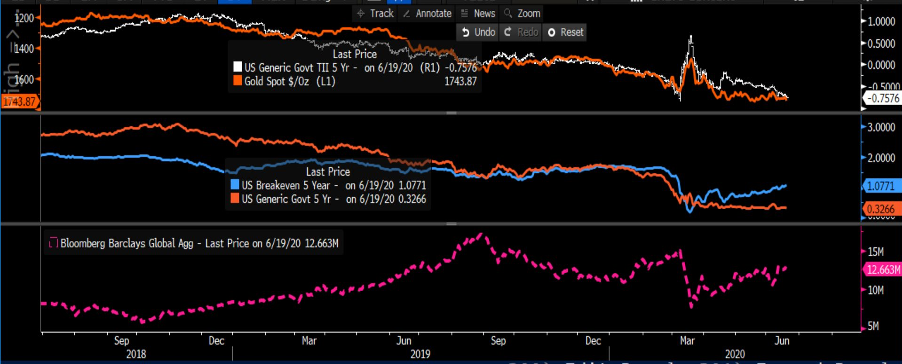
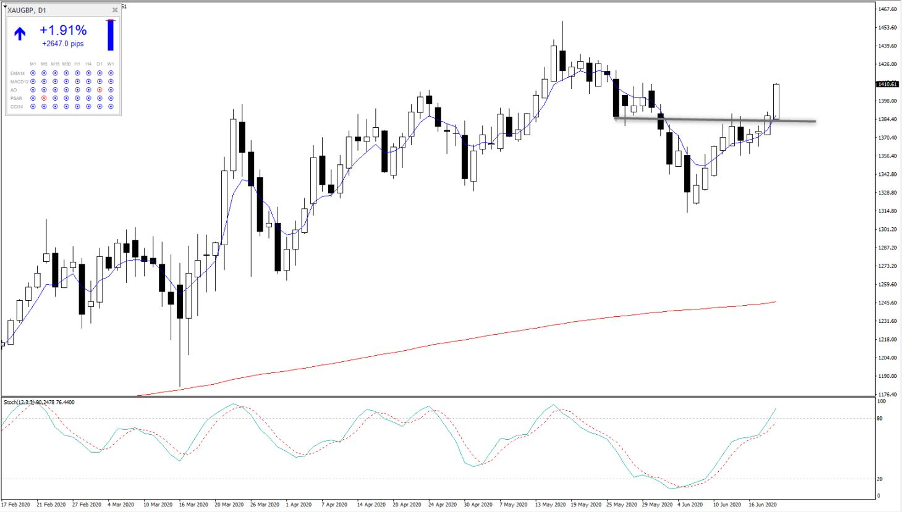
Gold is right back on the radar, as positioning and sentiment are as neutral as I have seen despite gold tracking back to the top of the range. A closing break of 1750 and the bullish trend resumes. The question is what currency to buy, as we may be staring at a period of relative USD strength. Last week gold priced in GBP (XAUGBP) was the place to be.
Key event risk - what's on the data docket?
Monday
- RBA gov Lowe speaks on a panel (9:00 AEST)
- China – the PBoC release potential changes to its 1 and 5-year Loan Prime rate (11:30 AEST). No change is expected, but it wouldn’t surprise to see this lowered by 20bp which could impact USDCNH and therefore AUD by association.
- Chicago Fed national activity index (22:30 AEST)
Tuesday
- EU PMI data – broad improvement is expected across the various countries, with the Eurozone manufacturing (due 18:00 AEST) eyed at 44.8 (from 39.4) and services at 41.2 (30.5)
- UK PMIs (due 18:30 AEST) expected to show improvement – watch EURGBP for a material move through 0.9000
- Markit US manufacturing (expected to improve from 39.8 to 50.8)
- Richmond Fed manufacturing (-27 to -11) – guides expectations of the ISM manufacturing report due 2 July (consensus 48.1)
Wednesday
- RBNZ meeting (12:00 AEST) – Hard to see anything but a dovish tone, with no changes to policy. Watching AUDNZD for a potential upside move
- German IFO survey (18:00 AEST) – Economists expect further normalisation across the three business surveys (business climate, expectations, current assessment) – good numbers here could stabiles the move in the EUR.
Thursday
- US durable goods orders (22:30 AEST) – consensus expects a 10.9% rise in May data
- Initial and continuing jobless claims (also 22:30 AEST) – the market expects 1.35m new claims, maintaining claims remain over the 1 million mark.
- Kansas Fed manufacturing (01:00 AEST) – the index is expected to improve from -19 to -10.
Friday
- US personal income and spending (22:30 AEST) – spending is expected to increase by 8.5% in May, but unlikely to move markets
- US core PCE deflator inflation (22:30 AEST) – the market is looking for 0.00% MoM with the YoY print to push to 0.9% - again, no reason to worry about market exposures over this data point as unlikely to move markets.
Related articles


Ready to trade?
It's quick and easy to get started. Apply in minutes with our simple application process.
The material provided here has not been prepared in accordance with legal requirements designed to promote the independence of investment research and as such is considered to be a marketing communication. Whilst it is not subject to any prohibition on dealing ahead of the dissemination of investment research we will not seek to take any advantage before providing it to our clients.
Pepperstone doesn’t represent that the material provided here is accurate, current or complete, and therefore shouldn’t be relied upon as such. The information, whether from a third party or not, isn’t to be considered as a recommendation; or an offer to buy or sell; or the solicitation of an offer to buy or sell any security, financial product or instrument; or to participate in any particular trading strategy. It does not take into account readers’ financial situation or investment objectives. We advise any readers of this content to seek their own advice. Without the approval of Pepperstone, reproduction or redistribution of this information isn’t permitted.