- English
- عربي
Learn to trade
The Gold-Ratio and the Economy
In short: The Gold-Oil Ratio, a summary:
The Gold-Oil Ratio shows how many barrels of crude oil at its current price can be bought with one ounce of gold at its current price. To calculate it, simply divide the price of one ounce of gold by the price of one barrel of crude oil.
This ratio actually provides valuable insight into market sentiment and economic events. By understanding how this ratio behaves in different scenarios, you can make more informed decisions with trading strategies and better understand the macroeconomic conditions affecting the financial markets you trade.
Still, the Gold-Oil-Ratio is not without its drawbacks, so always ensure you use it in conjunction with other forms of analysis and also a robust risk management plan.
What is the Gold-Oil Ratio?
The Gold-Oil Ratio is a measure of the value of gold and crude oil as compared to each other. Basically, it's a calculation anyone can do to determine how many barrels of oil can be bought with one ounce of gold, or vice versa.
Although crude oil and gold are both affected by a complex interplay of different factors, there is often also a positive price correlation between them. This means that when one asset rises or falls, the other tends to follow suit. This makes the two useful for comparing to one another in most economic markets.
As such, traders can use the Gold-Oil Ratio as an indicator of market sentiment and a reliable predictor of economic events. The ratio has been used by analysts to forecast trends in commodity prices and as a barometer when it comes to bear markets and other financial instability.
Historical patterns analysis of the Gold-Oil Ratio
There have been several key events in recent years that have had an impact on the gold-oil ratio. During the financial crisis in 2008, demand for gold spiked as investors sought safe haven assets, causing the ratio to hit its highest level since 1998.
Similarly, during the 2014 oil price crash caused by oversupply and weak demand for crude oil, the demand for gold rose again, as investors moved away from risky investments like oil. This happened again in 2016.
Uncertainty also led to changes in the ratio. During the 2008 global financial crisis, for example, the gold price skyrocketed compared to oil and many other securities. And in 2020, during the Covid-19 pandemic, when demand for crude oil plummeted amidst global quarantines and lockdowns, gold reached an all-time high of 2074.88 per ounce.
I'm not trading on spot gold or oil prices. Why do I care?
Although historic trends and past performance is never a 100% guarantee, understanding this ratio can help you predict what your chosen market might do next. That's because the Gold-Oil Ratio is affected by central bank policies, stock market performance, political events and more. Due to it being tied to so many things, the ratio can be considered a reliable indicator of market sentiment and can be used to gain insight into the global economy. And by understanding these factors, traders could use this ratio to inform their decisions and better manage their risk in volatile markets.
Factors influencing the Gold-Oil Ratio
Here are the main factors traders must be aware of to make informed trading decisions when taking the Gold-Oil Ratio into account:
Economic events and crises: Think of the Covid-19 pandemic, political events, wars and elections. Similarly, tensions in the Middle East have often led to a decrease in crude prices and an increase in gold prices—and consequently an increase in the Gold-Oil Ratio.
Financial crisis and banking crises: Although both gold and oil have a lot of different factors affecting their pricing, generally market volatility due to economic crises can cause dramatic changes in the ratio. For example, during times of economic uncertainty, investors turn towards safe haven assets like gold, leading to a decrease in the Gold-Oil Ratio. In contrast, when markets are more stable and the price of crude oil is high, the ratio tends to increase.
Monetary policies and interest rates: During times of interest rate hikes, investors tend towards more safe-haven assets like gold in many scenarios, as we’ve said. However, when central banks reduce interest rates or engage in quantitative easing (QE) programs, investors tend to shift away from low-yielding assets like gold and towards higher-yielding things like energy markets. This often leads to a decrease in the Gold-Oil Ratio.
Stock market performance: When stocks are performing well, investors and traders tend to move away from assets like gold, which are more geared towards wealth preservation than wealth creation, and towards ‘riskier’ securities such as energy prices. This can lead to an increase in the Gold-Oil Ratio. When stock markets are weak and experiencing volatility, the opposite is often true, and the ratio decreases.
Forex market shifts: Currency movements can also have an impact on the ratio. This is partially because the exchange rate of the US dollar has a tight correlation with crude oil prices, as crude oil is quoted in USD. At the same time, most currencies have a correlation to the gold price - for example, the USD is often inversely related. So, currency fluctuations can lead to changes in the relative value of gold and the oil prices and consequently in the ratio.
Global production of oil: Due to the laws of supply and demand, a shortage in crude oil in the markets may lead to a rise in oil prices, directly affecting the Gold-Oil Ratio. Likewise, a disruption in gold production and a shortage of it might also spike the gold price and affect the ratio.
Advantages of using the Gold-Oil Ratio as an indicator
One of the upsides of understanding how the ratio behaves in different scenarios, is that you can use that data to determine which underlying assets are best to buy or short sell in order to reduce risk and maximise returns. For example, if the Gold-Oil Ratio is trending downwards due to weak economic conditions, traders may wish to try more crude oil positions while short selling gold.
A fundamental analysis of the market drivers affecting the ratio can help with this. For example, the strength of the U.S. dollar affects the ratio. As the greenback strengthens relative to other currencies, it usually makes both gold and crude (which are both priced in dollars) more expensive. This can lead to an increase in the Gold-Oil Ratio as investors are forced to pay a higher price for the precious metal. And vice versa. Traders who understand this can take out long or short positions on the spot gold price, the U.S. Dollar and various oil markets by reading the Gold-Oil Ratio signs.
Also, on a macro level, many market experts feel that a higher Gold-Oil Ratio has historically often indicated an economy in distress. Having knowledge of this early on can help longer-term traders like swing traders and position traders make more profitable decisions and less losses.
Disadvantages and risks of using the Gold-Oil Ratio
There are, however, drawbacks to consider. For starters, the Gold-Oil Ratio is a lagging indicator – it typically responds to current market movements rather than predicting them. This means it may be too late to take advantage of any opportunities it reveals and could lead to missed profits.
Changes in the ratio can often take place slowly and over long periods of time, so you'll need to be patient when waiting for the ratio to change direction. It’s also important to remember that the ratio is a mathematical representation, so it does not always accurately reflect the whole story of the relationship between the gold and oil price. Both are complex assets and can often be affected by outside factors such as political tensions or financial instability not related to their respective markets. As the saying goes: ‘the map is not the territory’.
It’s important to remember that, while the Gold-Oil Ratio can offer traders valuable insights into the financial markets, it’s only one piece of the puzzle when it comes to trading success. It's wise to use the ratio as only one part of a well-rounded trading plan. It's also important to still use adequate risk management , such as stop-loss or take-profit orders, with all your positions.
Verdict: How useful is tracking the movements between Gold Prices and Oil Prices?
The Gold-Oil Ratio is a useful tool for traders - though it has its limitations. By tracking the directional movements between gold and oil, they can have an accurate measure of how each asset class is performing relative to each other. This can provide valuable insight into market movements and can be used as a way to confirm what long-term positions to open and close - especially for those who trade spot gold or crude oil, but even for those who don't.
The ratio is also useful when it comes to diversification and risk management. When market conditions are uncertain, you can use your knowledge of the Gold-Oil Ratio to hedge your existing positions with new ones, or even use the commodities to hedge against inflation, based on the current ratio. If for instance the Gold-Oil Ratio is up, this can be a sign or confirmation of an uncertain market where gold performs well, and the knowledge can be used to consider hedging positions that take this into account.
While the gold-oil ratio can be a useful tool for both short-term and long-term traders, it tends to be more useful to, say, position traders than to scalpers. That's because by nature it is a longer-term signal, giving traders a heads up when it comes to bear markets and other financial instability.
How to calculate the Gold-Oil-Ratio
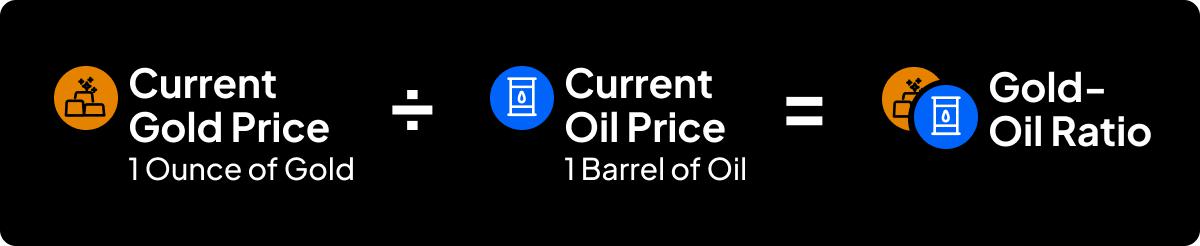
The Gold-Oil Ratio measures how many barrels of crude oil can be purchased with one ounce of gold. It is calculated by dividing the price of an ounce of gold by the price of one barrel of crude oil. To calculate it, simply divide the price of gold by the current oil price.
Related articles
The material provided here has not been prepared in accordance with legal requirements designed to promote the independence of investment research and as such is considered to be a marketing communication. Whilst it is not subject to any prohibition on dealing ahead of the dissemination of investment research we will not seek to take any advantage before providing it to our clients.
Pepperstone doesn’t represent that the material provided here is accurate, current or complete, and therefore shouldn’t be relied upon as such. The information, whether from a third party or not, isn’t to be considered as a recommendation; or an offer to buy or sell; or the solicitation of an offer to buy or sell any security, financial product or instrument; or to participate in any particular trading strategy. It does not take into account readers’ financial situation or investment objectives. We advise any readers of this content to seek their own advice. Without the approval of Pepperstone, reproduction or redistribution of this information isn’t permitted.