- English
- عربي
Learn to trade
Some basic information about BP
BP stands for Beyond Petroleum, formerly known as British Petroleum. They are an oil and gas company with headquarters in London.
It is one of the world’s seven oil and gas ‘supermajors’. The others are Chevron, ConocoPhilips, Eni, ExxonMobil, Shell, and Total Energies.
BP is the 5th largest company within the FTSE100 by Market Cap.
They are transforming. Taken from their website ‘Our purpose is reimaging energy for people and our planet. We want to help the world reach net zero and improve our lives.’ They are decarbonizing and diversifying their business.
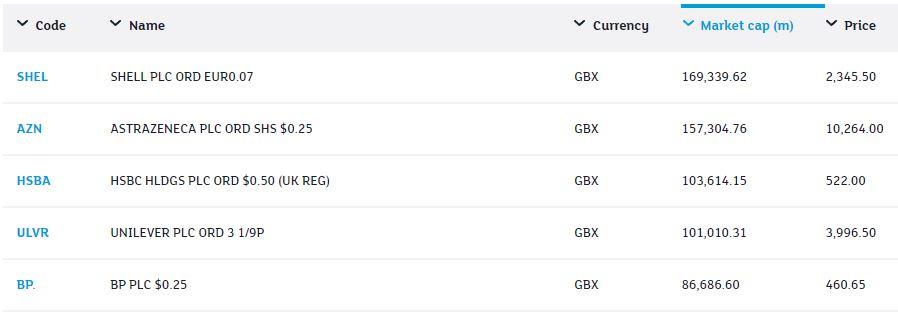
Figure 1 the london stock exchange
The bullish run from the 2020 low
BT share price has seen a bullish run of 149.12% from the October 2020 low of 188.50 to the August 2022 high of 469.60. It should be noted that BP has only missed their earnings estimate once in the last thirteen reports. The next is due on the 1st November 2022.
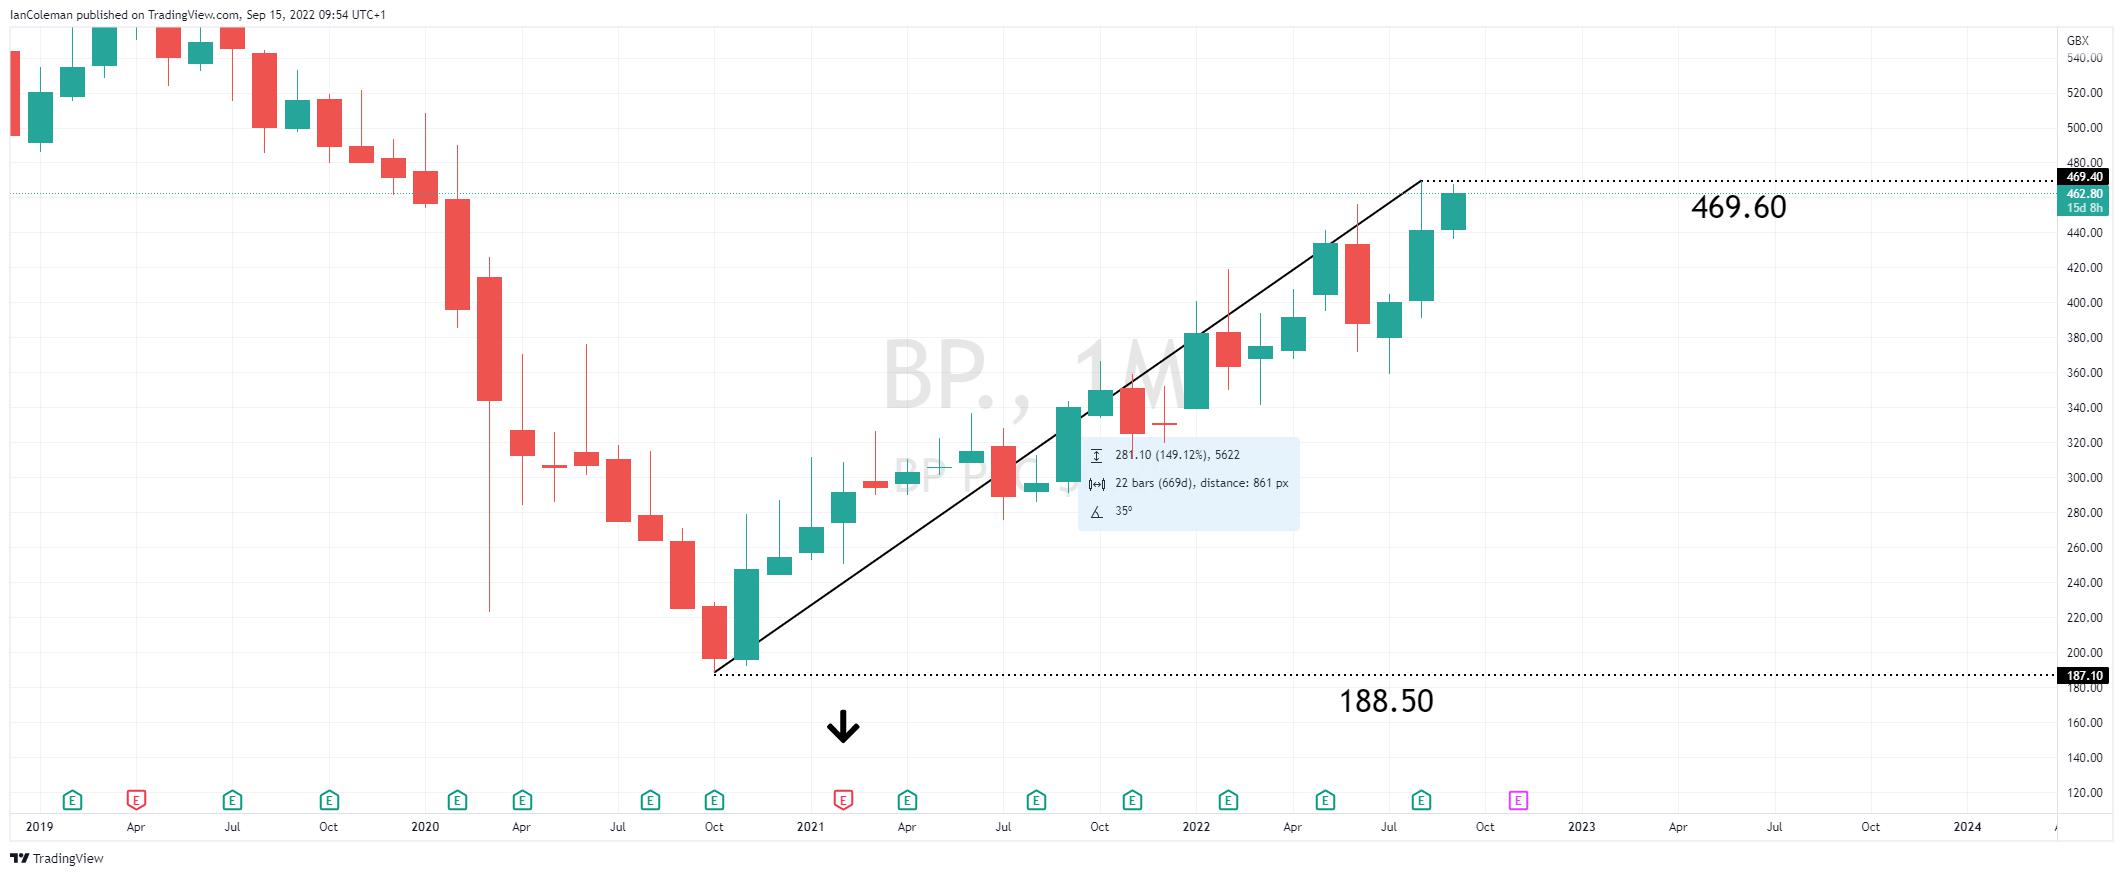
Figure 2 Trading View BP Shares
BP share price correlation with Oil
The chart below highlights the correlation between BP share price and the XTI Oil contract. We can clearly see correlation from the 2020 low.
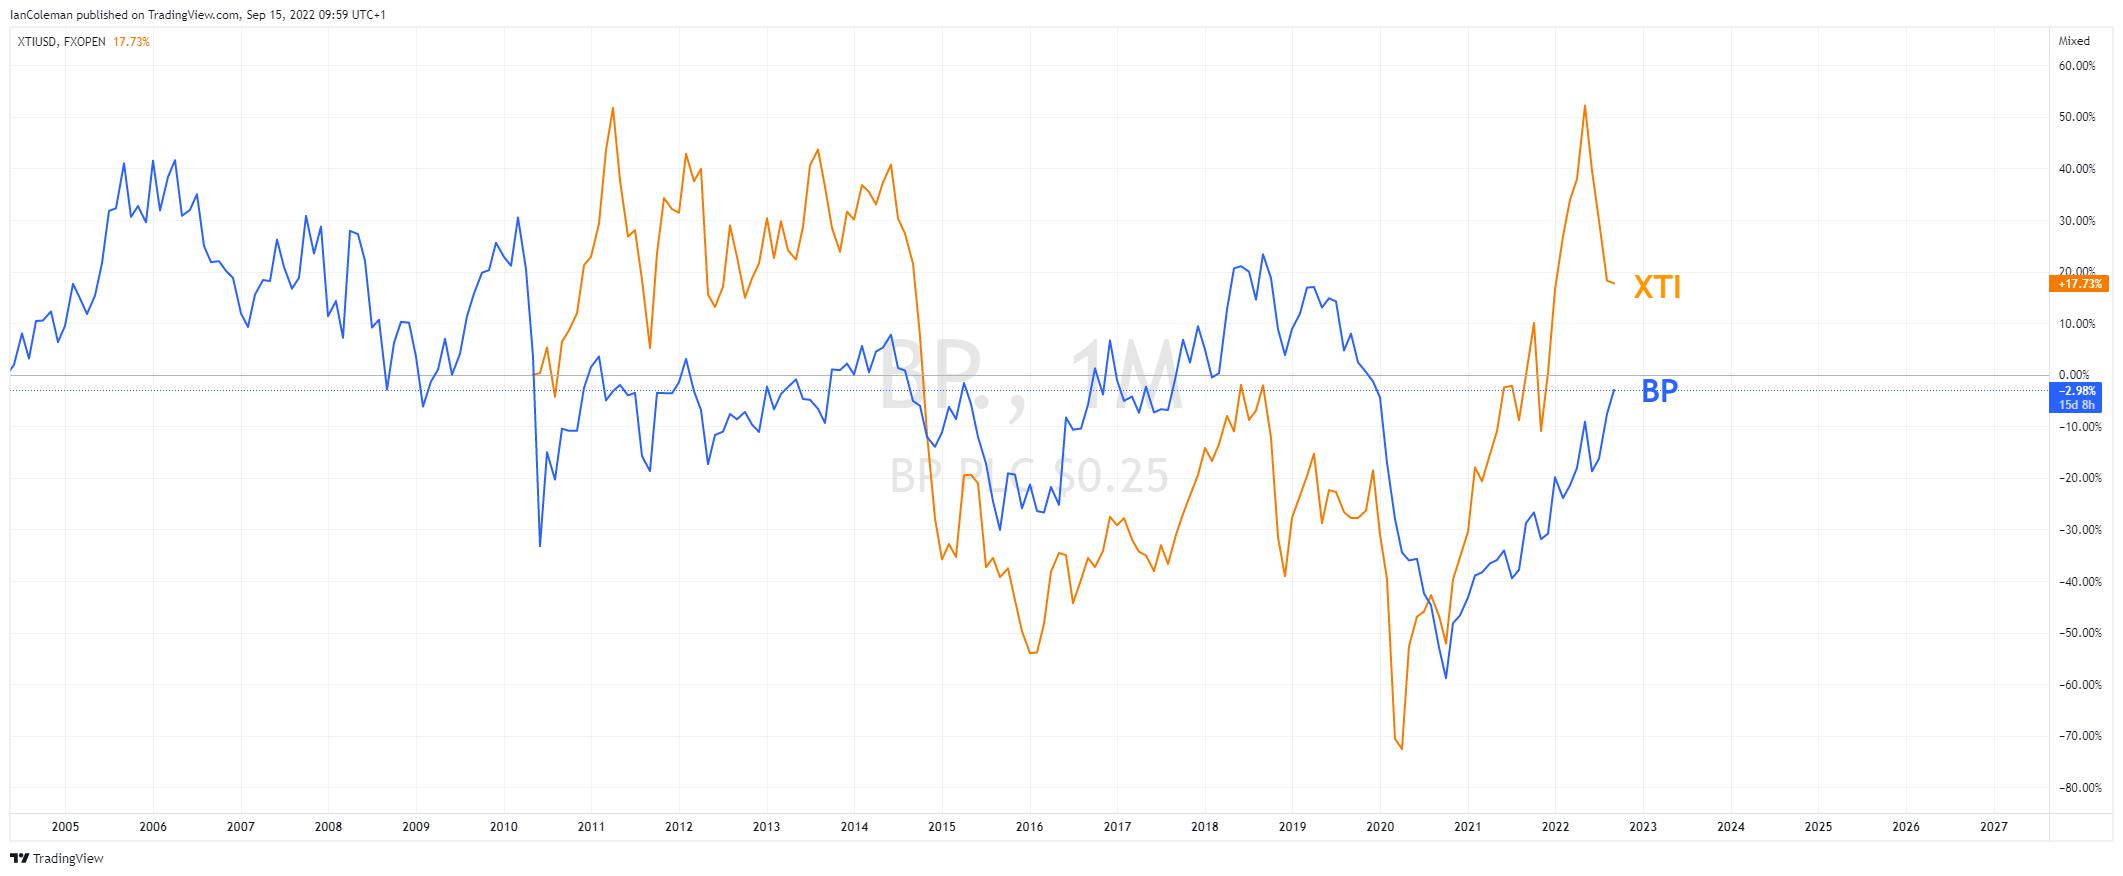
Figure 3 Trading View BP correlation with XTI
A look from a technical perspective
The weekly chart clearly highlights BP share price moving higher in a bullish channel formation. Trend line resistance is seen at 477.55, close to the current price.
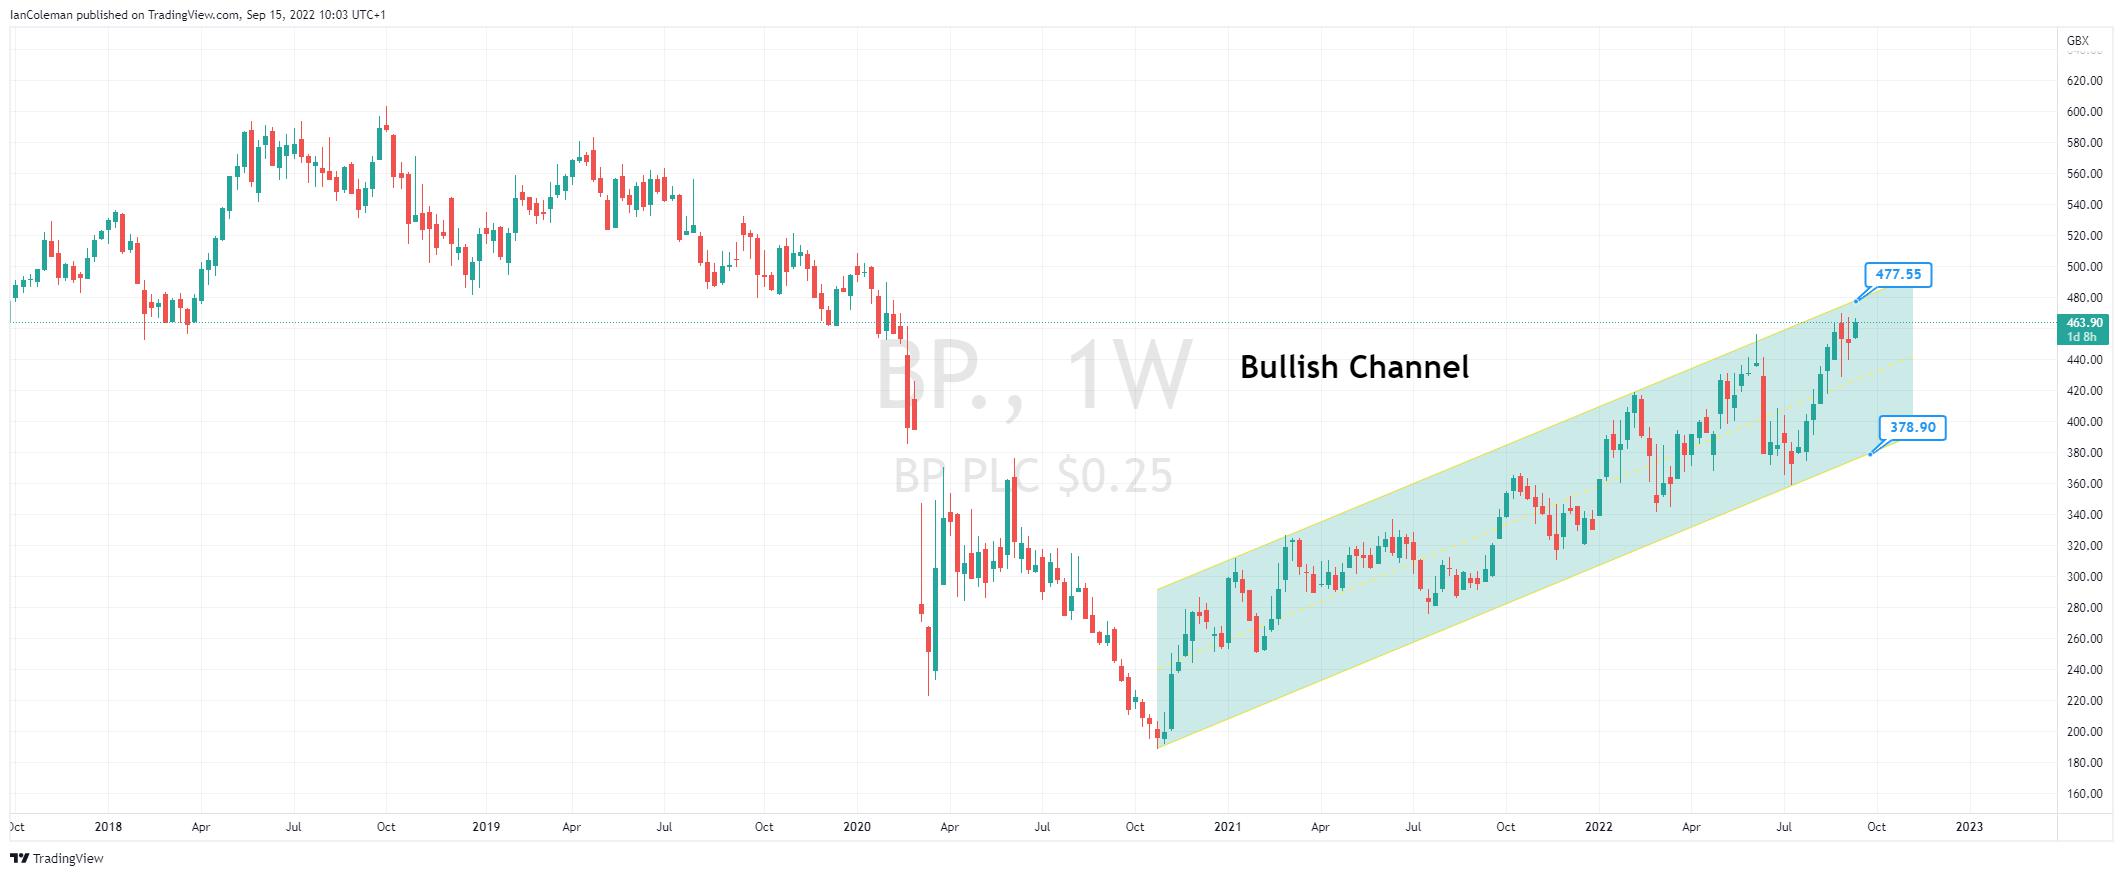
Figure 4 Trading View Weekly Bullish Channel
A look from an Elliott Wave perspective and we can see the last move lower in 5-waves. This would suggest that the move higher is corrective.
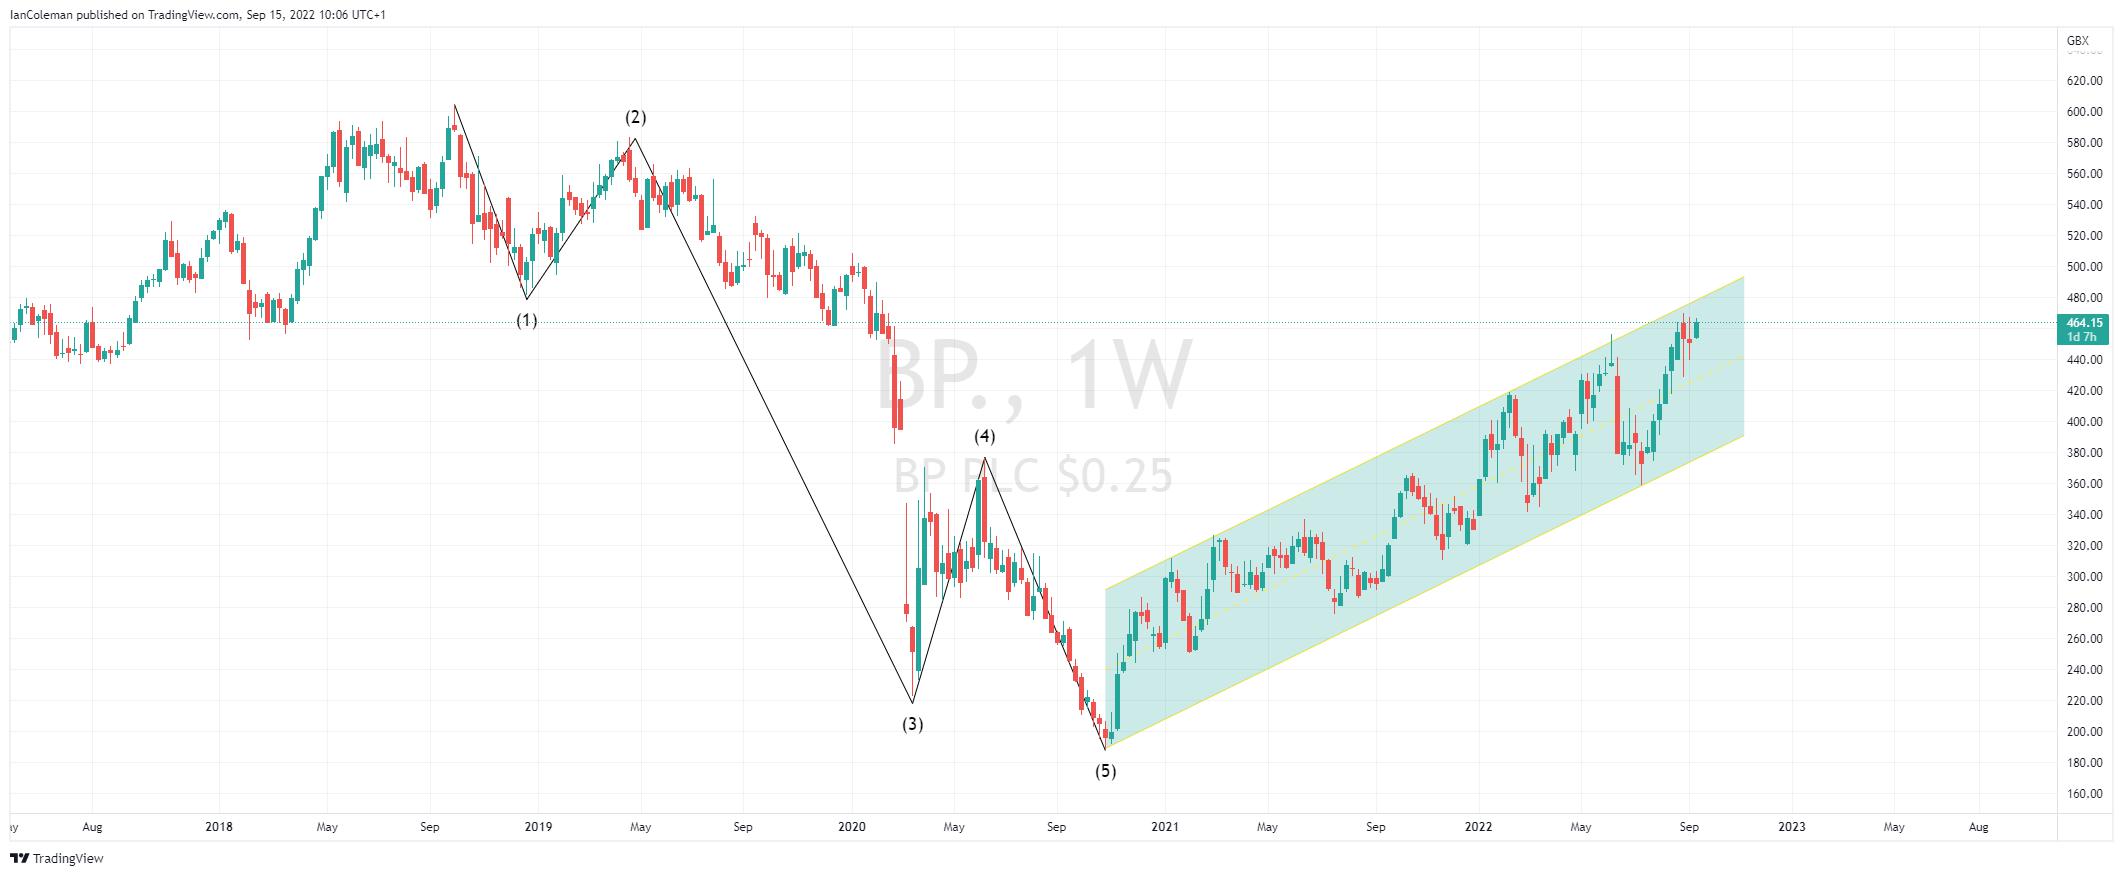
Figure 5 Trading View Elliott Wave
We can also note a previous swing of low of 481.35 from the 24th of December 2018. What was support now becomes resistance. This is close to the channel resistance of 477.55.
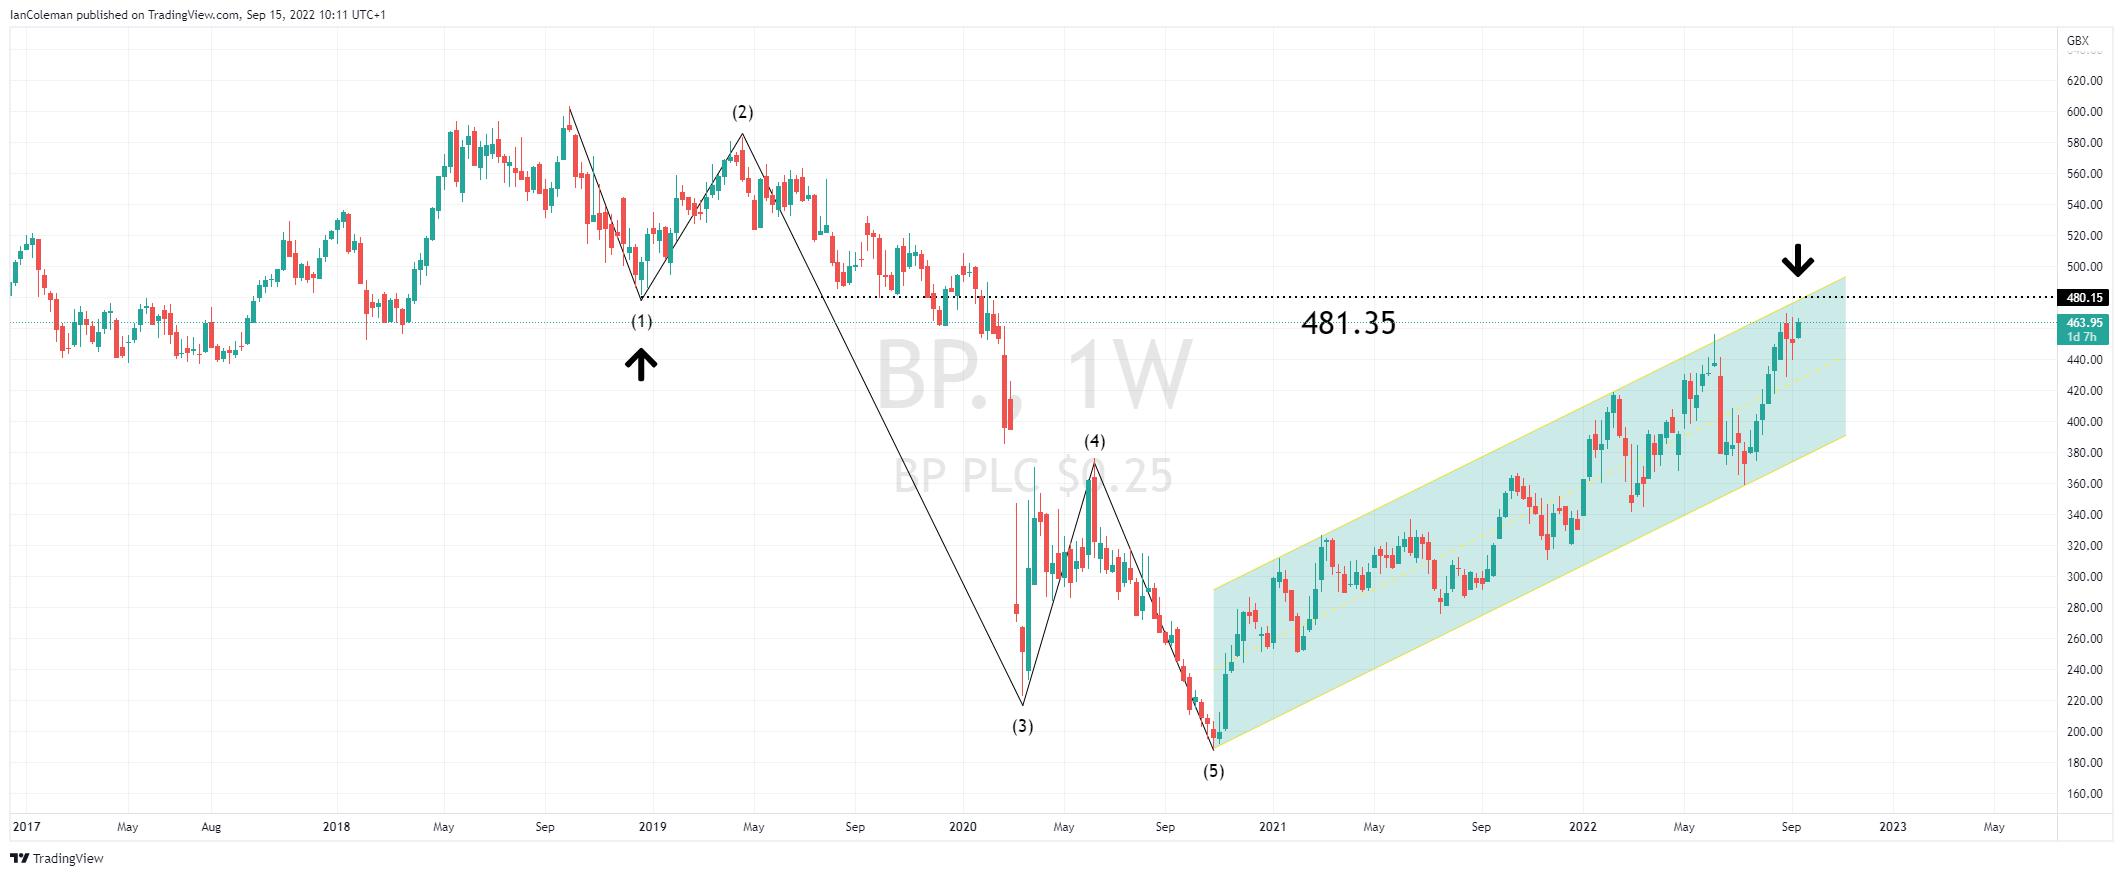
Figure 6 Trading View BP correlation
Will this combined barrier hold back the bullish run. Will this coincide with the 1st of November Earnings Reports? Maybe a level to watch and a product to put on the watchlist.
To learn more about trading shares at Pepperstone click here.
Related articles


The material provided here has not been prepared in accordance with legal requirements designed to promote the independence of investment research and as such is considered to be a marketing communication. Whilst it is not subject to any prohibition on dealing ahead of the dissemination of investment research we will not seek to take any advantage before providing it to our clients.
Pepperstone doesn’t represent that the material provided here is accurate, current or complete, and therefore shouldn’t be relied upon as such. The information, whether from a third party or not, isn’t to be considered as a recommendation; or an offer to buy or sell; or the solicitation of an offer to buy or sell any security, financial product or instrument; or to participate in any particular trading strategy. It does not take into account readers’ financial situation or investment objectives. We advise any readers of this content to seek their own advice. Without the approval of Pepperstone, reproduction or redistribution of this information isn’t permitted.