- English
- عربي
.jpg?height=93&quality=100)
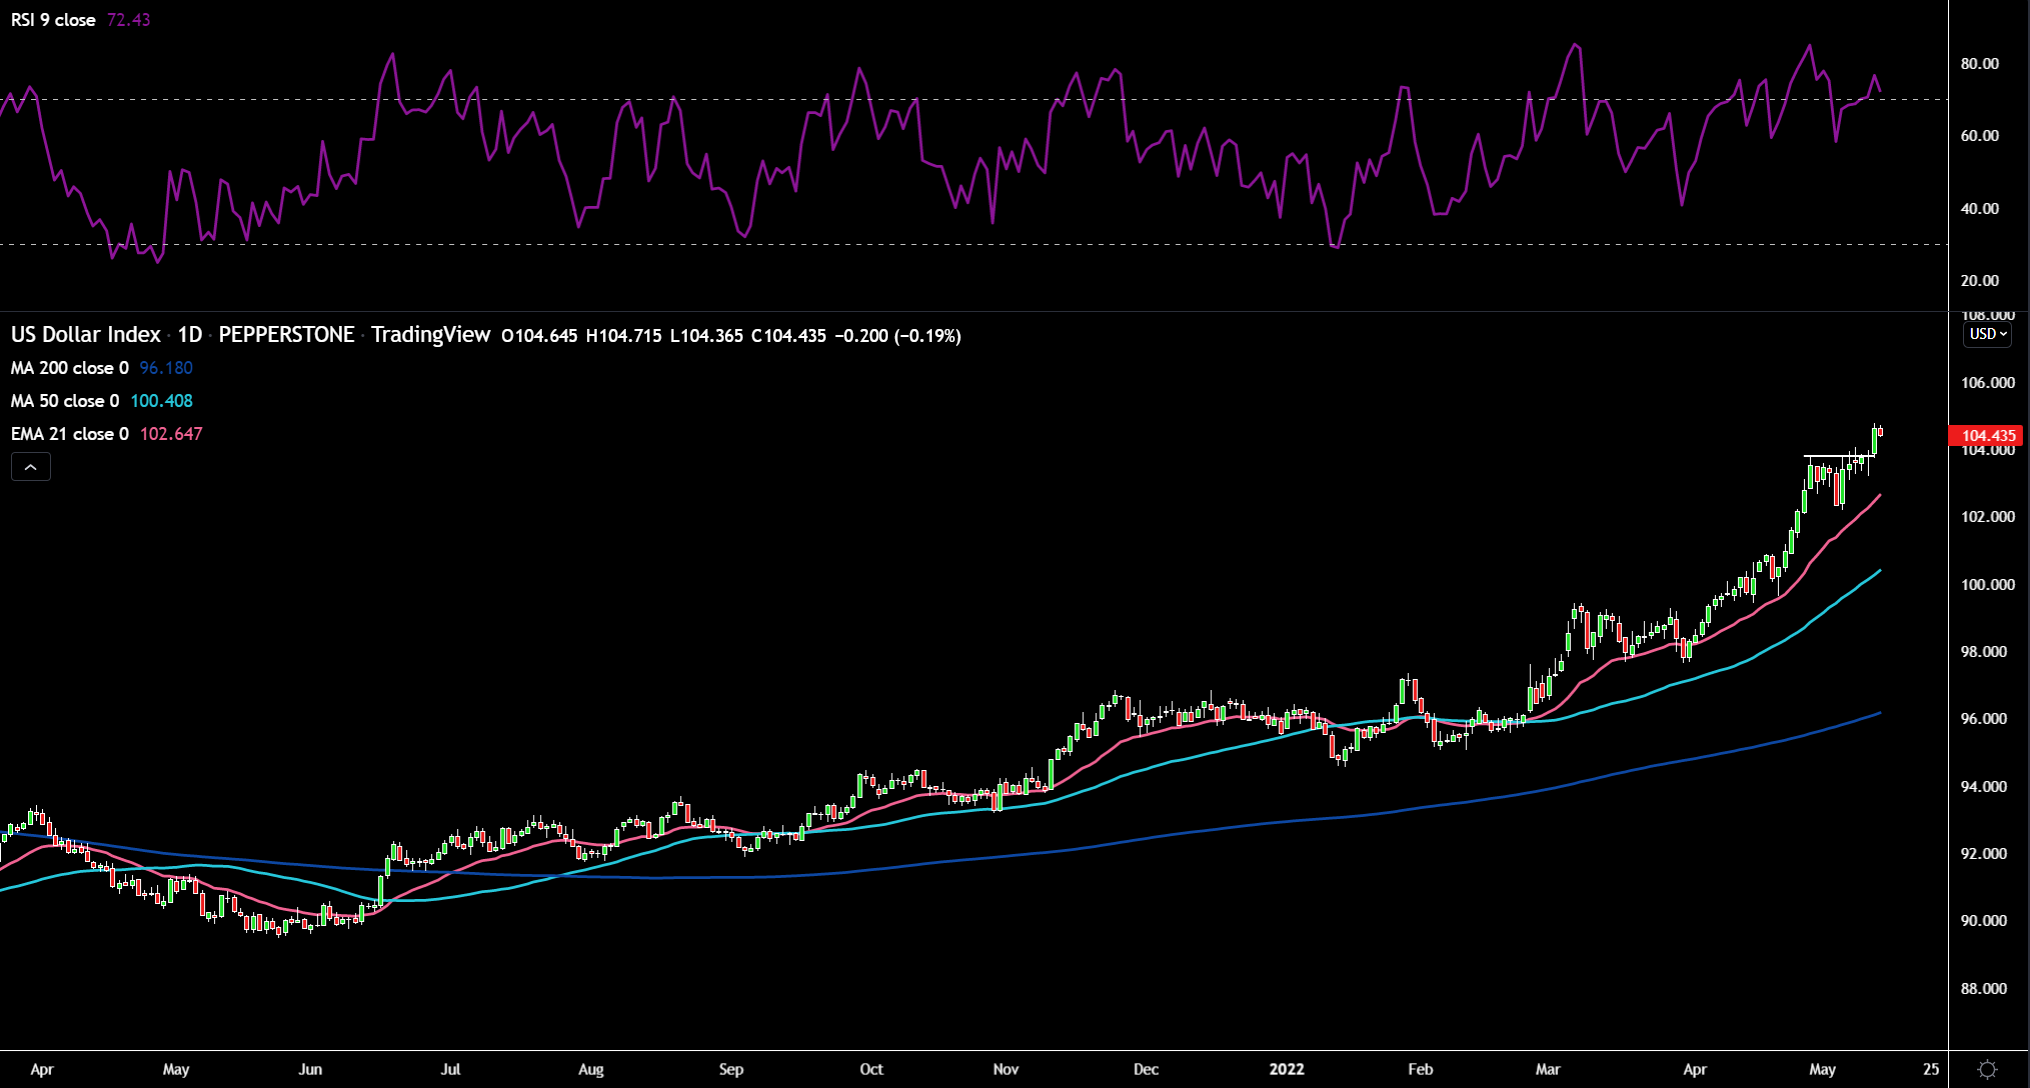
Dollar Index (DXY):
The week got off to a very shaky start with risk-off and aggressive deleveraging the order of the day. Jitters over the global growth outlook saw risk assets such as bitcoin, AUD and the NAS100 were liquidated rapidly. The VIX spiked and US treasuries were bid too. Tuesday did see a minor turnaround, however, the Fed's Mester was on the wires stating the Fed weren’t ruling out a 75bps hike forever. Risk didn’t like this one bit. Wednesday was US CPI day, the marquee risk event for the week. While we did get the much anticipated peak as April figures came in at 8.3% YoY vs 8.5% in March and core also eased from 6.5% to 6.2%, the MoM core figure surged 0.3% points above last month’s figure. Core services are becoming a larger proportion of CPI and the read through of this is more persistence in price pressures. The components responsible for the increases were shelter, food, airline fares, and new vehicles. The acceleration in monthly core CPI means the Fed will stick to their hawkish path by getting rates back to neutral rapaciously.
With CPI out the way, the greenback continues to flex its muscles as it attracts safe-haven flows. Additionally, Bank of America released interesting research that showed Thursday’s and Friday’s have been particularly strong for the dollar from a seasonality perspective. Initial jobless claims were softer than expected coming in at 203k vs 195k expected. Late Thursday night we heard from the main man himself, Jerome Powell, who reiterated that he believes 50bps at the next two meetings is appropriate.
(Source: Tradingview - Past performance is not indicative of future performance.)
The dollar is cooling off a bit as we move into the weekend. It has broken above some stiff resistance at 103.8. The RSI moved into overbought territory. In terms of levels to watch, on the upside 105 would be good to monitor and on the downside, the former resistance at 103.8 as well as the 21-day EMA.
EURUSD:
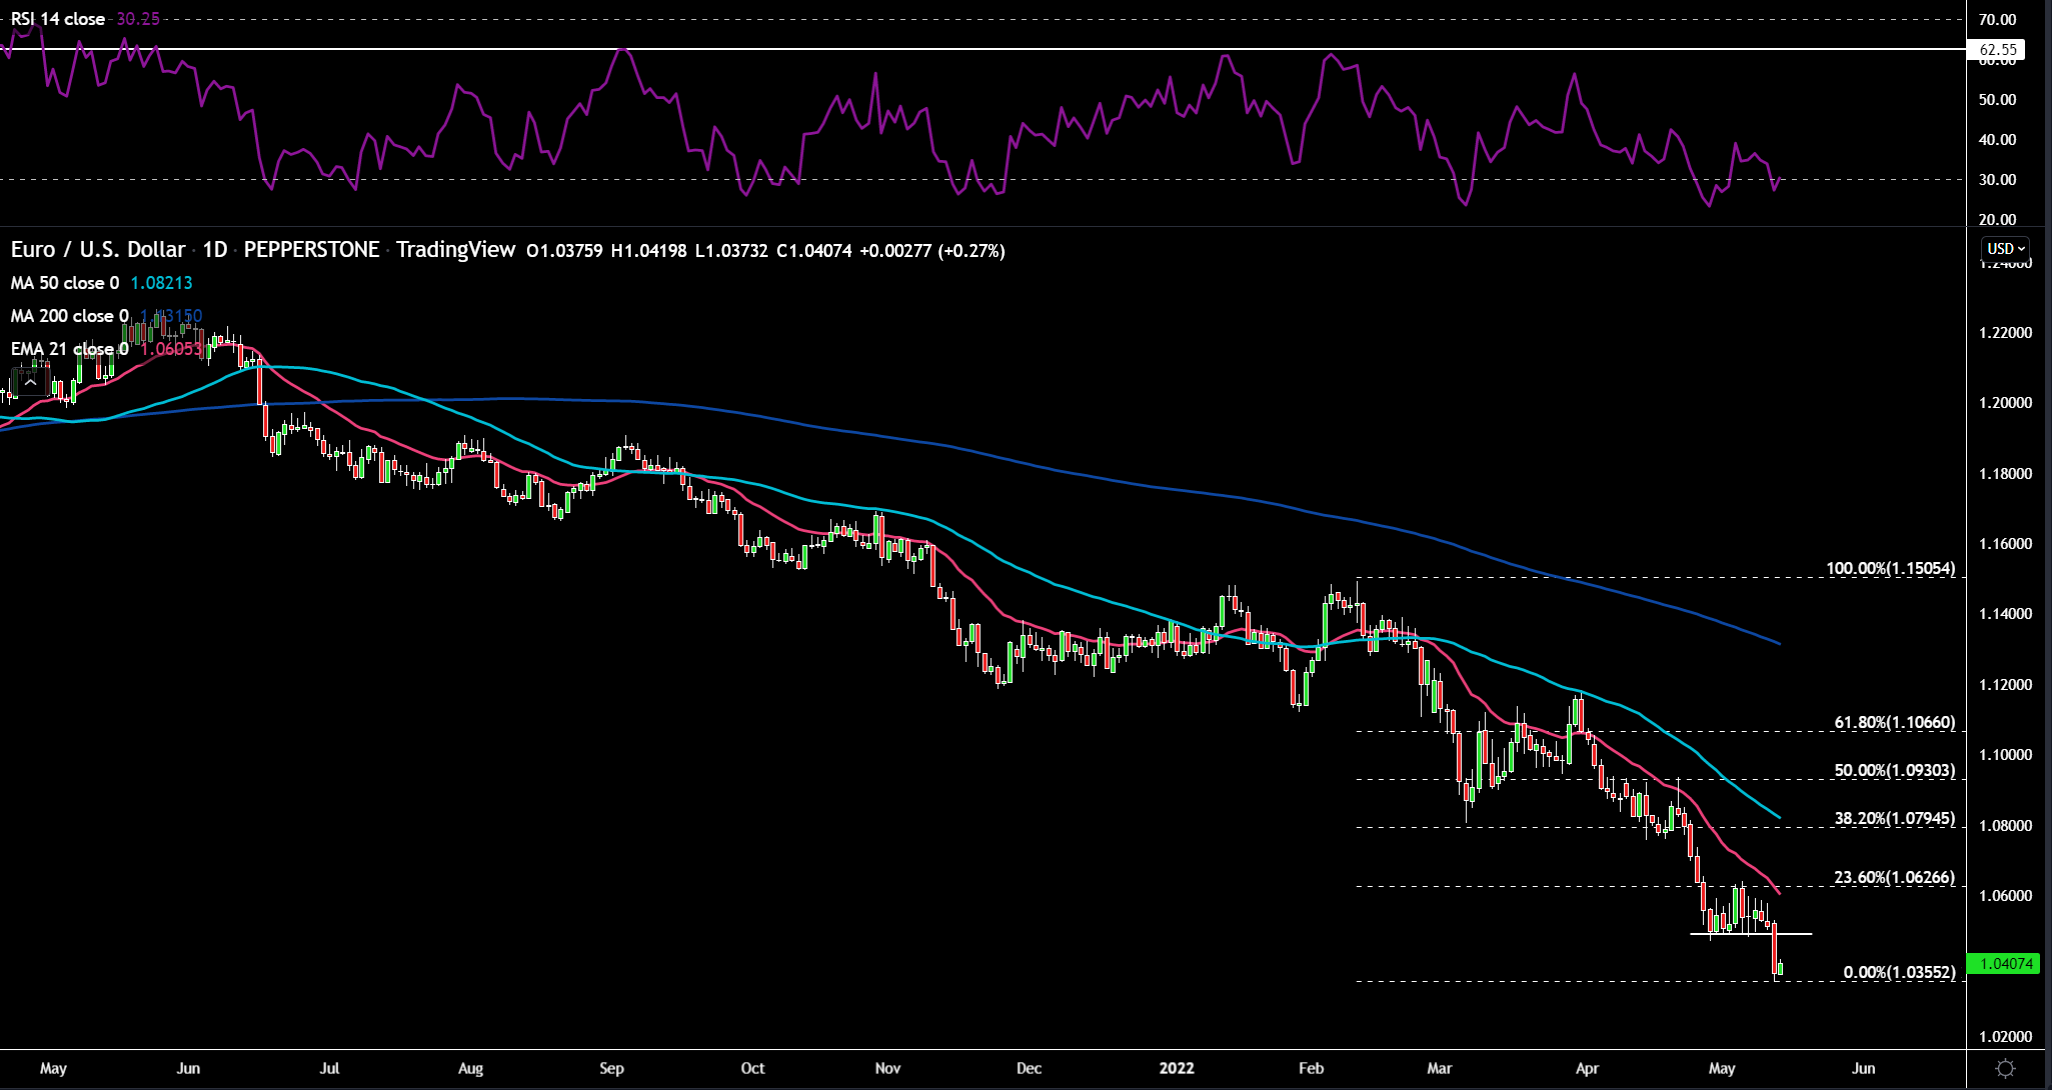
ZEW economic sentiment readings for Germany and the eurozone surprised with an improvement on last month’s recessionary lows. However, the ZEW warned that China’s restrictions will weigh on future GDP growth in Germany. One of the most hawkish members of the ECB, Joachim Nagel, continued the calls from last week for APP to end in June and a rate hike in July. Citi and ABN AMRO are expecting two 25bps hikes in July and September. There were more ECB sources on the wires on Wednesday with ECB officials increasingly seeing rates north of zero this year. We also got the pleasure to hear from President Lagarde herself who stated that APP should end in early Q3 and that rate hikes could come a few weeks after APP is concluded. Many in the market see this as an endorsement of a July rate hike. It would be a tight timeline, but doable. Announce APP is finished at the June meeting and hike on the 21st of July. STIR markets currently assign an 80% probability of a 25bps hike come July. The euro sinks to its weakest since January 2017 against the dollar.
(Source: Tradingview - Past performance is not indicative of future performance.)
EURUSD got to within a whisker of breaching its January 2017 lows at 1.0341. Seeing a slight bounce back into 1.04 today. On the upside moves into the 23.6% Fibonacci level should be watched with the 21-day EMA around there too. There also could be some resistance at 1.05 en route to the 23.6% Fib level. The downside level to watch is the January 2017 low. The RSI is showing some negative divergence with price as it moves out of oversold.
GBPUSD:
Sterling is in a tough spot as the bearish factors continue to build. A too aggressive expectation by markets of the BoE’s bank rate and very ominous economic forecasts already put cable on the backfoot. Now we’re hearing that Foreign Secretary Liz Truss plans to tear up the Northern Ireland Protocol. Dust off the Brexit playbook once again. Her team has briefed The Times on the expected plan. Essentially the draft legislation would remove the Irish Sea border and therefore checks on goods moving from Great Britain to Northern Ireland. Additionally, the jurisdiction of the ECJ would be removed. Truss is keen to declare next Tuesday that talks over. With Sinn Fein winning the Northern Ireland elections, the DUP has refused to form an Executive, especially without any changes to the Protocol. If this sparks a trade war with the EU then a Brexit risk premium will need to be priced in again. News also broke on Wednesday that tax cuts could be announced at the end of July to help the ailing UK consumer suffering from a historic cost of living squeeze.
Sefcovic and Truss had a frosty meeting on Thursday as diplomatic ties remain strained. Sefcovic informed the UK that there was no room to expand the EU’s negotiating mandate. Truss responded by stating that if flexibility was not shown then the UK would have no choice to act. UK Q1 GDP missed expectations of 1% growth, printing at 0.8% and the MoM figure for March declined by 0.1% as opposed to expectations of a flat print. Heading into a stormy Q2, the UK economy needed all the help it could get, not misses. Next week the UK releases more tier one data in the form of employment and inflation stats (7% YoY headline and 5.7% YoY core expected).

(Source: Tradingview - Past performance is not indicative of future performance.)
GBPUSD didn’t sell-off as violently as the euro and some other high beta pairs given last week pulled a bit of that forward. Similarly, to EURUSD, GBPUSD is showing some negative divergence as it tries to creep out of oversold territory. 1.22 is the level to monitor on the downside and 1.24 on the upside.
USDJPY:
The yen is finding some love, despite early week dovish commentary from the BOJ’s Uchida that widening the YCC band would be equivalent to a rate hike and this would not be a positive for Japan’s economic fundamentals. The minutes out early Thursday morning continued to keep the dovish narrative in place as no members had fears over high inflation and didn’t think 2% inflation will be persistent. Nonchalance about the yen’s depreciation and that monetary policy is not appropriate for the management of exchange rates. Lastly, there was nothing on any adjustments to their yield curve target. USDJPY is rolling over aggressively as yen shorts are covered due to risk-off circulating around markets as well as US 10-year yields slumping lower. Next week we’ll receive inflation data for Japan with the market expecting a paltry 1.2% YoY at a headline level.

(Source: Tradingview - Past performance is not indicative of future performance.)
USDJPY found some support at the 21-day EMA and round number of 128. The RSI is a bit in no man’s land. 130 is the handle to watch if price continues higher from here while moves lower would bring 128 back into play.
Gold:
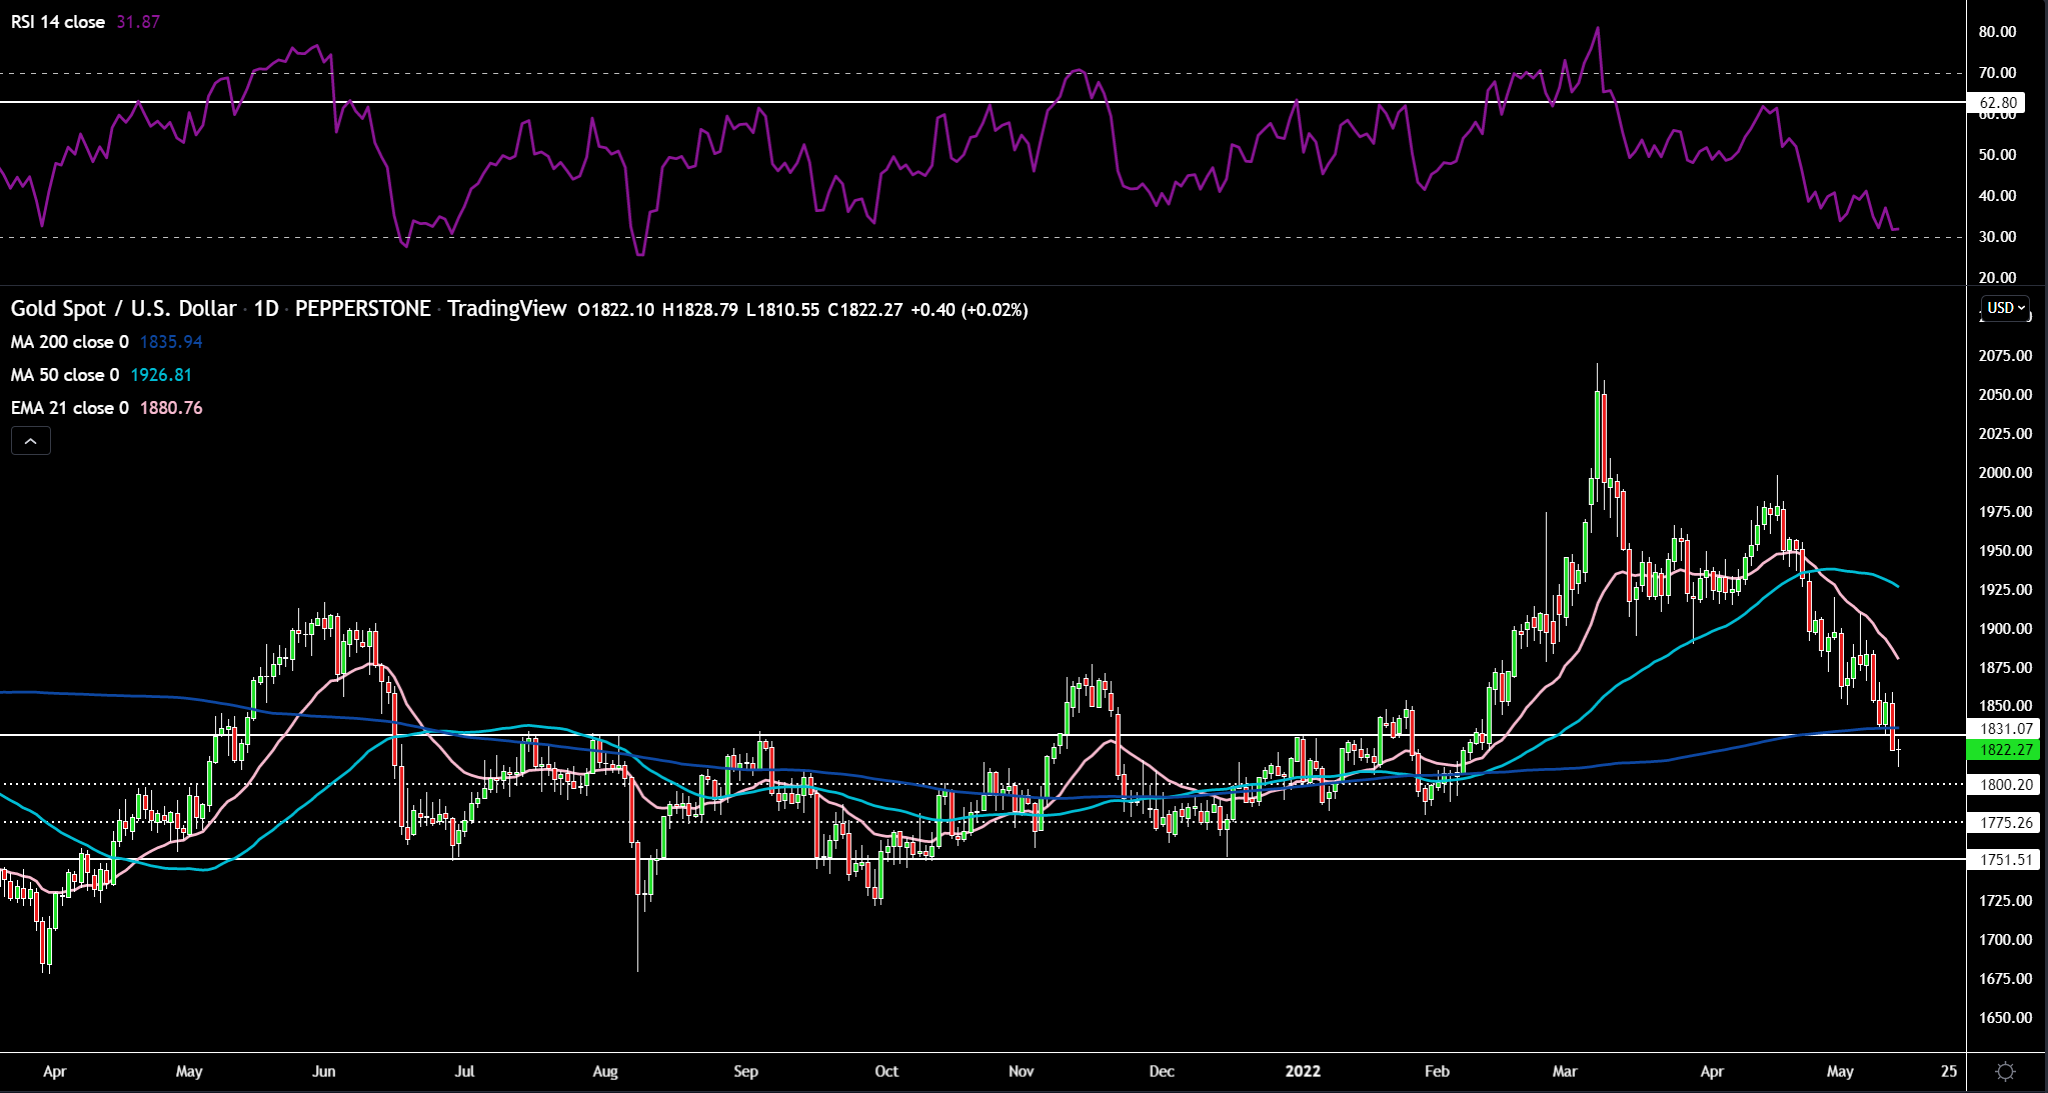
Gold was not on trader’s good side this week as the yellow metal shed around 2% during Monday and Tuesday’s session. There are large ETF holdings that are now underwater and may be driving this selling momentum? It could also be a scramble for cash as equities nosedive. Real yields have remained stable despite yields coming off, this is due to lower oil prices reducing inflation expectations. Gold saw some temporary reprieve after the higher than expected CPI print reduced real yields as well as technically finding support right on the 200-day SMA. Thursday stole all those gains with the yellow metal selling off circa 1.5% as real yields increased and the dollar surged. I also revert back to my earlier thesis, about traders liquidating their holdings in search of the most liquid and safest asset – USD cash. It could also be momentum players such as CTAs pressing gold lower as key technical levels are broken.
(Source: Tradingview - Past performance is not indicative of future performance.)
Gold seems to be putting in a reversal candle after breaching the 200-day SMA and the long standing range resistance from last year at $1830. The RSI is whiskers away from oversold. On the upside, the 200-day SMA and the $1830 level could act as a hurdle to further price gains. Below current pricing, the next major support levels are at $1815 and $1800.
Crude Oil:
Oil plunged as European officials seemed to soften their rhetoric with regards to sanctions on Russian energy and China continued to keep the demand side of the equation in check with their lockdowns. A small geopolitical risk premium was also likely priced out as Putin’s Victory Day speech didn’t reveal any hawkish escalations. Oil also couldn’t avoid the global growth scare like many other risk assets. Wednesday saw a healthy bounce of over 5% as inflation printed hotter than expected, utilising oil’s inflation hedge characteristics. This was despite a very hefty build in US inventory levels. The bulls just managed to push crude into the green on Thursday as conflicting factors filtered through. The bullish factor was news regarding US Iran Nuclear talks with no breakthroughs on the horizon as well as a French Diplomat being pessimistic about a quick resolution to talks. The bearish forces came via risk-off, a stronger dollar as well as OPEC cutting their global demand forecast by 210k bpd.

Source: Tradingview - Past performance is not indicative of future performance.)
Crude trades just under its 50-day SMA and the $110 level. The RSI is in no man’s land. $110 is the big level to clear for the bulls, while $100 is the one for the bears to lean on.
Related articles


Ready to trade?
It's quick and easy to get started. Apply in minutes with our simple application process.
The material provided here has not been prepared in accordance with legal requirements designed to promote the independence of investment research and as such is considered to be a marketing communication. Whilst it is not subject to any prohibition on dealing ahead of the dissemination of investment research we will not seek to take any advantage before providing it to our clients.
Pepperstone doesn’t represent that the material provided here is accurate, current or complete, and therefore shouldn’t be relied upon as such. The information, whether from a third party or not, isn’t to be considered as a recommendation; or an offer to buy or sell; or the solicitation of an offer to buy or sell any security, financial product or instrument; or to participate in any particular trading strategy. It does not take into account readers’ financial situation or investment objectives. We advise any readers of this content to seek their own advice. Without the approval of Pepperstone, reproduction or redistribution of this information isn’t permitted.