- English
- عربي
Analysis
The USD Smile - visualizing why the greenback is a magical currency

The USD is found form once again and is moving higher universally – we can put this down to higher US bond yields, while terminal fed funds pricing has moved towards 5%.
US 5yr real rates have traded in a 1.50% to 2% range since 26 Sept and now at 1.89% are threatening to break out topside - a factor which if plays out would see the USD move further highs and likely see’s the US500 push below 3600.
As most know the USD has been the clear place to be in 2022 – fundamentally, the USD ‘smile’ theory is one that can justify s much of the movement we’ve seen. If we consider the major drivers of the USD the list is extensive, but front of mind are:
- US exceptionalism – the best house on the street
- The best hedge against equity drawdown
- Higher US real and terminal rates
- The Fed almost welcoming a recession
- Carry (income) – get paid to play defence
- Fed QT impacting US and global financial conditions
- US housing less impacted by rates than other countries (Aus and UK for example)
- Momentum & trend
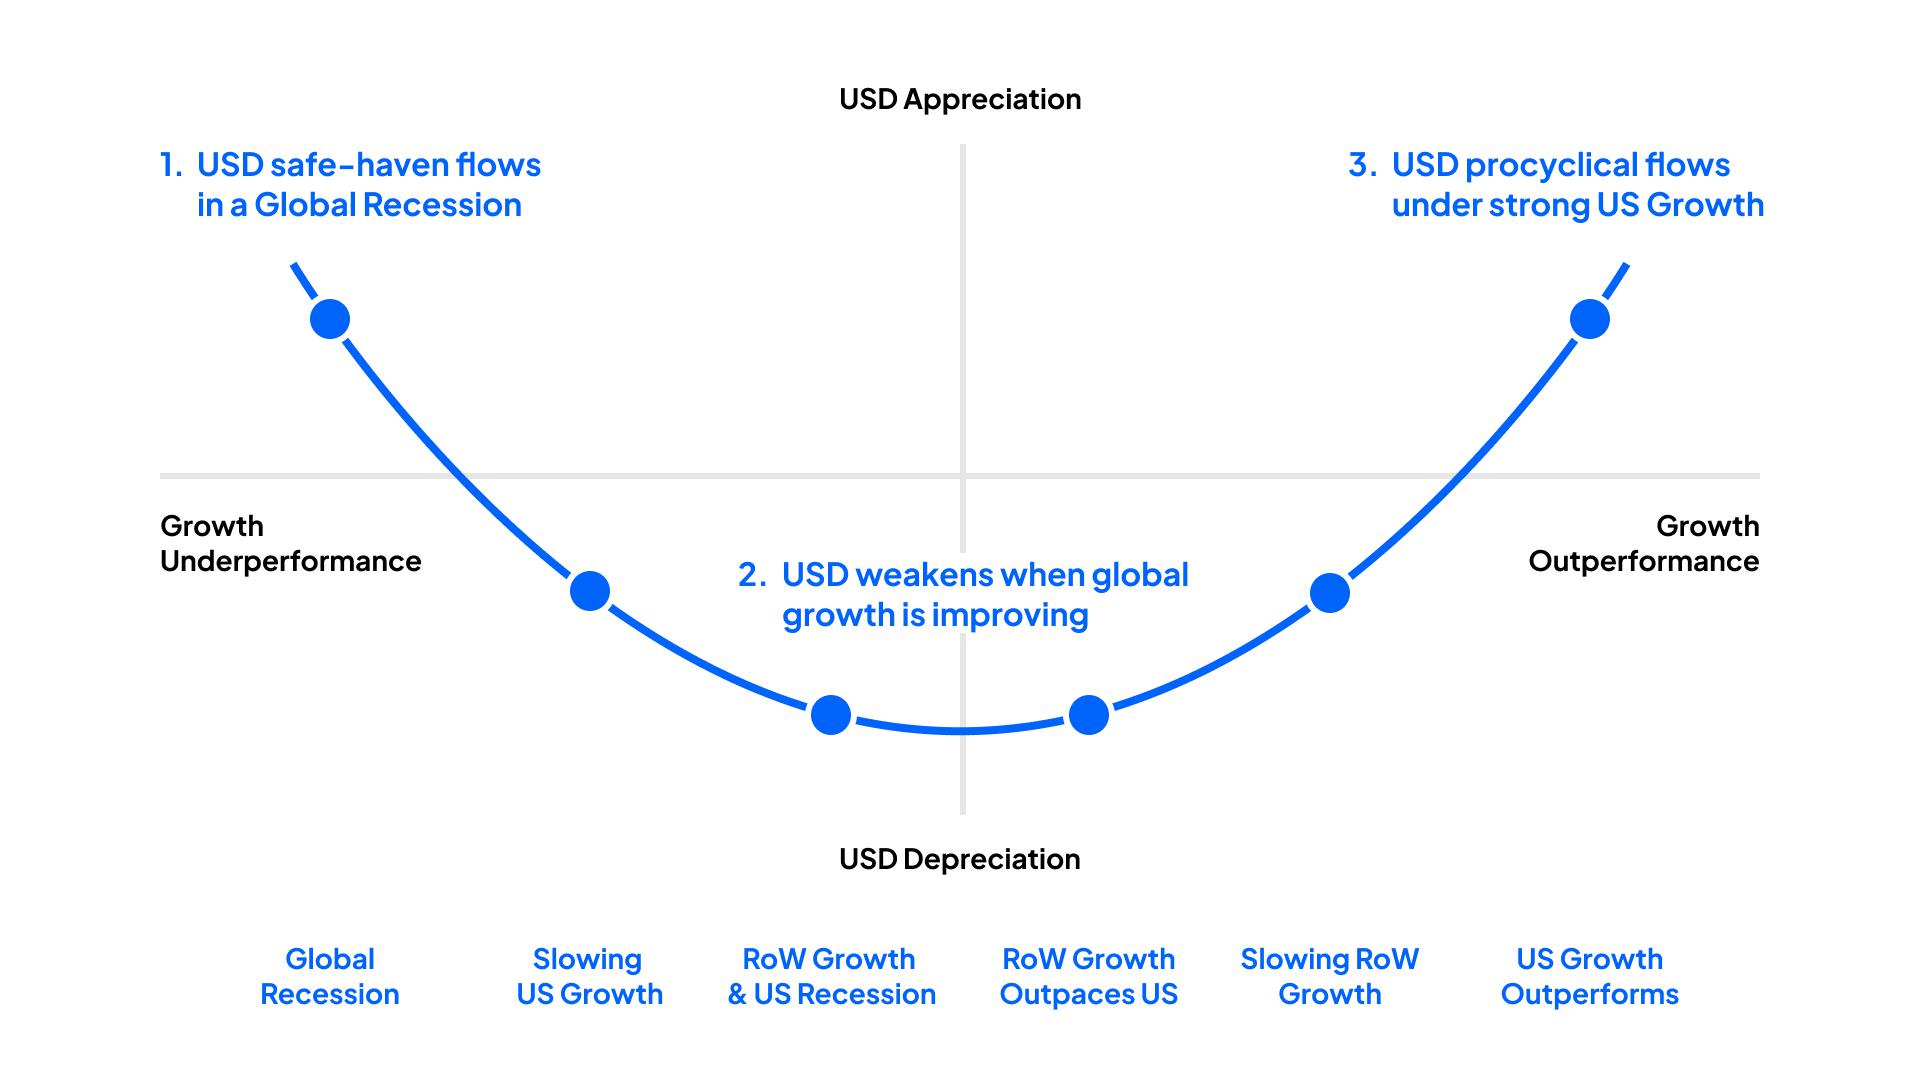
If we look at these variables and apply them to the USD ‘smile’ theory, we see that both sides have worked positively for the USD.
The left side, which shows the USD working as risk aversion flows and concerns of deteriorating global growth hit home. On the right side, we’ve also seen signs that US data has held up better than other geographies, and this has seen the USD work as the ‘exceptional’ play.
Perhaps the preferred way to look at the absolute quality of the USD is in this chart – here I’ve taken two key inputs from the ‘major drivers’ list to showcase the USDs attraction.
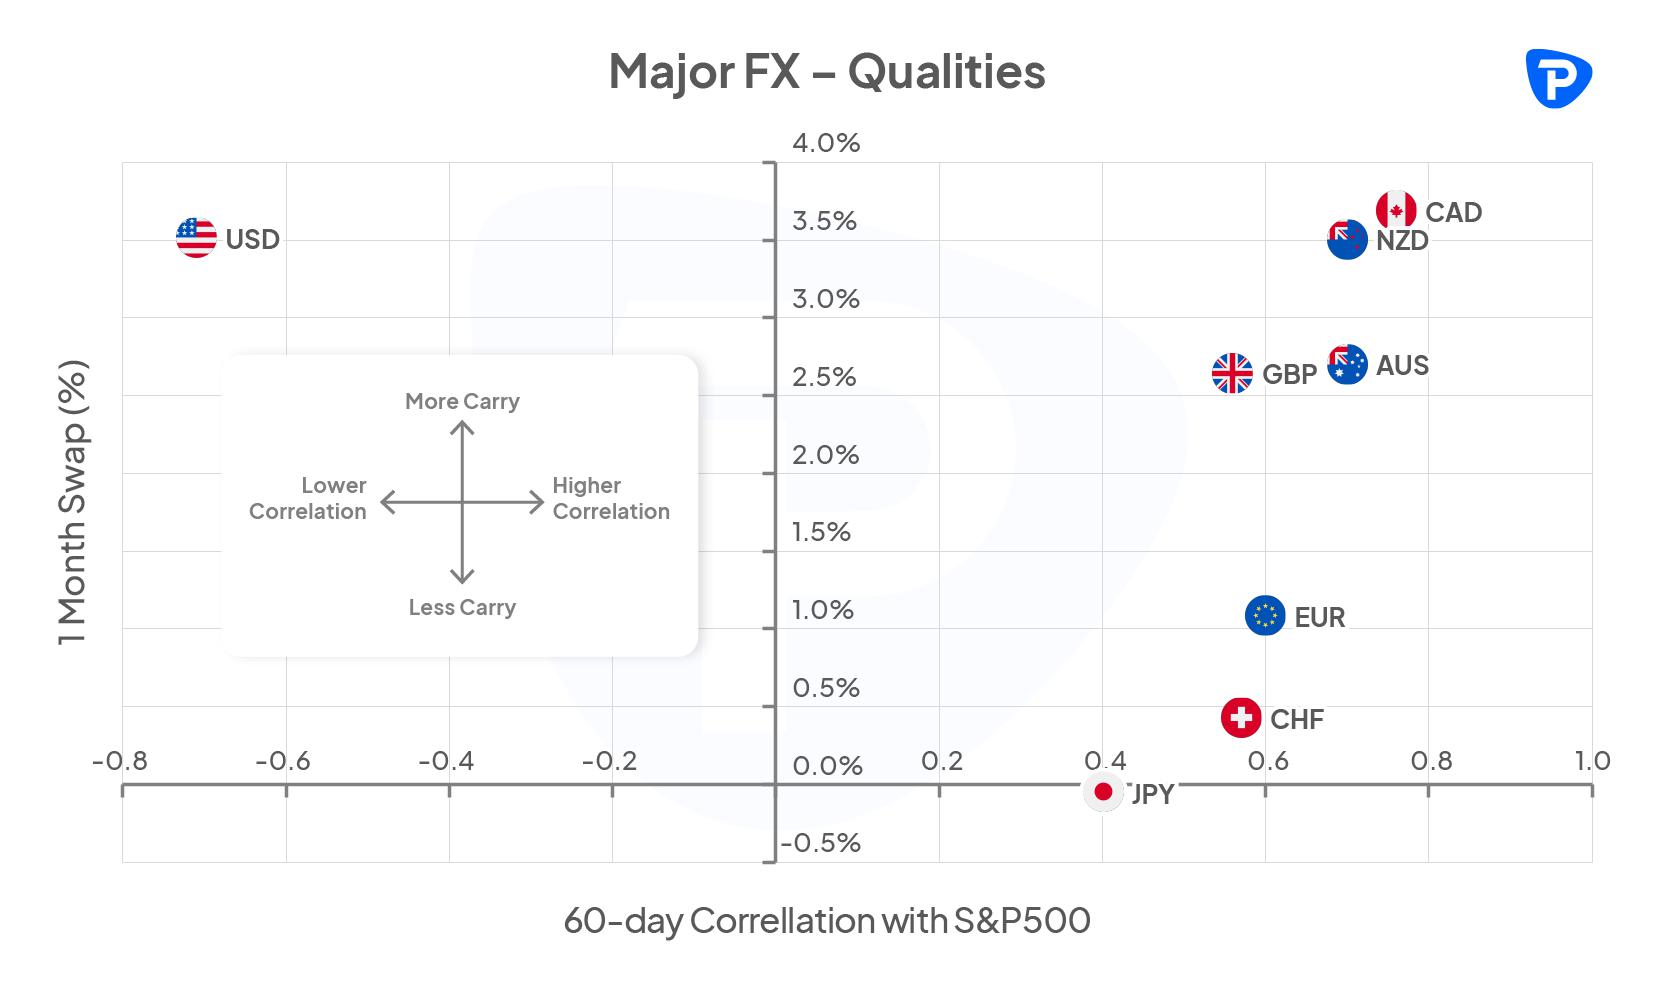
On the Y-axis we see the 60-day correlation with the S&P500 and on the X-axis we see the 1-month swap - we’ve used this to show the income received from a cash like product. What we see is the USD is the only G10 currency with a negative correlation with the S&P500.
We also see the USD offers some of the highest levels of carry (income), with cash-like returns rivalling that of Canada and New Zealand. Funds are effectively getting paid to play defence – what’s not to like??
Correlations come and go, but unless we see a sustained turn in the equity market, global growth looks to bottom and the Fed offer a stronger indication of a ‘pivot’, then this model shows why funds are so keen to gravitate to the USD.
Related articles

The material provided here has not been prepared in accordance with legal requirements designed to promote the independence of investment research and as such is considered to be a marketing communication. Whilst it is not subject to any prohibition on dealing ahead of the dissemination of investment research we will not seek to take any advantage before providing it to our clients.
Pepperstone doesn’t represent that the material provided here is accurate, current or complete, and therefore shouldn’t be relied upon as such. The information, whether from a third party or not, isn’t to be considered as a recommendation; or an offer to buy or sell; or the solicitation of an offer to buy or sell any security, financial product or instrument; or to participate in any particular trading strategy. It does not take into account readers’ financial situation or investment objectives. We advise any readers of this content to seek their own advice. Without the approval of Pepperstone, reproduction or redistribution of this information isn’t permitted.