- English
- عربي
Strategy sessions - momentum signals offering new opportunity

Certainly, the JPY crosses are flashing up and we see bullish breakouts in CADJPY, NOKJPY and strong upside in EURJPY, AUDJPY and NZDJPY. CADJPY is the interesting one as we’ve hit new trend highs, but many question if it holds, the Elliot Wave heads are offering this chart which suggests we may be approaching a shorting opportunity.
CADJPY Daily chart
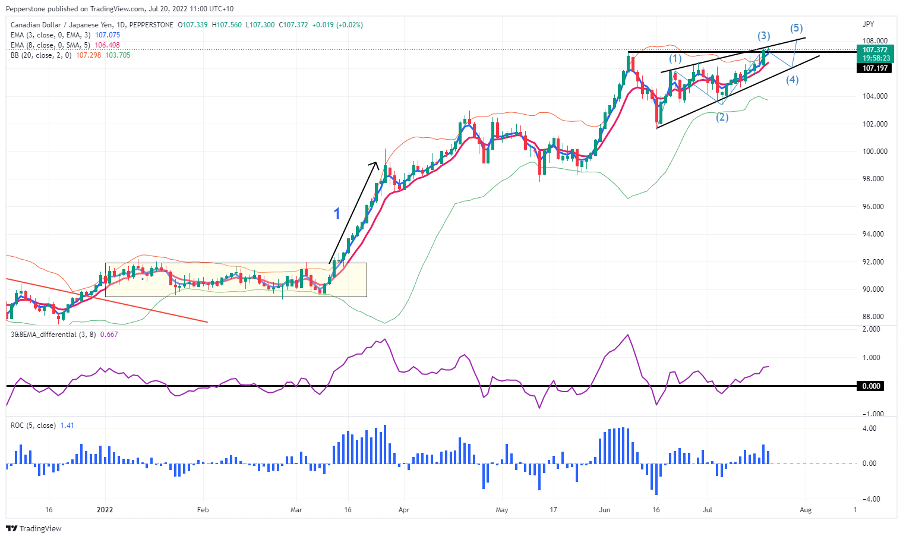
(Source: TradingView - Past performance is not indicative of future performance.)
My momentum rules dictate that when it breakout and as long as other variables are aligned, then you hold until stopped out or get an exit signal – as we saw back in March (indicated with “1” on the chart) where price broke out of a tight range it wasn’t until 25 April that we had an exit signal, even though we saw negative momentum in late March – with momentum and trend, as many know, you can have a low hit rate, but have a ‘positive skew’, which essentially means I’ll have lots of small losses, but you get big outliers.
This is where we can adopt a systematic approach – we can automate this approach, but I personally like to trade discretionary. But the rules are the rule, and I like a breakout – a Donchian channel helps there, with a 20-day look-back period. I apply a Bollinger Band and specifically like when the bands squeeze together through a period of low range – the longer the range the better and we then want price to hug the upper band. If the signal is long, I want to see the 3-day EMA above and to pull away from the 8-day EMA – some use the 10-day, but I’ve found the 8-day works and have set this as a script in TradingView which you can see in the middle pane.
There is no better momentum indicator than ROC (rate of change), and naturally, this needs to be positive and ideally rising – you can have falling momentum in a bullish trending market.
Again, we come back to our friend the interest rate markets – with equities catching a bid, implied volatility dropping a touch and talk of the ECB hiking by 50bp tomorrow, we see interest rate differentials working against the JPY. When bond yields fall it validates the stance of the BoJ and the JPY outperforms – so for those who think now is the time to be long duration, then the JPY is probably a tactical buy, and that may happen if equities turn lower and commodities take another leg down – that may not happen though and price will dictate, it is the final arbiter of truth.
Outside of the JPY, I see Bitcoin has had a run and may be seeing the start of a more pronounced momentum move, perhaps turning into a trend as well. Ethereum had a solid run but is seeing supply into the May lows, but for now, I hold a bullish bias. We’re seeing bullish ST momentum in GER40, although the risk events this week (Draghi’s confidence vote, ECB meeting and Nord Stream 1 decision) make position sizing absolutely key – again, there are rules around correct sizing and mostly aimed at adjusting to volatility. The AUS200 could be in the early throws on a breakout above 6743 as well, so I have alerts here.
AUS200 Daily chart
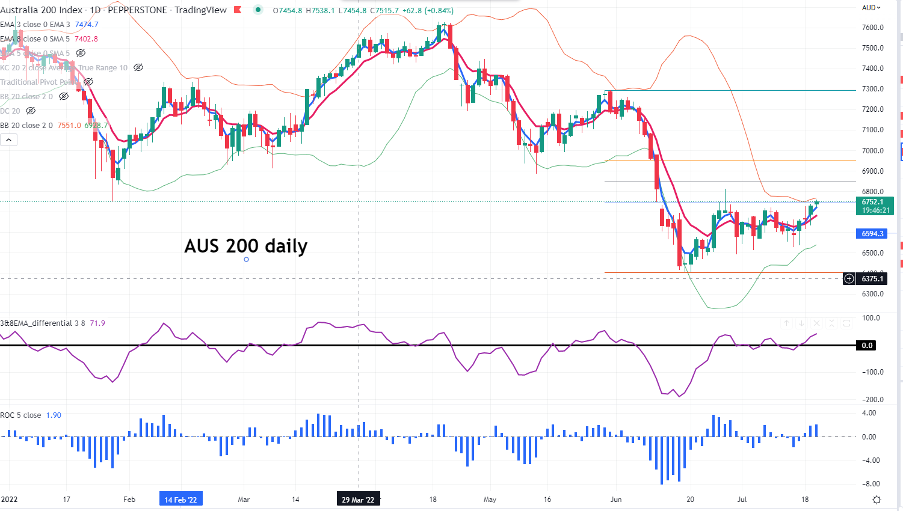
(Source: TradingView - Past performance is not indicative of future performance.)
This is all from the daily timeframe which many find too slow – the 4 hour is my preferred timeframe, but this works on all timeframes. Here is a slide I put together for a webinar on strategy building.
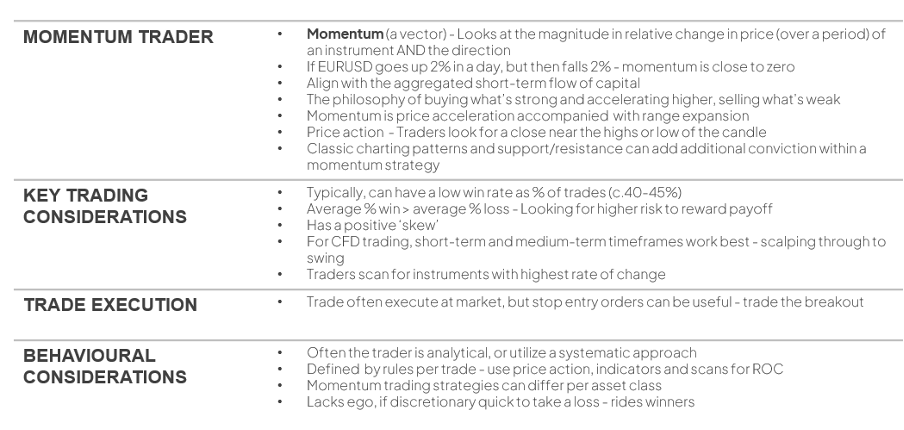
(Source: Pepperstone - Past performance is not indicative of future performance.)
Related articles
.jpg?height=420)

Ready to trade?
It's quick and easy to get started. Apply in minutes with our simple application process.
The material provided here has not been prepared in accordance with legal requirements designed to promote the independence of investment research and as such is considered to be a marketing communication. Whilst it is not subject to any prohibition on dealing ahead of the dissemination of investment research we will not seek to take any advantage before providing it to our clients.
Pepperstone doesn’t represent that the material provided here is accurate, current or complete, and therefore shouldn’t be relied upon as such. The information, whether from a third party or not, isn’t to be considered as a recommendation; or an offer to buy or sell; or the solicitation of an offer to buy or sell any security, financial product or instrument; or to participate in any particular trading strategy. It does not take into account readers’ financial situation or investment objectives. We advise any readers of this content to seek their own advice. Without the approval of Pepperstone, reproduction or redistribution of this information isn’t permitted.