- English
- عربي
Is market volatility your friend or foe? The importance of market flexibility

April economic news results will be key
March was a month of new market records and most were not good for the global economy. The VIX (volatility index) spiked above 80 for the first time since the GFC (global financial crisis) and this was all before anyone even knows the real economic impact that the global pandemic shutdown has caused.
April will be the month where traders start to see the impact of economic news in key output fundamentals for the month of March when the shutdowns started. Based on the first unemployment figures in the US, the 2 Trillion plus stimulus bill and other relief packages are all desperately needed. For the week ending 27th March, US unemployment claims skyrocketed towards 9.95 million, a figure that is equal to over 10 months’ worth of normal unemployment claims, and it has only happened in a few short weeks. With some preliminary figures already released, it’s clear April will certainly be another month of high volatility, so is this volatility your friend or foe as a Trader?
Trading volatility spikes in the VIX
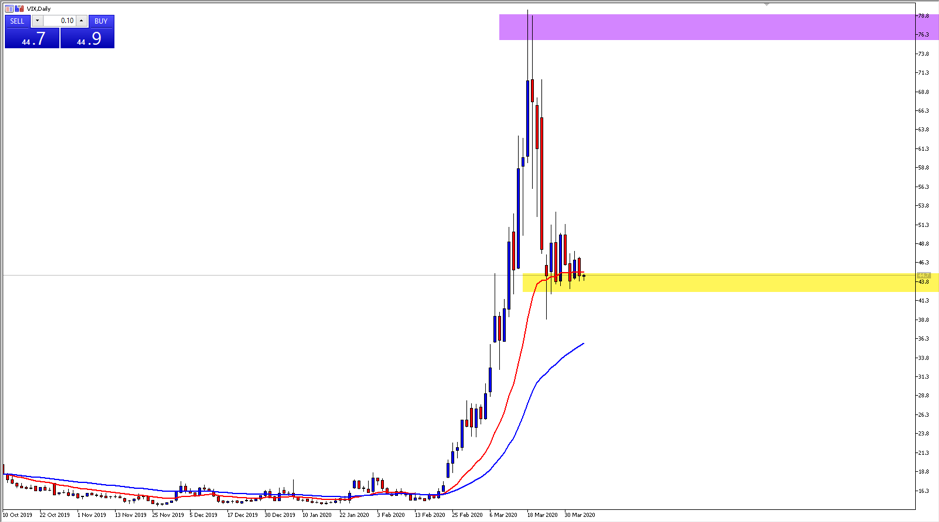
In a recent article, it was explained that if the VIX moved above 25, traders should consider their current strategies and potentially look to modify their expectations in light of extreme and sometimes incredibly volatile moves. It’s important to be market adaptive during these times, and just a quick look at the VIX chart above shows that the ‘FEAR’ in the market is still very real. The VIX is currently consolidating at a new support level just above 40 (highlighted in yellow) and depending on the April economic data, expect this indicator to remain high, and for the big moves to continue.
The key to trading volatile markets is to be adaptive, and moving your technical strategies to lower timeframes may present more opportunities.
S&P 500 rallies but is it a dead cat bounce?
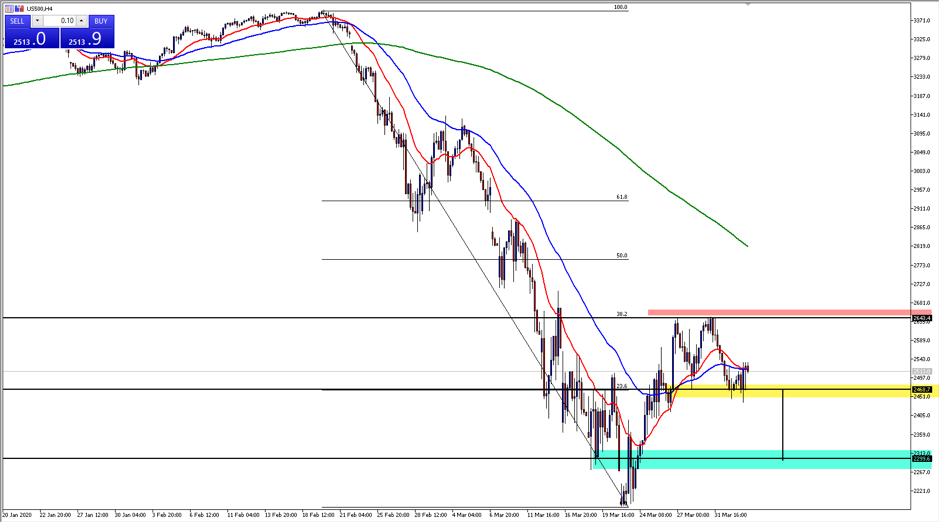
The chart above shows the S&P 500 futures pulling back to what could be described as a ‘dead cat bounce’. This is also a move to the 38.2 Fibonacci retracement level of the entire bear market movement. If price closes below the area highlighted in yellow, a double top formation will be confirmed, with the area highlighted in green becoming the next technical target around the 2300 level.
USDX 4hr inverse head and shoulders
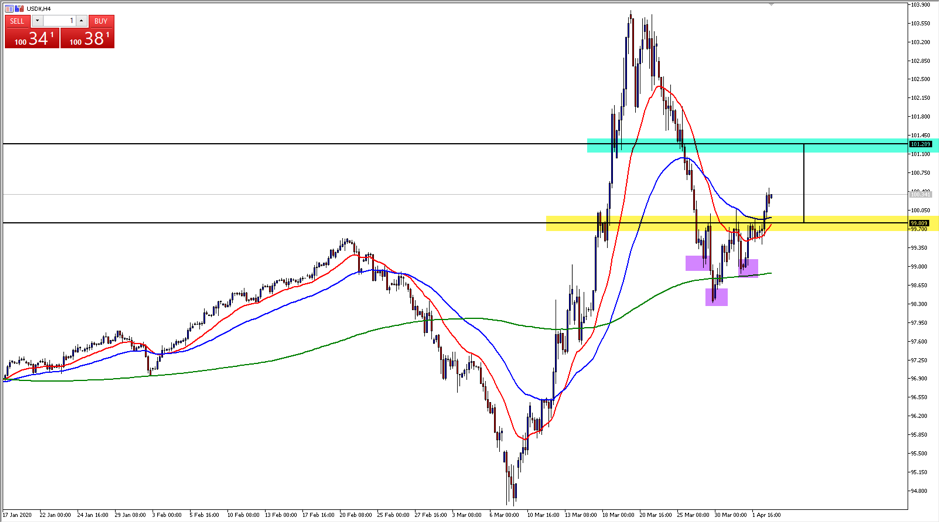
Below is an example of an inverse Head & Shoulders pattern where the right shoulder is almost equal to the left, or almost symmetrical. Another nice technical pointer in this trade was where the USDX broke past the neckline (The yellow highlighted area in the chart above) which was the psychological level of 100. This break is being followed by a potential cross of the 20 (EMA) and 50 (EMA) in the direction of the trade, providing a volatile but sound role reversal opportunity to enter the trade long, with a technical pattern distance expectation to the 101.28 area if price was to retrace to the neckline.
EURUSD 4hr head and shoulders
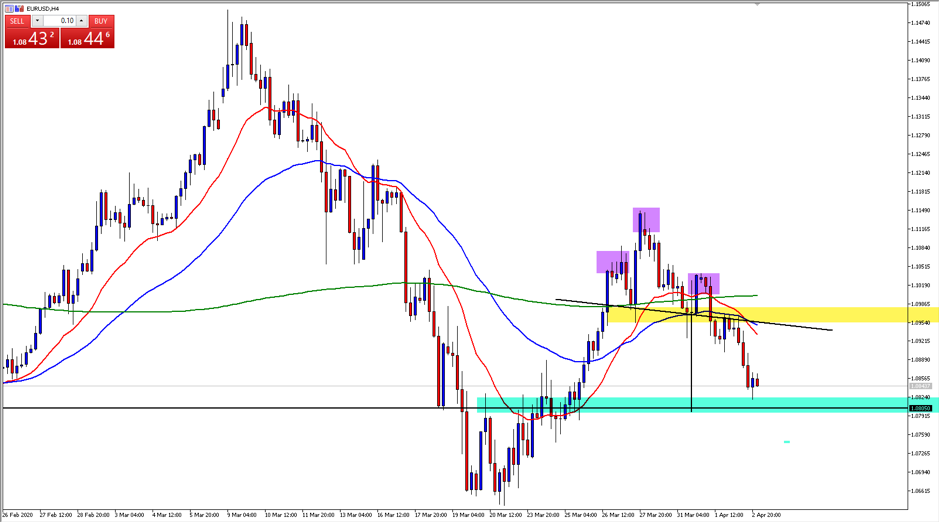
As has been mentioned in previous articles, what happens on the USDX generally occurs inversely on the EURUSD. Above you can see another Head and Shoulders pattern with a break of the neckline (The yellow highlighted area), followed by a cross of the 20 (EMA) and 50 (EMA) which generally occurs after the break has happened. The important thing to note in this example is that the leading indicator during times of uncertainty and fear is price action. Often moving averages will lag too heavily during these sharp moves and it’s important to be able to recognise patterns and support/resistance areas.
EURUSD 15 min roll reversal opportunities within larger timeframe patterns
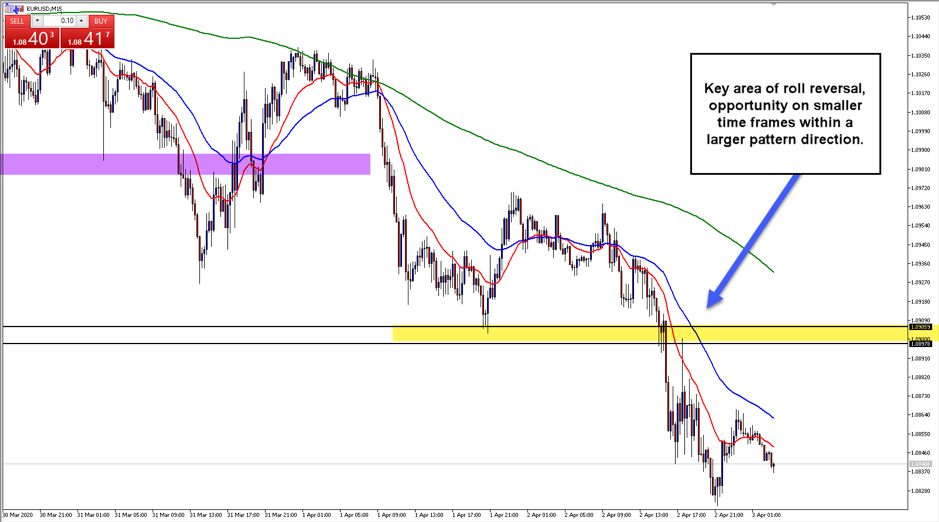
The chart above shows the break of the head and shoulder technical pattern neckline at the area highlighted in purple. As price action is a key leading indicator, when a pattern is spotted on a larger timeframe, the potential for moving down timeframes and day trading/scalping smaller movements in the larger direction of trend becomes an opportunity. The area highlighted in yellow shows a zone where previous support becomes resistance in the direction of the larger timeframe head and shoulders pattern.
The importance of recognising opportunity during times of uncertainty
The great thing about volatility is undoubtedly the opportunities it presents to traders. The key during these times is to stick to your trading rules and remain vigilant around economic news for the specific instruments you are trading, especially during the month of April. When a pattern or level is broken on a specific pair, the aggressive nature of how the market is currently moving gives traders the opportunity to look at smaller timeframes such as the EURUSD 15 minute example above, and use technical theories such as roll reversal and Fibonacci retracements to trade in the direction of the larger timeframe patterns.
Ready to trade?
It's quick and easy to get started. Apply in minutes with our simple application process.
The material provided here has not been prepared in accordance with legal requirements designed to promote the independence of investment research and as such is considered to be a marketing communication. Whilst it is not subject to any prohibition on dealing ahead of the dissemination of investment research we will not seek to take any advantage before providing it to our clients.
Pepperstone doesn’t represent that the material provided here is accurate, current or complete, and therefore shouldn’t be relied upon as such. The information, whether from a third party or not, isn’t to be considered as a recommendation; or an offer to buy or sell; or the solicitation of an offer to buy or sell any security, financial product or instrument; or to participate in any particular trading strategy. It does not take into account readers’ financial situation or investment objectives. We advise any readers of this content to seek their own advice. Without the approval of Pepperstone, reproduction or redistribution of this information isn’t permitted.