- English
- عربي

DXY – consolidation for now but for how long?
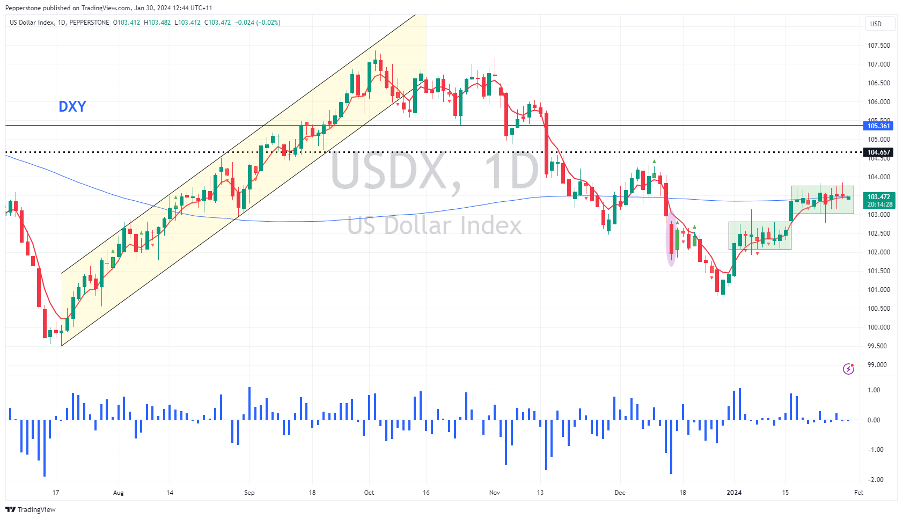
If we take the DXY as a proxy of the USD, we see the market is not convinced to make a collective move with price tracking a range of 103.85 to 103.00. This makes sense given the tier 1 event risk in the week ahead, with the FOMC meeting, US Treasury QRA, EU CPI and US NFP as drivers. In theory, the longer the consolidation the more powerful the likely breakout and the greater the potential for trending conditions on the higher timeframes. As we look ahead, to set a platform we have just seen the US Treasury project borrowing requirements for Q1 of $760b and $202b for Q2 – this level of borrowing from the private markets is lower than market expectations and it speaks to higher tax receipts from April. A lower funding task is positive for risk assets (equity) as it presumably means less stress on the funding markets. The market has initially sold the USD on this as US bond yields fell, but this could easily reverse if the market pushes out its timeline for a QT taper – consolidation for now, but the longer this plays out the stronger the potential break.
NAS100 – over-owned but hard to short

You just can’t keep the US equity market down – at least for now – where trend and momentum indicators suggest the higher probability outcome is we see 5000 in the US500 and 18k in NAS100 - although with such a wide array of risk events in play this week that call is far from certain. In the session ahead we see earnings from Microsoft, AMD, and Alphabet, so it could get lively after the NAS100 cash close, as traders react to the outlooks and guidance. Both names need close attention given they command the first and third biggest weight on the NAS100. The options market implies a move in Microsoft on the day of 4.3%.
AUS200 – 7632.8 in our sights
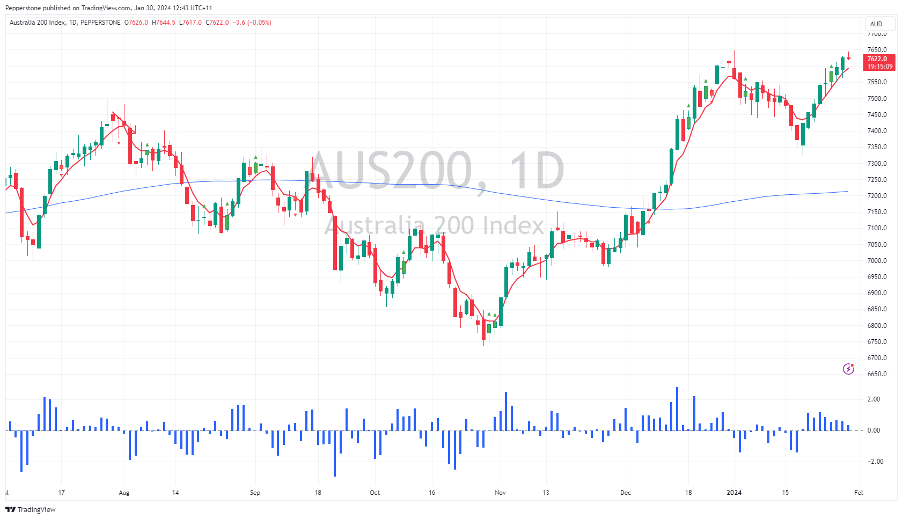
While the AUS200 revisits the all-time highs set in Aug 2021, the index absorbs a positive mix of sentiment towards global risk, as well as local factors, and many question if this time around we see the illustrious bullish break the bulls are positioned for. While global macro issues remain paramount, one catalyst to look towards is ASX200 1H24 earnings, with Amcor kicking the season into gear (6 Feb) and JBH (due 12 Feb) one that CFD traders will be keen to focus on. CSL (13 Feb) and CBA (14 Feb) report shortly after and both could influence sentiment with their outlooks. The Aussie banks are driving the market from an index points perspective, with materials also finding form. Importantly, we see the ASX200 bank index is flying high at present and until we see the bullish tape in the banks give way, index volatility will remain subdued, and traders will be skewed to buy weakness in the Aussie equity index.
EURNZD – expressions of EUR shorts
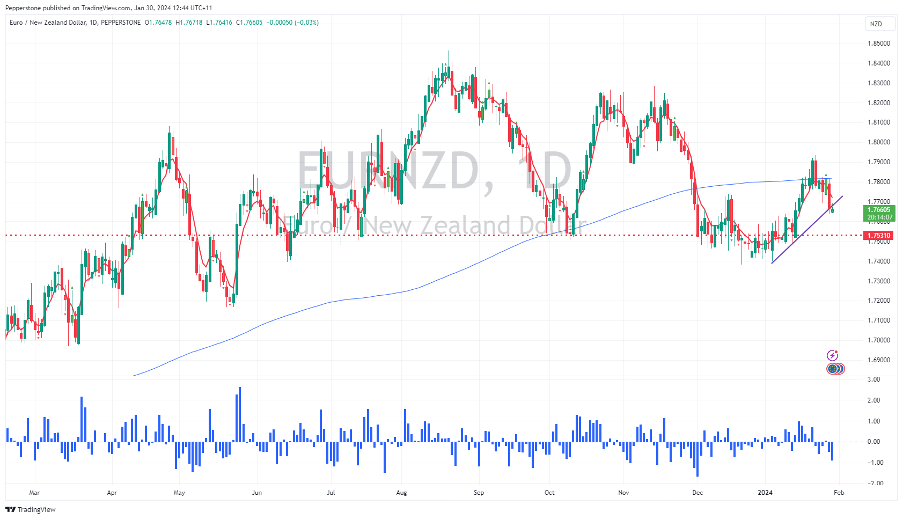
After a rally into 1.7935, the structure in the flow and the set-up has changed, and the sellers are starting to dominate. We’ve seen a daily close through the rising uptrend (drawn from the Jan lows), with a strong rejection of the 200-day MA. Fundamentally we’ve heard a more hawkish assessment today from the RBNZ chief economist Paul Conway that “non-tradeable inflation was higher than expected” and “is a long way from 2%”. ANZ Bank is now even saying that a 25bp rate hike from the RBNZ on the 28 Feb meeting can’t be ruled out. Contrast this to expectations of ECB policy, with the ECB opening the door to cuts from the March meeting and the balance of risk is skewed to lower levels. This Thursday’s EU CPI print (at 21:00 AEDT) could have significant implications for EUR pairs, so monitor exposures over this data. A core CPI print below 3% opens the prospect of a 25bp cut at the March ECB meeting, although April is still the default date starting point.
Nat Gas – welcome to the Wild West
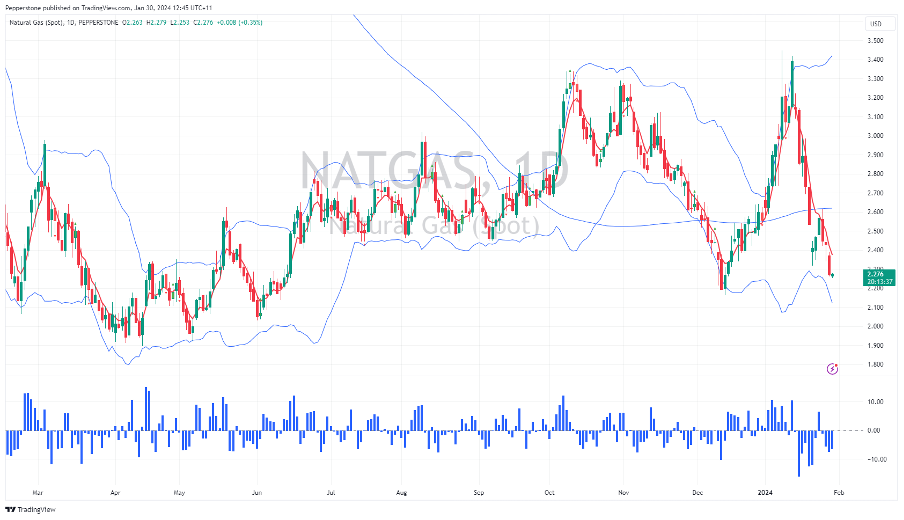
We’ve seen strong interest from clients to trade NG from the long side, with price now coming into the December lows of $2.16. It’s been quite the ride, where on 12 Jan we saw price failing to push past the October highs and reversing all the way back to current levels. Looking at NG's 10-day realised volatility we can see this now at 124%, and this has clear implications on position sizing, as the moves away from the average are punchy. Can the lows hold and provide a floor with longs hoping for a snapback? A break of $2.16 could be significant.
Related articles
.jpg?height=420)

The material provided here has not been prepared in accordance with legal requirements designed to promote the independence of investment research and as such is considered to be a marketing communication. Whilst it is not subject to any prohibition on dealing ahead of the dissemination of investment research we will not seek to take any advantage before providing it to our clients.
Pepperstone doesn’t represent that the material provided here is accurate, current or complete, and therefore shouldn’t be relied upon as such. The information, whether from a third party or not, isn’t to be considered as a recommendation; or an offer to buy or sell; or the solicitation of an offer to buy or sell any security, financial product or instrument; or to participate in any particular trading strategy. It does not take into account readers’ financial situation or investment objectives. We advise any readers of this content to seek their own advice. Without the approval of Pepperstone, reproduction or redistribution of this information isn’t permitted.