- English
- عربي
Daily Fix: Brexit draft deal in the works, but questions remain

Our largest flow has centred on GBP, EUR and gold, although we’ve seen some interest in GBPJPY which has gained a punchy 1.8% - the big mover in G10 FX, with GBPAUD (+1.7%) just behind. GBP implied volatility has ramped up, with GBPJPY and GBPUSD 1-week IV hitting the top of the 12-month range and again this a major consideration for position sizing. GBPJPY has now rallied 6.6% since breaking the inside bar seen on the 10thand has closed the session above the 200-day MA.
GBPUSD has put on nearly six big figures since finding a floor at 1.22, and like GBPJPY is closing above all medium and long-term averages.
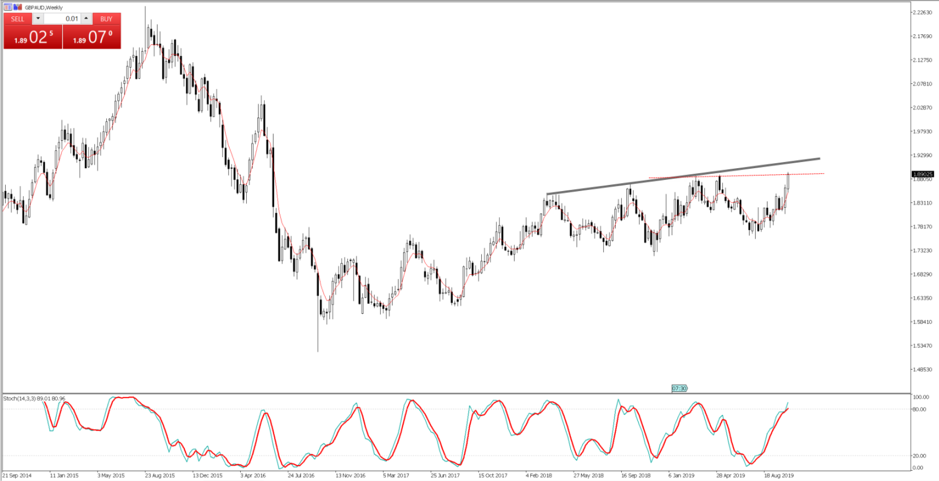
GBPAUD is worth a focus too, with price breaking the May highs of 1.8886, tracking to the highest levels since June 2016 – one for the breakout traders, with the next stop being trend resistance into 1.9160. GBPUSD could easily be at 1.3100 in the next few days or down at 1.22/1.23.

"GBPUSD daily chart"
The world continues to close out of Brexit hedges and brave speculative capital makes its way into long GBP positions, as talk of a ‘draft deal’ filters into markets. It seems we are staring at a solution on a customs arrangement, that in the words of the ERG head Steve Baker, is “tolerable”. Brexit is solved, get involved, some cry. Well not quite, but the signs are certainly more encouraging and the market is feeding off the political will from both Johnson and the EU, where the EC negotiators will now put the draft deal to the respective ambassadors of the EU 27 nations, which is expected to form the basis of a deal to be discussed at tomorrow’s EU Summit.
As far as I can see, Boris Johnson is to brief his cabinet at 16:00 GMT (02:00aedt) and then the 1922 Tory backbenchers at 19:30 PM GMT (05:30 AEDT). Surely, we hear of leaks from these meetings that offers insight and an understanding of their position. Although, we’re still hoping to get a more definitive stance from the DUP party, who seems unsurprisingly unenthused and could easily reject this deal, and again we question if any deal passes through parliament – its not hard to see why GBP volatility is so high.
Outside of GBP flows, we’ve seen two-way activity in gold, although I am cautious in the short-term, with an eye on the fixed income world, which seems to be driven by selling in UK gilts at this stage. US ‘real’ 5-year Treasury pushing up 5bp to 25bp, and to the highest since late July is never good for gold and if real yields are going higher than gold will attract sellers, especially with the pool of negative debt falling to levels not seen since July. We are also seeing better selling in the long-end of the Treasury curve, with the 3m/10yr curve closing up 5.5bp to 10bp.

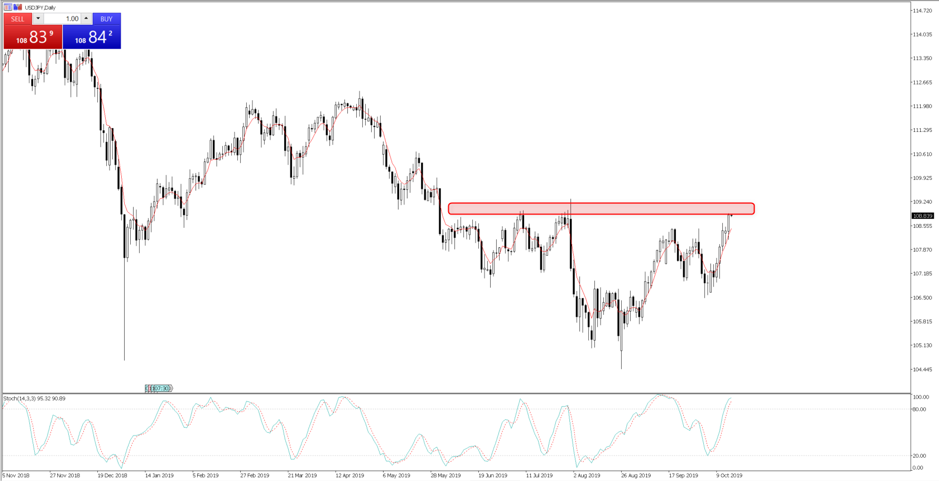
Long USDJPY is the play to hedge against further upside in yields, although the 109.32 to 108.80 area has been a sticky point for USD bulls since June and moves here have been faded with interest.

"USDJPY daily chart"
All eyes on tonight’s (23:30aedt) US retail sales report, with expectations this grows 0.3%. The market is still priced at a 70.8% chance of an October rate cut from the Fed, and this will get a workout depending on the outcome from the US retail numbers. We also get the Fed’s Beige Book, which the Fed look at closely, as well as commentary from Fed members Evans and Kaplan, although Friday’s (Saturday 02:30aedt) speech from Clarida is key and could cement expectations for the October Fed meeting.
The idea that the Fed are going to keep the economic expansion alive and run the economy hot is bullish equities but throw in good earnings from JPM and we have a solid move in US equity indices. The bulls would have liked to have seen the S&P500 close above 3000, but the set-up looks compelling on the daily timeframe and we eye 3021 ahead of the ATH of 3027.98. Bank of America release Q3 numbers tonight (pre-market), as do Abbott Labs.
By way of guide, we see S&P 500 futures 0.8% higher from 16:10 aedt (the official ASX 200 cash close). It leads us to a positive open here in Asia, with Nikkei 225 futures some 1.4% higher than their cash close and Aussie SPI futures up 53p (+0.8%), which suggest the ASX 200 unwinds just above 6700.
I have a beady eye on the WTI crude chart, which looks ominously posed to test the mult0-month support zone. This is a demand story and one that the bears will focus on, especially with the crude market running in a decent deficit (relative to demand).

The material provided here has not been prepared in accordance with legal requirements designed to promote the independence of investment research and as such is considered to be a marketing communication. Whilst it is not subject to any prohibition on dealing ahead of the dissemination of investment research we will not seek to take any advantage before providing it to our clients.
Pepperstone doesn’t represent that the material provided here is accurate, current or complete, and therefore shouldn’t be relied upon as such. The information, whether from a third party or not, isn’t to be considered as a recommendation; or an offer to buy or sell; or the solicitation of an offer to buy or sell any security, financial product or instrument; or to participate in any particular trading strategy. It does not take into account readers’ financial situation or investment objectives. We advise any readers of this content to seek their own advice. Without the approval of Pepperstone, reproduction or redistribution of this information isn’t permitted.