- English
- عربي
Analysis

XAUUSD – carving out a range
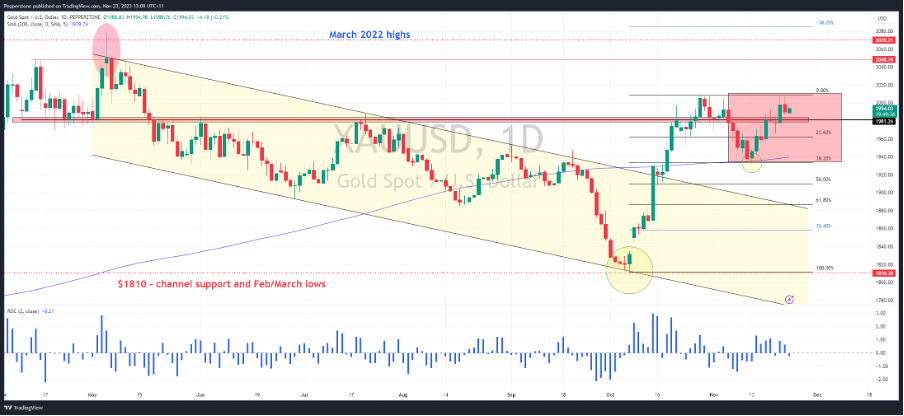
The geopolitical hedge premium has come out of gold, and we’re now seeing a stronger relationship with more traditional drivers; the USD, and US real rates. After a quick-fire sell-off, we’ve seen signs of stability in the DXY, although those who countered the weakness below 101.50 would be frustrated at the supply seen into the 100-day MA. Gold bulls will gladly welcome a move in the DXY back below 101.50 (in the DXY), as they would US 10-year real rates (TVC:US10Y-FRED: T10YIE on TradingView) below 2.10%. Conversely, a move above 2.30% would likely weigh on gold.
On the daily timeframe, strong buying interest off $1934 (the 38.2 fibo of the October rally) propelled price to re-test the October highs of $2008 but has found good supply here – it, therefore, feels like these two levels could be the defined short-term range.
XAUUSD 1-week implied vol sits at 10.1%, implying we’re more likely looking at -/+ $26 move in price over the week, which suggests the probability of a move to $1934 in the next week is low and the downside level is capped towards $1965. Over the medium-term, a break of $1934 targets $1856, while a closing break of $2008 suggests a momentum move to $2080. However, until we see a trend develop again in the USD then it feels as though gold will trade this range.
USDCNH – an underappreciated whale

USDCNH can get overlooked by many in the market but its importance for broader USD moves is real. Many will observe the FX cross closely but prefer to trade China proxies (such as AUDUSD or NZDUSD) given the strong statistical correlation and the fact that AUDUSD spreads are tighter. After a break of the August to September trading range the sellers took the price to the 200-day MA, which the USD bulls have since defended, and we see upside scope to re-test the 5-day EMA. It’s no surprise to see the AUDUSD rally also capped at the 200-day MA. The PBoC fixing (at 12:15 AEDT) has come back as a source of intraday volatility, with the bank fixing the mid-point of USDCNY lower than estimates and portraying they are comfortable with the trend we’ve been seeing. One for the radar as a guide for G10 variance.
EURCHF – PMIs to drive EUR flows
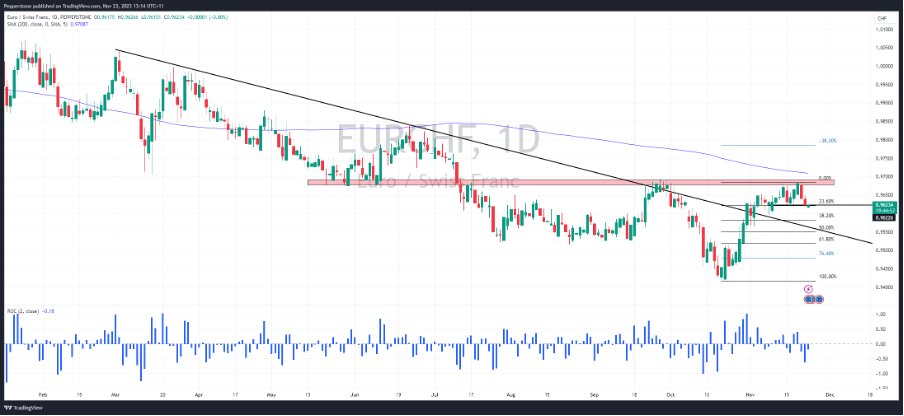
EURCHF has found good sellers into 0.9680, a level that has acted as a barrier on multiple occasions and has been the zone to fade. A closing break in the near term and a push through the 200-day MA could set off trending conditions and would come up on momentum and trend traders’ radars. Conversely, the bears seem to be having the upper hand and a convincing push below 0.9622 could see price test 0.9600 and 0.9582 (38.2 fibo of the October rally). In the session ahead we get EU services and manufacturing PMIs, where the EUR could be most sensitive to the services print, with expectations the diffusion index prints 48.1, a slight improvement from the 47.8 read we saw in October. EU swaps price 88bp of cuts from the ECB by end-2024, so better PMIs in the services print could see rate cuts unwound, which could lift the EUR.
NAS100 – history doesn’t repeat but it can rhyme
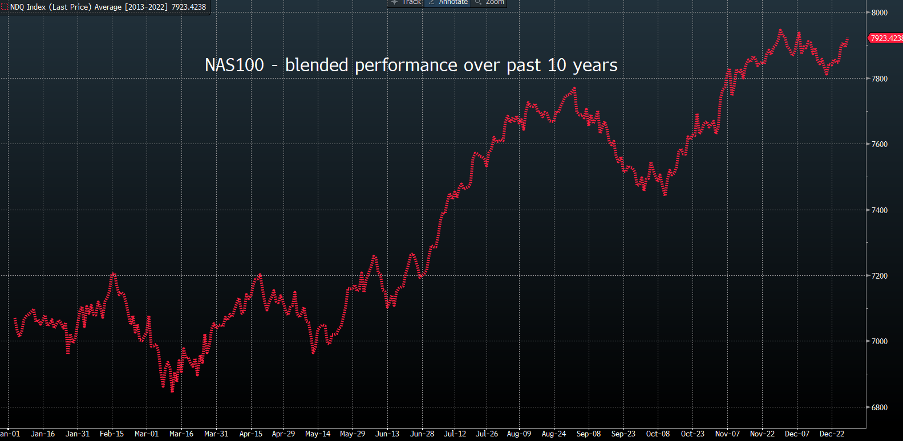
Markets are driven by sentiment, but sometimes sentiment can get too extreme and suggest the risk-to-reward trade-off has shifted. If we look at the CNN Fear and Greed index, NAS100 market internals (e.g. the % of companies above its 20- or 50-day MA, or a 4-week high) or US financial conditions indices, we are seeing increasing levels of exuberance, but they are not quite at extremes yet. The momentum traders are seeing a negative 2-day ROC but would look to reengage in longs on a closing break above 16060. Psychologically it remains hard to chase the upside, and the time for shorting extreme sentiment is coming, but I see this closer to 16,500/17,000 than 16,000. Interestingly, if we look at the seasonals the idea that we could see a touch more index strength, followed by a tradeable sell-off into early December before a strong run into year-end looks a perfectly feasible scenario. This playbook mirrors the seasonal patterns seen in the NAS100 over the past 10 years.
For something a bit niche - Uranium
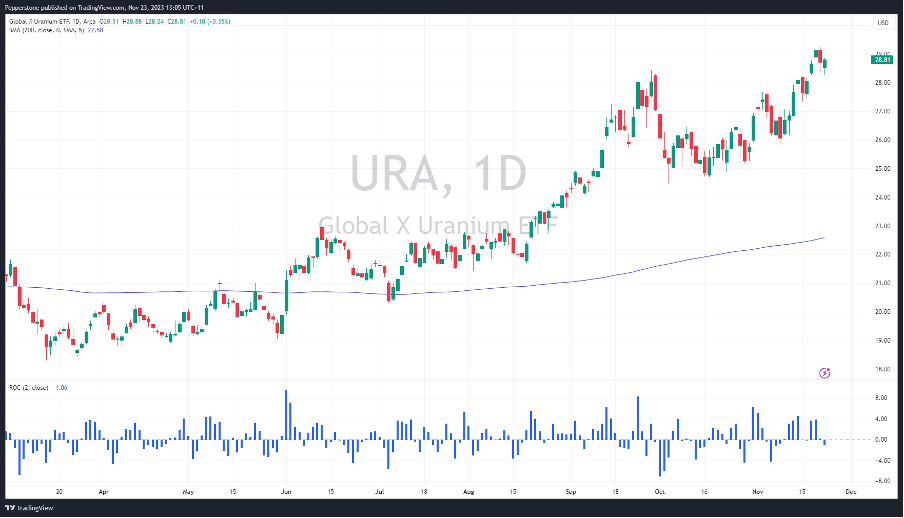
Uranium has been one of the hot plays in the world of commodities, where we can see uranium futures (UX1! On TradingView) rallying from $50 in March to current levels of $80.75. Much ink has been spilt on the fundamental reasons behind the recent move, so this theme is certainly mature and perhaps loved now, so one should consider the extent by which the supply-demand dynamics have been discounted. But for those who feel like there could be more juice in this trade then put the URA ETF (Global X Uranium ETF) on the radar – a push through $29.12 could see renewed buying interest as the trend develops once more.
The material provided here has not been prepared in accordance with legal requirements designed to promote the independence of investment research and as such is considered to be a marketing communication. Whilst it is not subject to any prohibition on dealing ahead of the dissemination of investment research we will not seek to take any advantage before providing it to our clients.
Pepperstone doesn’t represent that the material provided here is accurate, current or complete, and therefore shouldn’t be relied upon as such. The information, whether from a third party or not, isn’t to be considered as a recommendation; or an offer to buy or sell; or the solicitation of an offer to buy or sell any security, financial product or instrument; or to participate in any particular trading strategy. It does not take into account readers’ financial situation or investment objectives. We advise any readers of this content to seek their own advice. Without the approval of Pepperstone, reproduction or redistribution of this information isn’t permitted.