- English
- عربي
DXY
The dollar has seen a slight bid as we approach the end of this week, with risk being pared back slightly before the long weekend in North America due to President’s day. The majority of Asian markets are also closed on account of the China Lunar New Year leading to thinner volumes. There’s no definitive catalyst behind this mild dollar strength, but rather a combination of factors. Some that come to mind are - further short covering, safe-haven demand as major US indices futures look a bit shaky and higher yields both nominal and real. Yields are up on the back of weak demand in last night’s 30-year bond auction. The bid to cover dropped from 2.47 to 2.18 (2.33 recent average), potentially indicating concerns over inflation. A large consensus out there still sees a weaker dollar on the basis of declining real yields due to rising inflation and a dovish Fed keeping rates pinned down. I take a slightly different view that US 10-year breakevens have already discounted in significant inflation and are close to approaching fair value around 2.3%. So if breakevens get capped around that level then we could see increasing real yields (becoming less negative) and hence a stronger dollar. Or alternatively inflation surprises aggressively to the upside and the Fed is forced to taper and increase rates sooner than the market is pricing in currently. The data calendar today is barren with only a Michigan Consumer Sentiment print out at 3pm GMT which may give slightly more insight into the inflation picture. From a seasonality perspective mid-February to early March usually sees strong gains for the dollar.
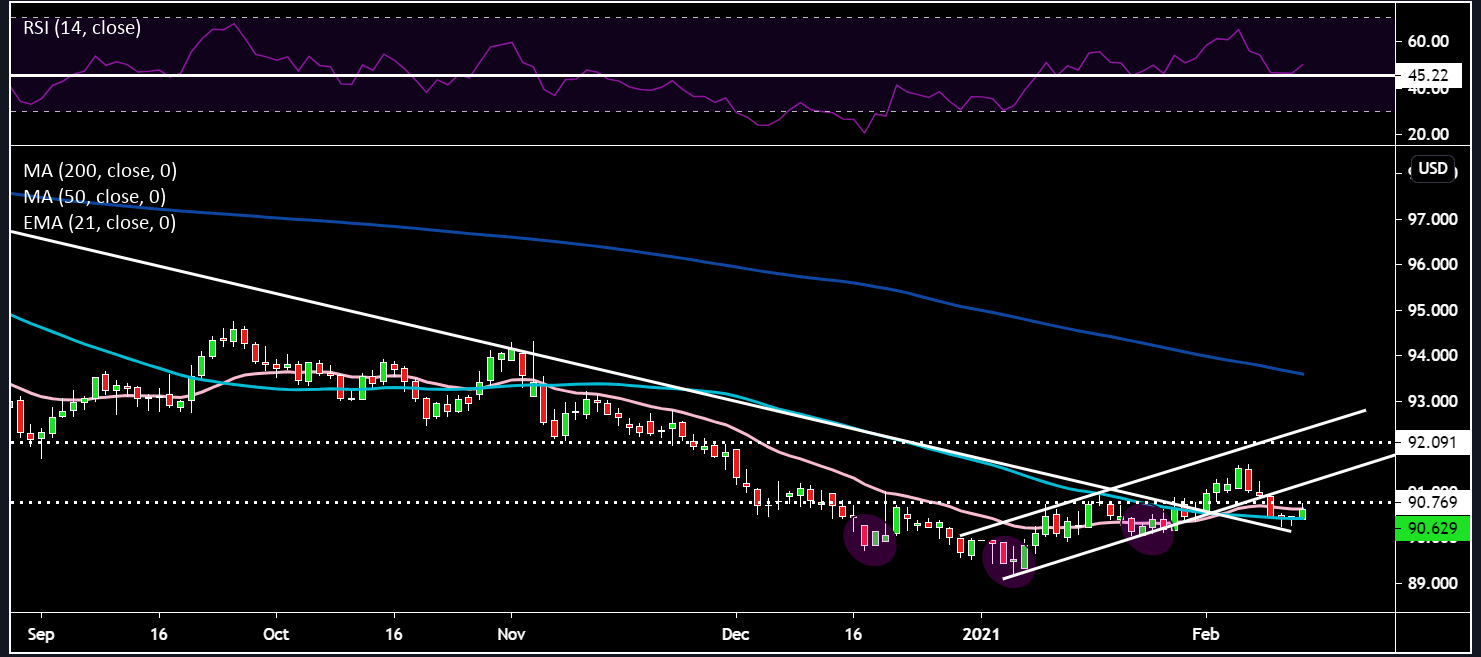
On the technical front the RSI has held support around 45 and the pink 21-day EMA has not crossed below the light blue 50-day SMA. Price candles are just keeping their head above the light blue 50-day SMA are squeezed in a tight range between both the 21-day EMA and 50-day SMA. The shorter term moving averages are pointing sideways and haven’t rolled over. For bulls, price cannot go below the low of 90.04 back in 22 January and must reclaim the 90.7 neckline moving back in to the mini ascending channel.

EURUSD
The euro continues to be the weak link within the G10 FX complex as the poor virus picture continues to weigh on bullish sentiment. There has been no data drops from the EU today, however, news flow has been quite robust. With regards to the recovery fund, there is hope to begin deploying the 750 billion euros before the end of September as approval was finalized today. Still far too late to be very effective in my opinion. The EU has cut its 2021 Euro Area GDP growth forecast to 3.8% from 4.2% and believe Spain and Italy won't return to pre-crisis GDP by the end of 2022. On the topic of Italy yesterday, the Five Star Movement (M5S) voted in favor of backing Mario Draghi. This now guarantees that Draghi will obtain a solid majority in parliament next week. BTP-Bund spreads have reacted in kind and continue to plumb multi-year lows. According to a Reuters article, the European Union is facing some financial troubles as an EU document indicates a large increase in bankruptcies and bad loans could take place as we progress through the recovery.
The technicals are weak with price being capped by the light blue 50-day SMA. The RSI has turned down from 52, which has been a strong zone of resistance previously. White dotted horizontal support line at 1.215 needs to be overcome if one can become bullish on this pair. Another break of the trendline from March around 1.205 would be bearish.

GBPUSD
We had GDP results out today for Cable traders with beats across the board. QoQ GDP growth in Q4 2020 came in at 1% vs 0.5% expectations and MoM was 1.2% vs 1% expectations. By avoiding a contraction in Q4 2020 the UK will now avoid a double dip recession even though Q1 2021 will go negative (4% according to the BoE). The economy still sits 7.8% below its Q4 2019 GDP level 7.8%, with the BoE seeing a return to these levels right at the end of 2021/early 2022 on the back of pent up demand being released into the economy from savings built up during lockdown. I agree with that assessment as long as the virus picture doesn’t change dramatically. Chief Economist at the BoE, Mr Haldane predicts households will have built up a saving of roughly £250 billion which will mostly flow into the hospitality sector as consumers exit lockdown and increase social interactions. He further said that the economy is coiled like a spring. The vaccine rollout continues to support such views as almost 14 million people have received a shot (circa 20% of the population). PM Johnson is due to make a statement on February 22 on his lockdown exit plans. On the political front there are some issues over financial services and the Northern Ireland Protocol. Gove and Sefcovic who head up the Joint Committee to deal with issues related to Northern Ireland met recently to try and resolve certain difficulties, however, more time is needed and plans to meet again on February 24 have been penciled into the diary. On financial services negotiations, Michel Barnier recently warned that the bloc won’t be rushed into a quick judgement in granting the UK equivalence. Bank of England's Bailey called the demands by Brussels in terms of regulation unacceptable. For now this relatively tranquil as covid steals attention, however, it has the potential to become quite explosive.
Looking to the technicals GBPUSD still is in a beautiful ascending channel. Moving averages are all pointing North. The RSI has rolled over as it hit the 65 overhead resistance and we saw some sluggish price movement around the 1.385 level. For those wanting to take a buy the dips approach 1.375 previous resistance turned support and the 1.37 level (pink 21-day EMA). I continue to be impressed by the pound’s strength in the face of dollar strength.

USDJPY
This cross continues to show upside potential as the main drivers continue be the yield differential between US and Japanese bonds as well as the US and Japanese vaccine spread. Price bounced off the 104.5 level which coincided with the pink 21-day EMA, white uptrend line and horizontal white line. The RSI managed to hold support at 46.32. The next price target looks set to be 105.5 at the dark blue 200-day SMA.

US 10-Year Yield
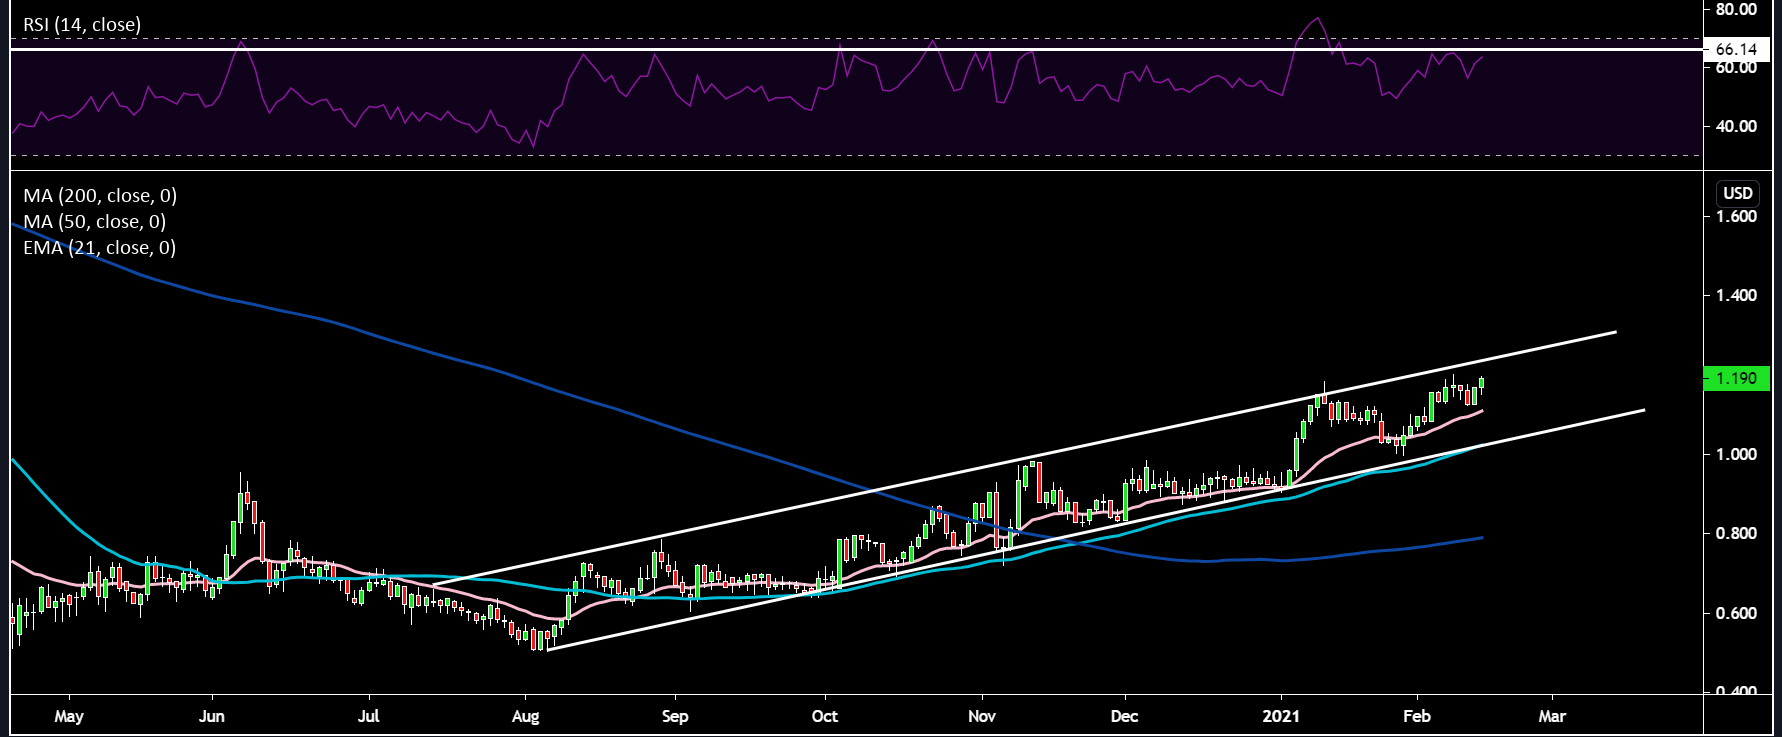
The 10-year is rocketing today up by 2.38%, injecting some excitement into markets on quiet Friday. Technicals show the RSI is nearing resistance at 66, so it will be interesting to see if we can push above that. 1.2 is a sticky level and will need be cleared for further gains, this also coincides with the topside of the upward channel. Yields crossing 1.2 and moving higher would have important implications for other assets like the dollar and equity markets so a good instrument to keep an eye on.

Related articles
The material provided here has not been prepared in accordance with legal requirements designed to promote the independence of investment research and as such is considered to be a marketing communication. Whilst it is not subject to any prohibition on dealing ahead of the dissemination of investment research we will not seek to take any advantage before providing it to our clients.
Pepperstone doesn’t represent that the material provided here is accurate, current or complete, and therefore shouldn’t be relied upon as such. The information, whether from a third party or not, isn’t to be considered as a recommendation; or an offer to buy or sell; or the solicitation of an offer to buy or sell any security, financial product or instrument; or to participate in any particular trading strategy. It does not take into account readers’ financial situation or investment objectives. We advise any readers of this content to seek their own advice. Without the approval of Pepperstone, reproduction or redistribution of this information isn’t permitted.
.jpg)

