- English
- عربي
Some basic information on Facebook
Facebook's parent company is known as Meta. Facebook stock was previously traded under the ticker FB. They officially changed their stock market ticker from FB to META on the 9th of June 2022. This was after a spree of acquisitions including Instagram and WhatsApp.
Meta Platforms is quoted and traded on the US technology index, the Nasdaq 100. The index code at Pepperstone for the Nasdaq 100 is the US Tech 100 index.
Reasons behind the 2021 decline
This spree of acquisitions did not come without some headaches. In September 2021 Facebook stock (META) declined 10.5%.
This was after the US Federal Trade Commission looked to separate Meta’s acquisitions, accusing the company of market dominance.
The initial selloff has continued with Facebook stock (META) posting a decline of over 60% from the 1st of September 2021 high of 384.33 to the 23rd of June low of 154.25.
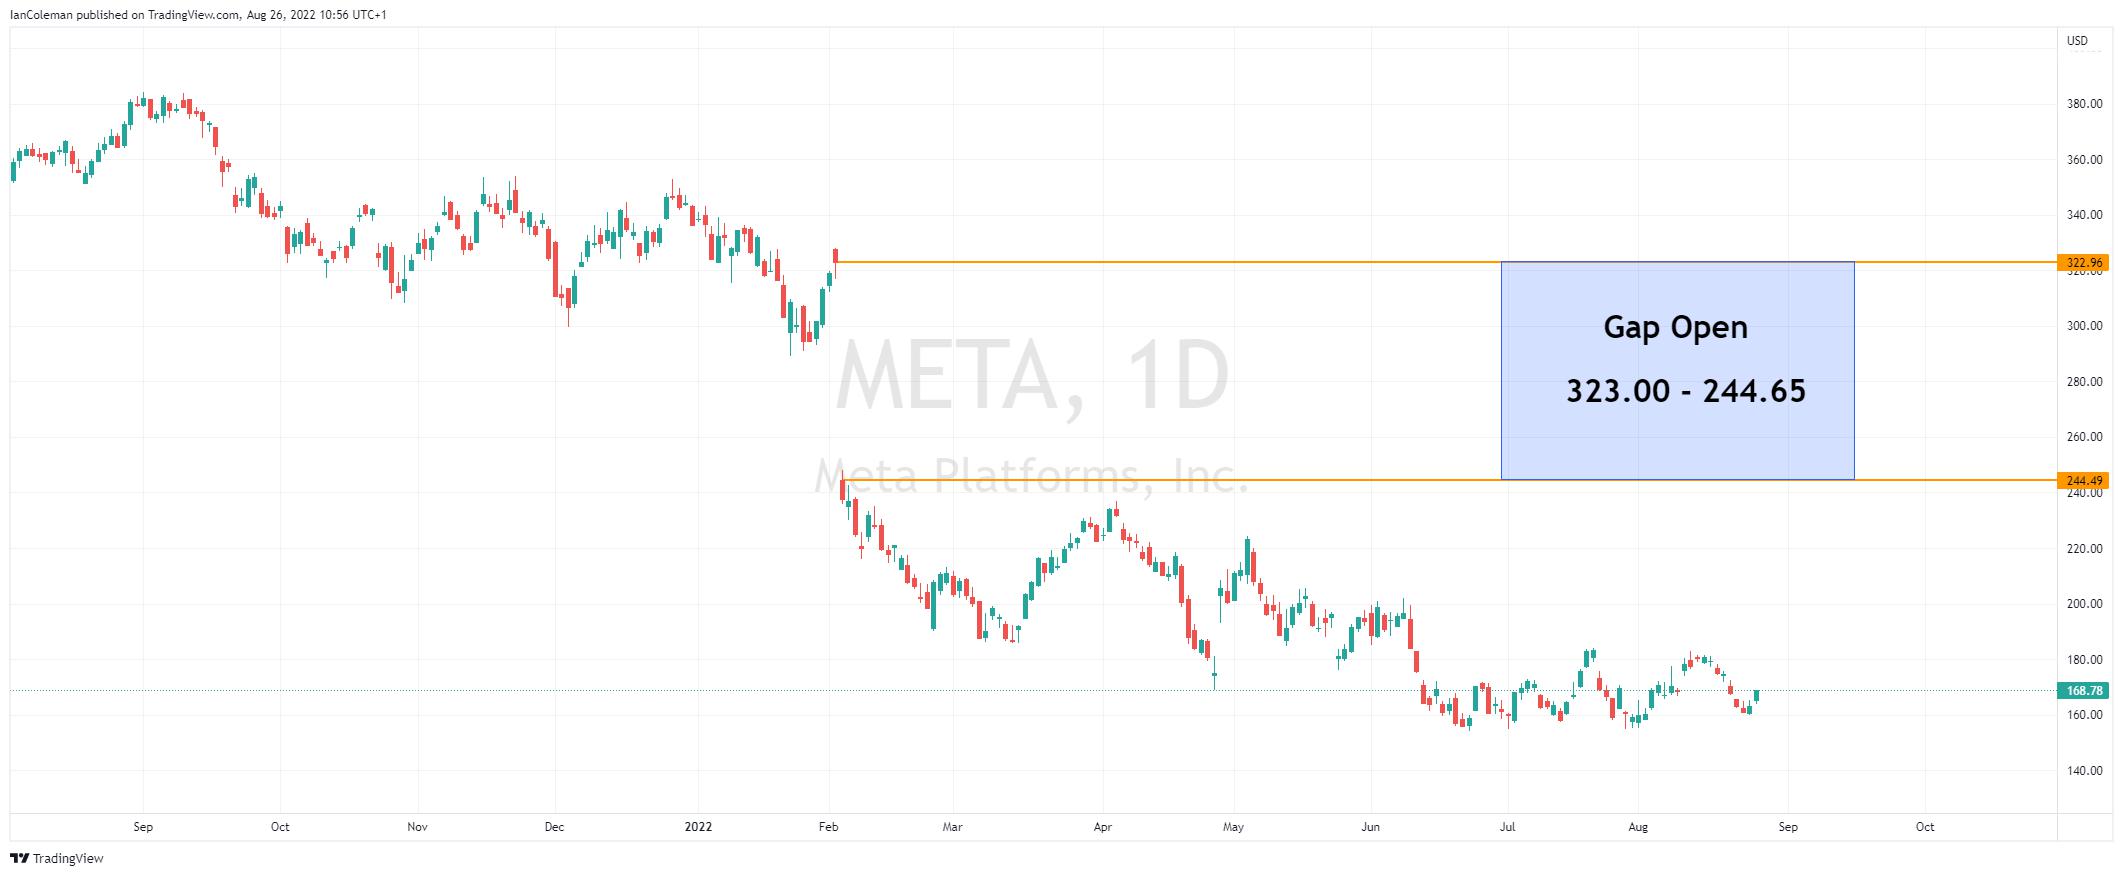
It should also be noted that the stock ‘gaped’ lower on the 3rd of February 2022 from 323.00 to 244.65 after Meta announced disappointing results for the fourth quarter of 2021. Increased competition and changes in Apple's iOS rules were cited as the reason for slower growth.
A look at the technical perspective
Is Facebook stock now a good buy? Let us look at Facebook stock using technical analysis and the Elliott Wave theory.
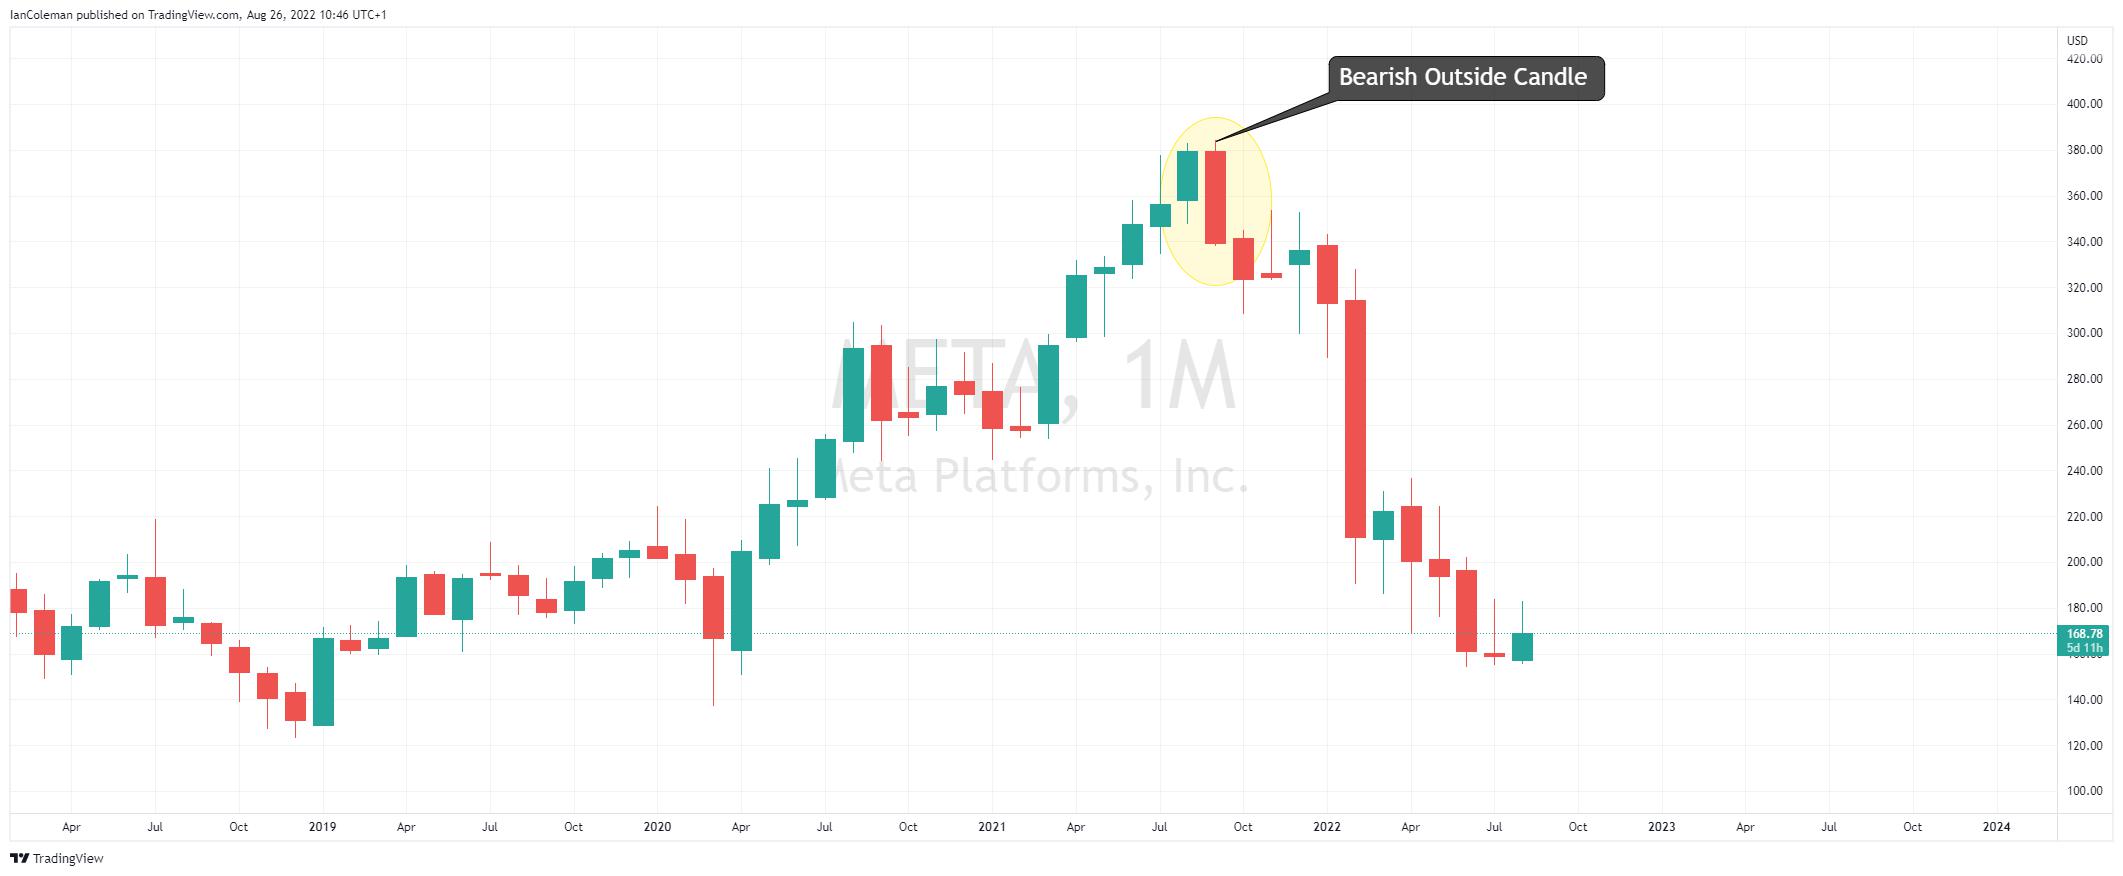
META Monthly chart
Posted a Bearish Outside Candle in September 2021. This candle will often signal the top of a trend and the start of a new downside bias.

Figure 1 Trading View META Bearish Outside Bar
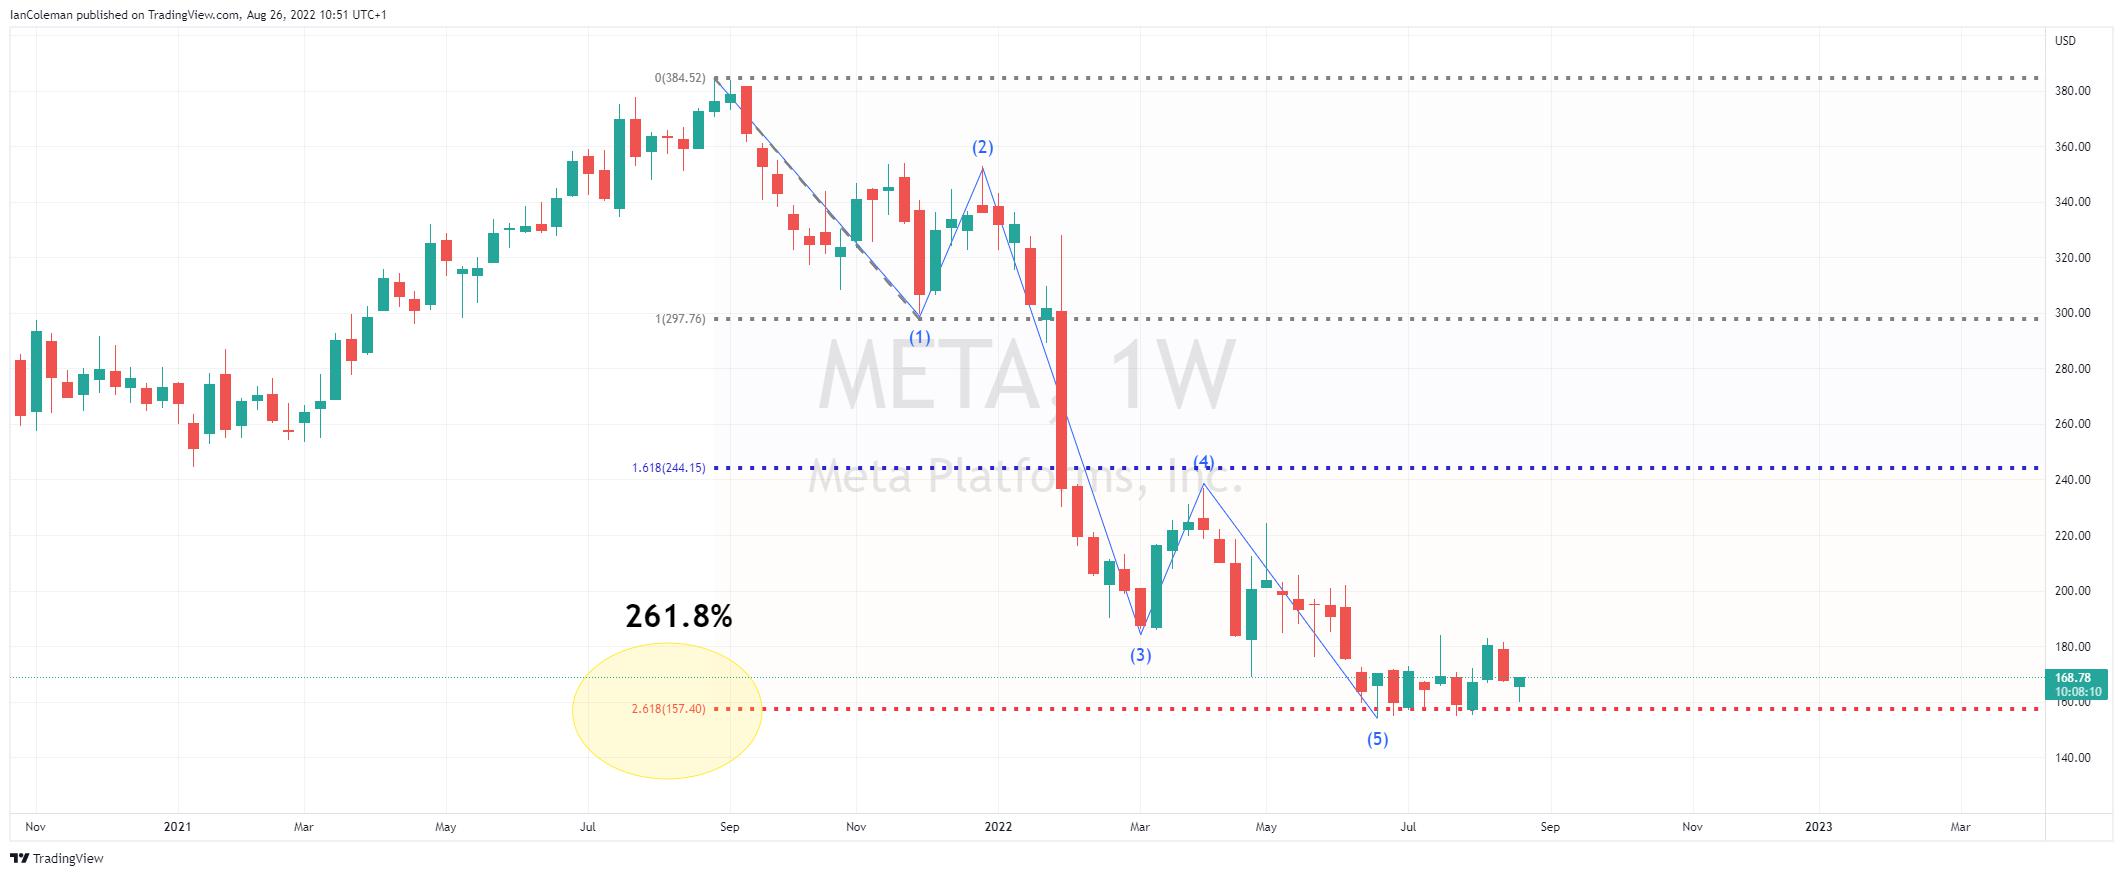
META Weekly chart
From an Elliott Wave perspective, we have seen a 5-wave decline to the 261.8% extension level of 157.40 (from 384.33 to 299.50). Elliott wave dictates that after a 5-wave decline we will normally see a choppy 3-wave correction to the upside.

Figure 2 Trading View META 5-wave count.
META Daily chart
This timeframe clearly highlights the gap left on the 3rd of February 2022. Gaps or windows tend to be closed but the stock could continue away from the gap for some time before returning to it.

Figure 1 Trading View META Gap/Window left open
For more information on trading US shares through Pepperstone, click here.
Related articles
The material provided here has not been prepared in accordance with legal requirements designed to promote the independence of investment research and as such is considered to be a marketing communication. Whilst it is not subject to any prohibition on dealing ahead of the dissemination of investment research we will not seek to take any advantage before providing it to our clients.
Pepperstone doesn’t represent that the material provided here is accurate, current or complete, and therefore shouldn’t be relied upon as such. The information, whether from a third party or not, isn’t to be considered as a recommendation; or an offer to buy or sell; or the solicitation of an offer to buy or sell any security, financial product or instrument; or to participate in any particular trading strategy. It does not take into account readers’ financial situation or investment objectives. We advise any readers of this content to seek their own advice. Without the approval of Pepperstone, reproduction or redistribution of this information isn’t permitted.


