Opening and closing prices of share CFDs explained
The opening price indicates the initial price at which a share trades when a stock exchange opens for the day, and the closing price indicates the last value at which the share trades before the exchange closes.
Introduction
Share CFD trading relies heavily on the principles of opening and closing prices. The opening price indicates the initial price at which a share trades when a stock exchange opens for the day, and the closing price indicates the last value at which the share trades before the exchange closes. These prices are more than simple data points; they are critical elements for understanding market dynamics, assessing share performance, and developing trading strategies. This article will provide an understanding of opening and closing prices, their importance, influencing factors, and how to use them effectively to enhance your trading decisions.
Price discovery
Price discovery is the process through which the market value of an asset, such as a share, is determined, driven by the continuous interaction of buyers and sellers. Hence, opening and closing prices are key parts of this procedure.
- The opening price represents supply and demand for a share at the start of the trading day. It is frequently influenced by events that occurred overnight or before the market’s opening, such as news stories or economic data releases.
- The closing price is the share’s latest value at the end of the trading day. It records all trading activity and market sentiment from that session, and it is a critical benchmark for the share’s value until the opening of the next trading day.
The opening price basically sets the tone for the day's trade, whereas the closing price summarises the day's overall trading activities.
Evaluating share performance using opening and closing prices
Opening and closing prices are essential metrics for assessing the performance of share CFDs and making better trading decisions. They can compute daily price ranges, spot patterns, and evaluate volatility.
- Daily range: The difference between a share's high and low prices, including the opening and closing prices, reflecting its price volatility during the trading day.
- Trend analysis: Opening and closing prices across multiple trading sessions can reveal short-term trends. For example, if the closing price routinely exceeds the opening price, it could signal an upward trend.
- Volatility assessment: Significant differences between opening and closing prices can indicate high volatility, prompting robust risk management.
Calculating market indices
Opening and closing prices are also used to calculate several market indices, such as the FTSE 100 or the S&P 500, providing an overview of the performance of a group of shares. Different indices may utilise different price calculations. For example, some indices use the opening share prices of their constituent stocks to calculate the index's opening value.
Similarly, closing prices are used to calculate the index's closing value. Other indices may utilise a weighted average of share prices throughout the trading day, but the opening and closing prices frequently play an essential role. Therefore, understanding both is vital to tracking market index movements.
Formulating trading strategies
Additionally, opening and closing prices serve as fundamental elements in many trading techniques as they offer meaningful signals to guide trading decisions. Below are a few examples of how these price levels can be used in practice:
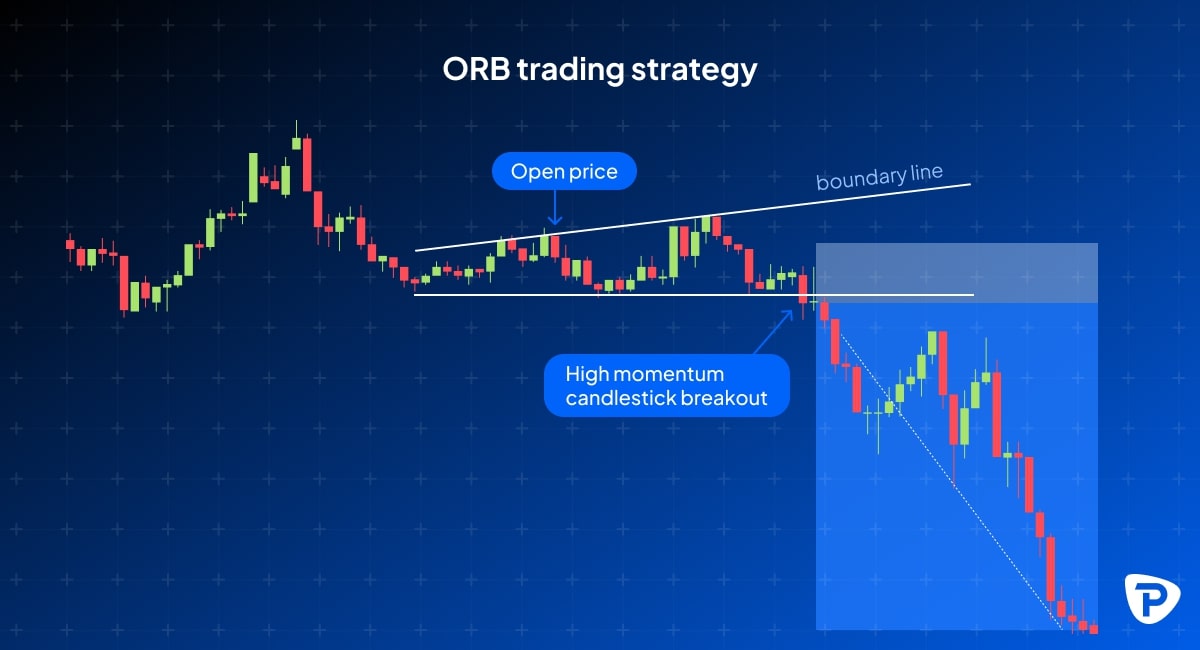
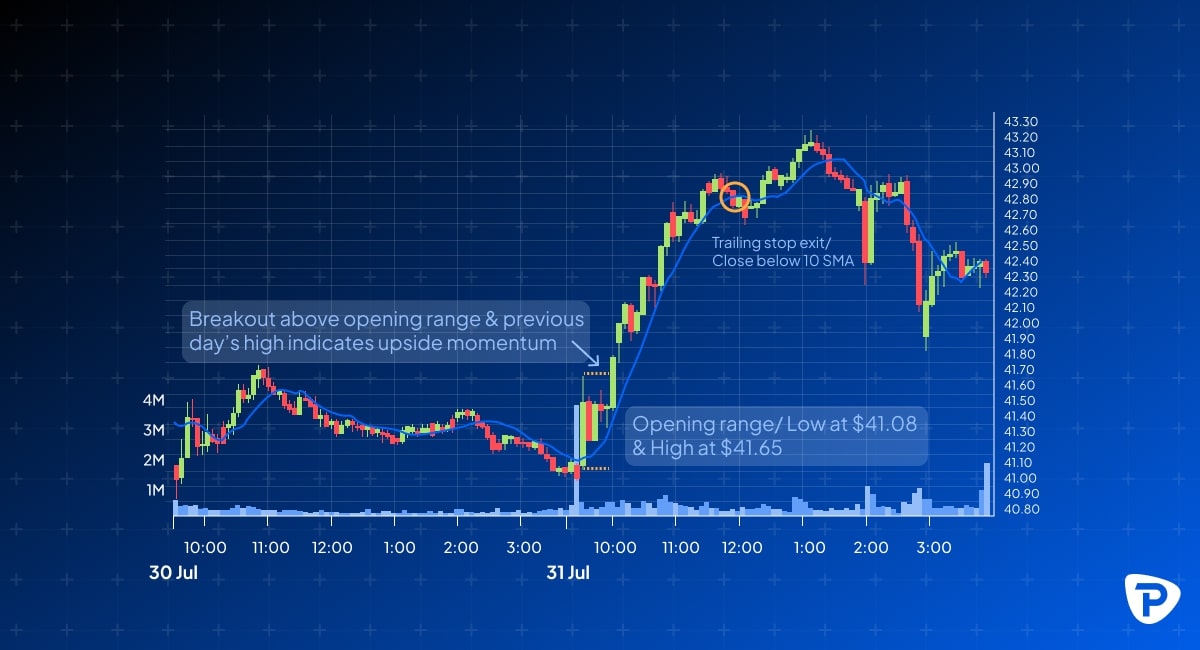
- Opening range breakout: The opening price is used to construct a range and trade based on whether the price moves above or below it. The theory is that the breakout could indicate the commencement of a powerful trend.
- Closing price reversal: This strategy involves looking for equities where the closing price shows a reversal of the day's trend, which might signal a potential change in momentum.
Closing price reversal indicator BUY setup
_and_Take_Profit_(TP)_levels_marked.jpg)
Closing price reversal indicator SELL setup
- Day trading: Day traders rely heavily on opening and closing prices to find short-term trading opportunities within a single trading day.
Factors influencing opening and closing prices
A share’s opening and closing prices are shaped by a dynamic mix of influences. From broad market forces like supply and demand, news announcements, and volatility, to more nuanced elements such as seasonality, market microstructure, and trading behaviour. These factors are classified into the categories below, each playing a distinct role in how prices fluctuate at the start and end of a trading session.
Systematic factors
Systematic factors are market-wide factors that stem from external conditions and impact all or most share CFDs.
- Geopolitical or economic news: Interest rate adjustments, inflation reports, political and global events, crises, and changes in investor sentiment can create uncertainty and increase buying or selling pressure, influencing prices.
- Supply and demand dynamics: One of the most important key factors determining opening and closing prices. If there are more buyers than sellers at the market opening, the opening price is likely higher, whereas if there are more sellers than buyers, it might be lower. At the end of each trading day, the closing price reflects the ultimate balance of supply and demand.
- Announcement effects: Company announcements such as earnings reports, dividends, mergers, and changes in guidance can generate significant market moves. Economic data releases, such as GDP or employment data, can impact investor sentiment and trading activity, also affecting share CFD prices.
- Market volatility: The degree to which prices fluctuate in the general market can also greatly impact individual share values. High market volatility can cause larger swings in opening and closing prices.
Idiosyncratic factors
Idiosyncratic factors refer to company-specific characteristics that impact the prices of individual shares. These include events such as earnings reports, new product launches, management changes, and corporate announcements. Additionally, unique trading behaviour, such as irregular order flow or sudden shifts in investor sentiment and share-specific liquidity issues, can act as crucial price drivers. Unlike broader market forces, these factors tend to impact a single company rather than the market as a whole.
Seasonality effects
Some stocks or sectors can exhibit seasonality, meaning their share prices fluctuate in predictable patterns throughout particular times of the year. This can influence both the opening and closing prices during these times.
For example, retail shares often rise during the festive season as shopping is heightened, with stronger opening prices reflecting investor anticipation. Agricultural shares may show volatility around harvest seasons, with closing prices reacting to supply forecasts. Also, travel and hospitality shares tend to peak in summer months, driven by increased consumer activity and bookings. Understanding these seasonality effects can help you time entries and exits more strategically during key periods.
Market microstructure
Price movements aren’t just about supply and demand, news announcements and market volatility; they’re also shaped by how trades are executed, as well as when and who is trading. Market microstructure refers to these finer elements of a market's operation, such as order flow, trading volume, and market participant behaviour. Various factors, including order timing, the presence of major traders, and the availability of liquidity, can significantly influence opening and closing prices.
Role of data analytics in price analysis
Data analytics is gaining prominence in assessing opening and closing prices. Traders employ various tools and approaches to recognise patterns, trends, and potential trading opportunities.
Tools to enhance your price analysis
You can improve your price analysis and identify optimal entry and exit points more accurately by using the following tools:
- Charting software: Technical analysis charting software helps you visualise price movements and spot patterns, as well as apply technical indicators.
- Statistical software: Statistical software or sophisticated analysis, such as regression or time series analysis can be used to identify correlations and forecast future price movements.
- Trading platforms: Many trading platforms include built-in tools for price analysis, such as charting, technical indicators, and real-time data feeds.
- Pepperstone platform: The Pepperstone platform provides comprehensive charting tools and analytical resources for analysing opening and closing prices and making informed trading decisions.
Using opening prices for strategic decisions
The opening price offers valuable insights into market sentiment and short-term direction. Traders often use it as a reference point to guide their strategies throughout the trading day. Here are a few ways it can further support your decision-making:
- Identifying early trends: Monitoring the opening price can help gauge market sentiment. A significantly higher or lower opening price than the previous close may indicate a strong early trend.
- Assessing overnight news impact: The opening price often reflects the market's reaction to any news or events that occurred outside regular trading hours, such as earnings announcements, geopolitical developments, or economic data releases.
- Setting entry and exit points: Some traders use the opening price as a reference point for setting entry or exit points for their trades.
Using closing prices for strategic decisions
The closing price also serves as a benchmark for setting your trading strategies, especially if you focus on end-of-day analysis or multi-day trends. Here’s how you could use it:
- End-of-day trading: Some traders execute trades in the final minutes before the market closes, hoping to profit from short-term, last-minute price movements.
- Swing trading: Swing traders may use closing price patterns over several days to spot potential swing trading opportunities.
- Risk management: The closing price is often used to determine potential margin calls, margin requirements, and to calculate the value of positions.
Choosing between the two
Deciding whether to focus on the opening or closing price depends on your trading style, goals and preferences. The opening price gives you an overview of how the market is reacting to overnight news or events and tends to be useful if you’re looking to make fast, intraday moves. On the other hand, the closing price reflects the full day’s trading activity and overall market sentiment, and it’s especially helpful for spotting longer-term trends. Therefore, it is often seen as more stable and accurate, yet it might miss out on the intra-day price fluctuations. In short, if you’re a short-term trader, the opening price might be more relevant, but if you’re aiming for bigger-picture insights, the closing price could be a better fit for you.
The pitfalls of trading on just the open and close
While opening and closing prices offer useful snapshots of market sentiment, relying on them alone can be risky. These prices may not reflect after-hours trading, sudden news events, or broader market trends. Traders who base their decisions solely on these benchmarks might miss key signals or misinterpret short-term movements. To mitigate the potential risks, it's important to use a mix of analysis tools such as technical indicators, volume trends, and fundamental data to build a complete picture of the market. In this way, you can make more informed entry and exit decisions, rather than reacting to isolated price points.
Conclusion
In summary, opening and closing prices are fundamental elements of share CFD trading, providing critical insights into market dynamics and share performance. They are also central to the price discovery process and serve as essential points for evaluating share behaviour and calculating market indices.
Understanding the factors influencing both opening and closing prices, including supply and demand, economic events, market volatility, seasonality, and the market’s operations, is crucial. By utilising tools and strategies based on these prices, along with other technical and fundamental analysis tools, you can make more informed trading decisions and navigate the complexities of the share CFD market more effectively.
The material provided here has not been prepared in accordance with legal requirements designed to promote the independence of investment research and as such is considered to be a marketing communication. Whilst it is not subject to any prohibition on dealing ahead of the dissemination of investment research we will not seek to take any advantage before providing it to our clients.
Pepperstone doesn’t represent that the material provided here is accurate, current or complete, and therefore shouldn’t be relied upon as such. The information, whether from a third party or not, isn’t to be considered as a recommendation; or an offer to buy or sell; or the solicitation of an offer to buy or sell any security, financial product or instrument; or to participate in any particular trading strategy. It does not take into account readers’ financial situation or investment objectives. We advise any readers of this content to seek their own advice. Without the approval of Pepperstone, reproduction or redistribution of this information isn’t permitted.