5 candlestick patterns every trader should know
Candlestick patterns are a key tool for traders to understand market trends. Explore five essential candlestick patterns and learn how to use them to spot potential trading opportunities.
What main candlestick patterns should I consider as an ‘intermediate’ level trader?
These candlestick patterns are useful for intermediate traders because they offer more detailed signals, when combined with other technical analysis tools, can improve trading decisions.
Bullish/Bearish Harami and Harami Cross
The Harami candlestick consists of two candles that can suggest a potential reversal or continuation in the market. The term 'Harami' comes from the Japanese word meaning 'pregnant,' which reflects the appearance of the pattern, resembling a smaller candle being 'carried' by a larger one. This pattern can indicate both bullish and bearish signals.
Bullish Harami
- Established Downtrend: The pattern appears within a well-defined downtrend, suggesting a potential reversal.
- Leading Larger Bearish Candle: The first candle is a large bearish one, indicating ongoing selling pressure.
- Trailing Smaller Bullish Candle: The second candle is a smaller bullish one. It opens higher, creating a gap up, and its body is entirely contained within the open and close of the preceding larger bearish candle.
Bearish Harami
- Established Uptrend: This pattern forms within a recognised uptrend, indicating a possible reversal.
- Leading Larger Bullish Candle: The first candle is large and bullish, reflecting continued buying interest.
- Trailing Smaller Bearish Candle: The second candle is a smaller bearish one. It opens lower, creating a gap down, and its body is fully enclosed within the open and close of the preceding larger bullish candle.
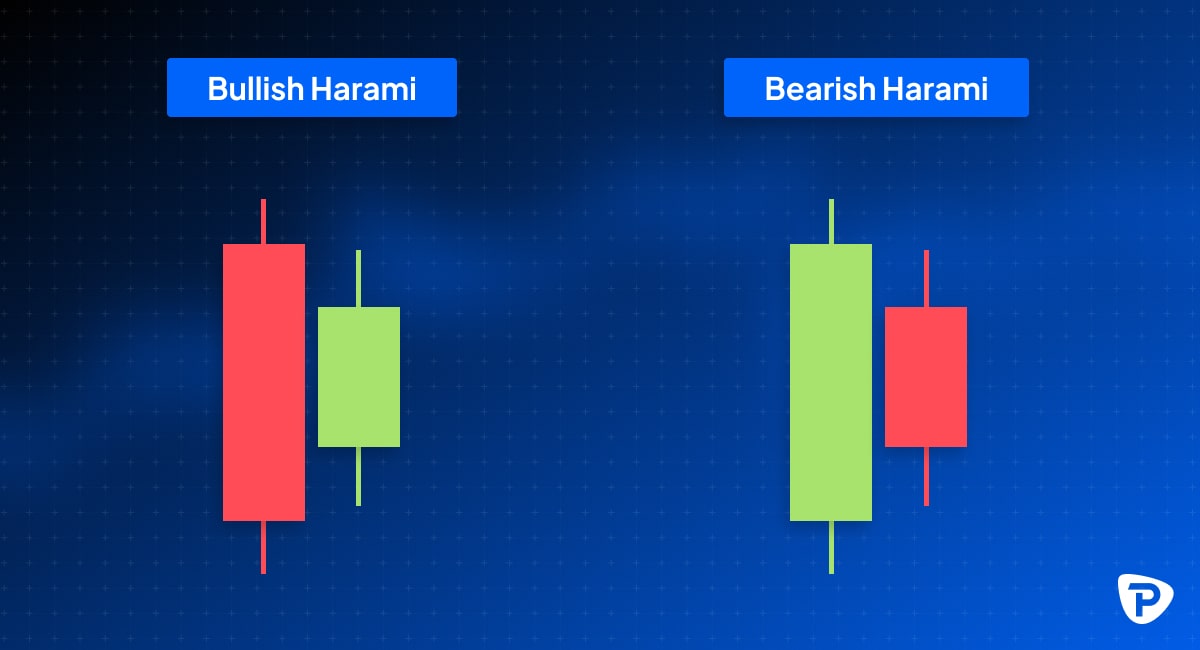
The length of the candles is critical in the Harami pattern; longer candles usually signal a more substantial reversal. In a Bullish Harami, a higher close of the second candle within the prior red candle's body suggests a stronger upside reversal. In a Bearish Harami, a lower close of the second candle within the previous green candle's body indicates a stronger downside reversal. The higher the close of the smaller bullish candle, the stronger the signal for a potential reversal to the upside.
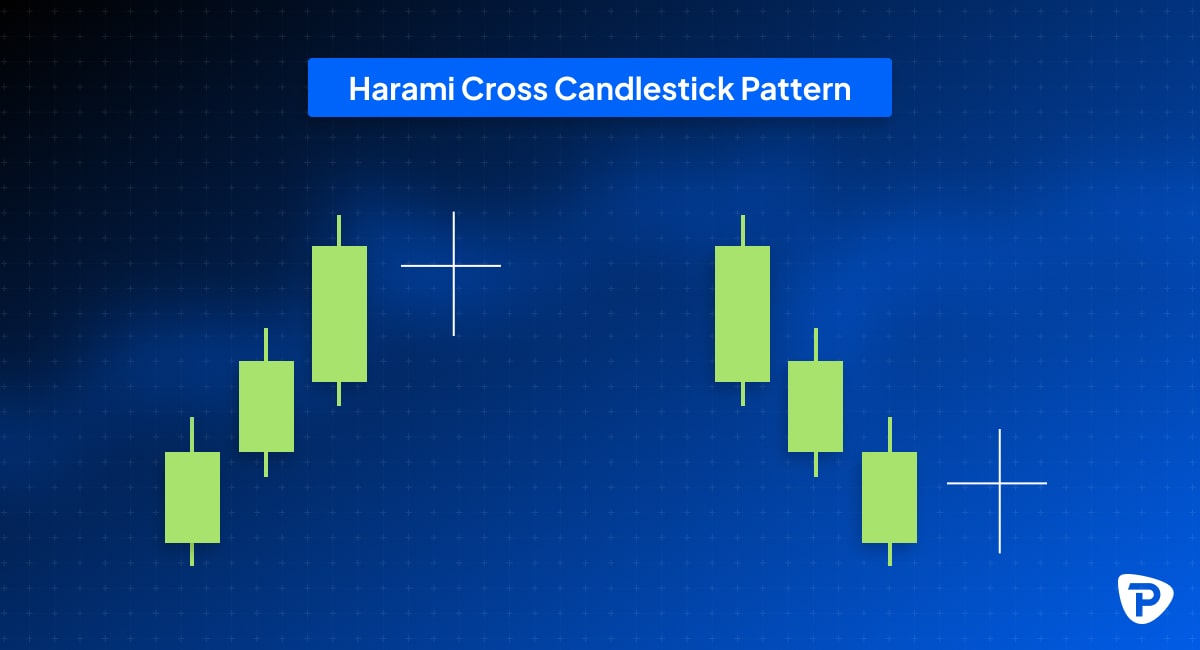
Harami Cross
The Harami Cross is a more robust version of the Harami pattern, characterised by a tiny body, often resembling a Doji. The smaller the body, the more influential the pattern. The lack of a significant body after a solid prior candle suggests greater confidence that the current trend may end, indicating indecision and a possible reversal.
For a bullish harami cross, some traders may act on the pattern as it forms, while others will wait for confirmation. Confirmation is a price move higher following the pattern. In addition to confirmation, traders may also give a bullish harami cross more weight or significance if it occurs at a significant support level. If it does, there is a greater chance of a more considerable price move to the upside, especially if there is no nearby resistance overhead.
For a bearish harami cross, some traders prefer waiting for the price to move lower, following the pattern before acting on it. In addition, the pattern may be more significant if it occurs near a major resistance level.
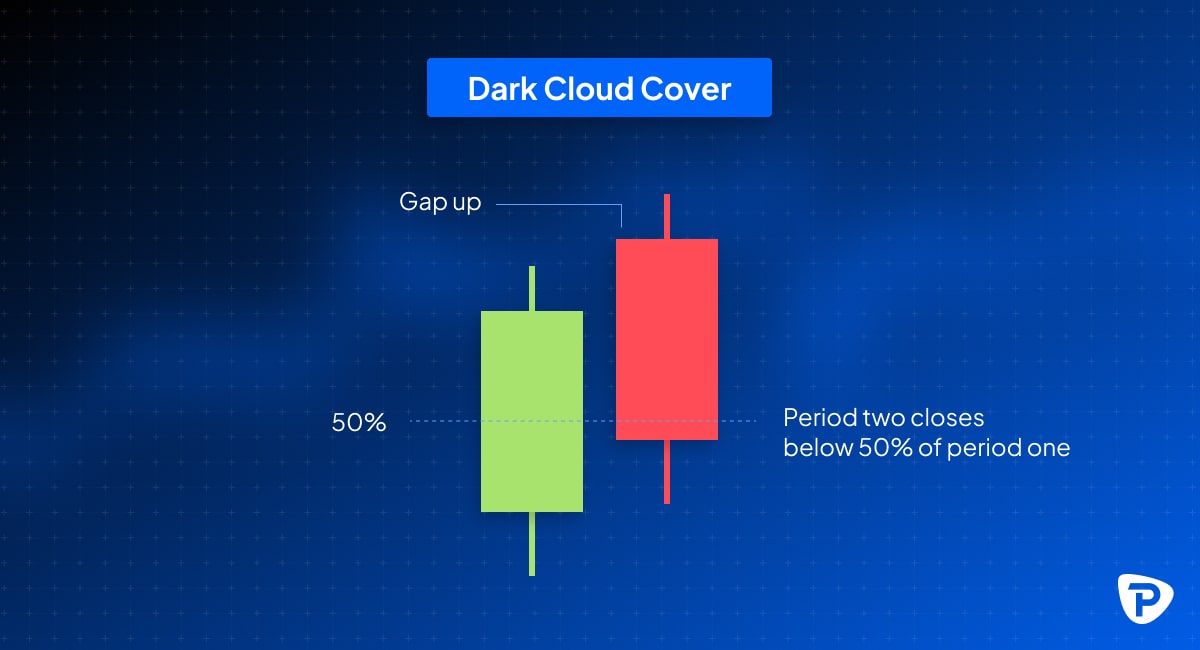
Dark Cloud Cover and Piercing Line
A Dark Cloud Cover is a bearish reversal pattern where the first candle is bullish and continues the trend, and the second gaps up on opening but closes the period below the midpoint of candle one. The rejection of the gap up is a bearish sign, and the reversal below the midpoint of the previous candle adds to this. The sentiment is shifting.
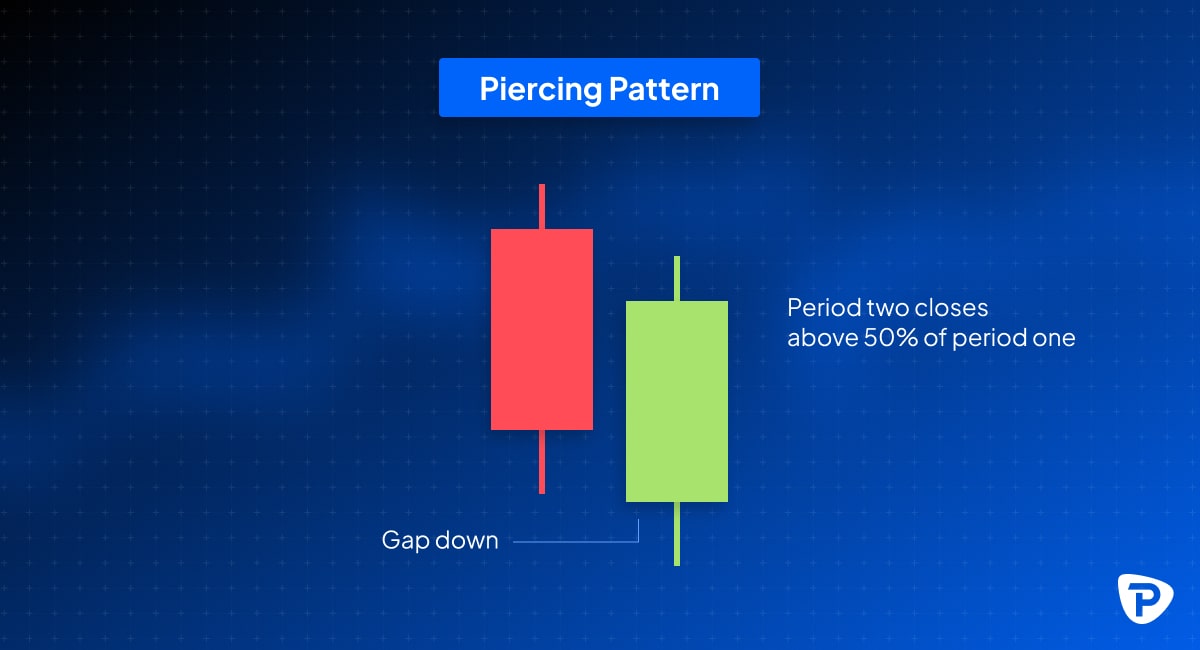
A Piercing Line is the inverse of dark cloud cover patterns – these form in downtrends and are bullish reversal patterns where a long bearish candle is followed by a bullish candle that opens lower but closes more than halfway up the body of the bearish candle. This suggests a reversal.
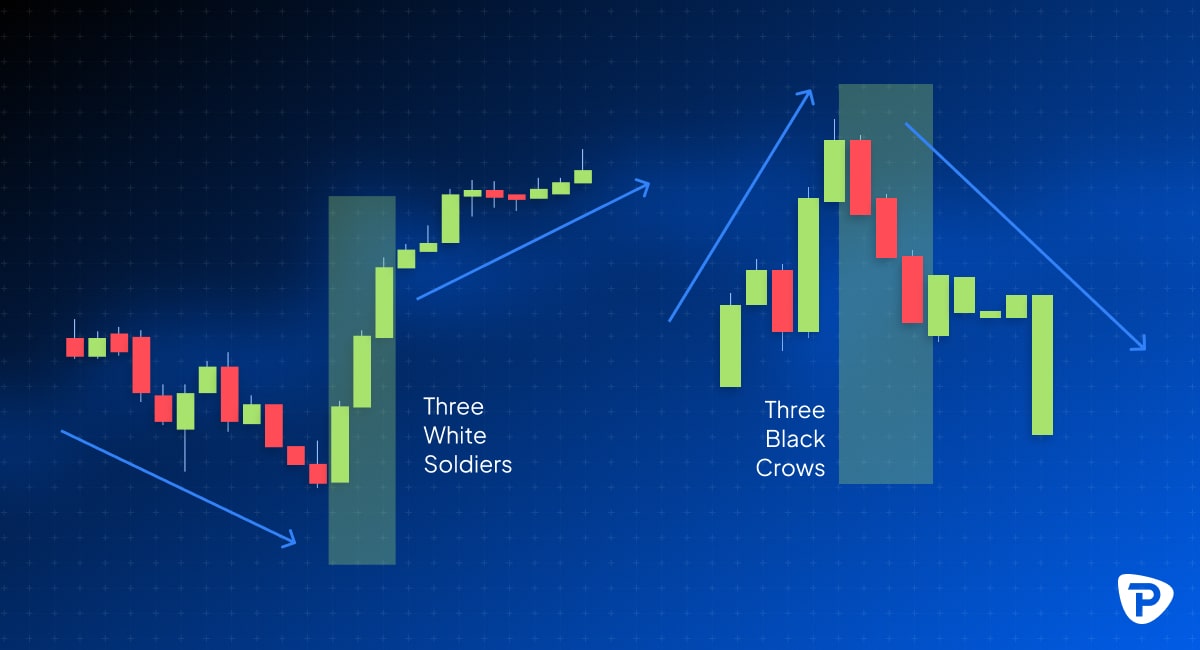
Three White Soldiers and Three Black Crows
The Three White Soldiers and Three Black Crows are reversal patterns, each consisting of three candles, as their names imply. These formations signal a possible shift in the current trend and are considered valid only when they appear following a significant uptrend or downtrend.
A Three White Soldiers pattern is a bullish reversal pattern that consists of three consecutive long bullish candles with small or no wicks, each opening and closing higher than the previous candle. This pattern usually follows a downtrend and indicates a potentially strong reversal to the upside.
A Three Black Crows pattern is a bearish reversal. It consists of three consecutive long bearish candles with little to no wicks, signalling a strong reversal after an uptrend. This pattern usually follows an uptrend and indicates a potentially strong reversal to the downside.
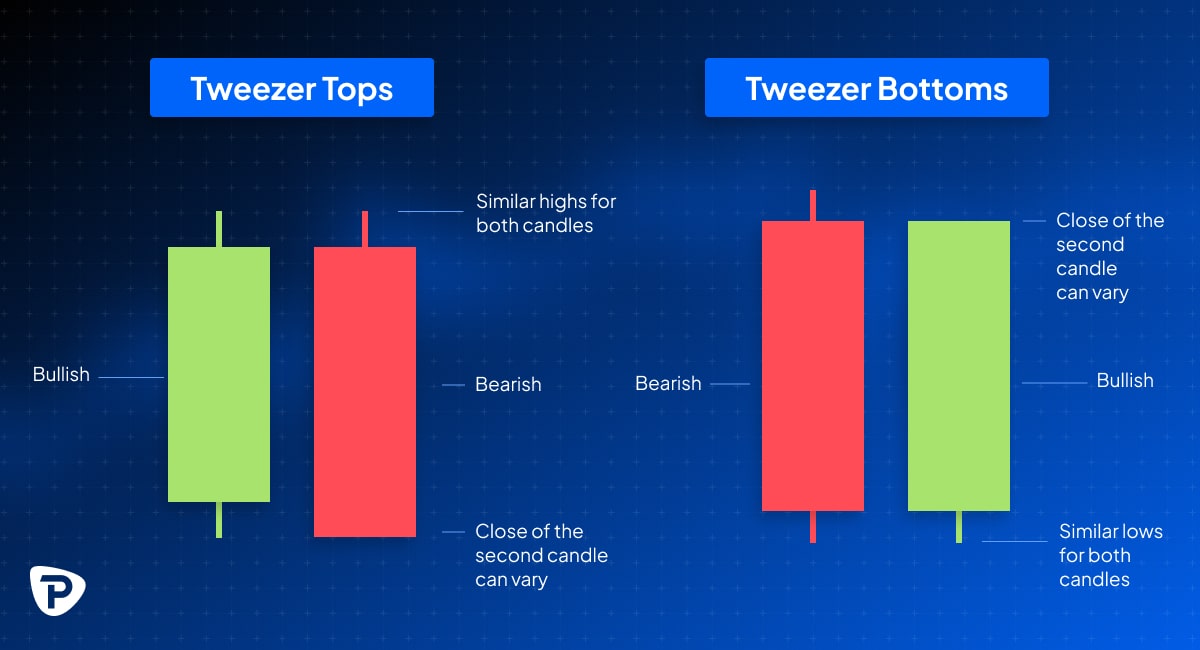
Tweezer Tops and Bottoms
Tweezer Tops are a bearish reversal pattern that usually appear in uptrends. The first candle must be bullish, though its specific shape is minor. What's important is that the high of the first candle closely matches the high of the second, which should be bearish. The first candle drives the uptrend to a new high in this scenario. However, when the second candle forms, it tests the same high, but the bullish momentum weakens, enabling the bears to drive the price down. This change indicates a shift in market sentiment, which is evident early in the formation of the second candle.
With Tweezer Bottoms, the inverse is true – these are bullish reversal patterns in downtrends. Again, similar rules apply – the first candle needs to be bearish, both candles must have similar lows, and the second must be bullish.
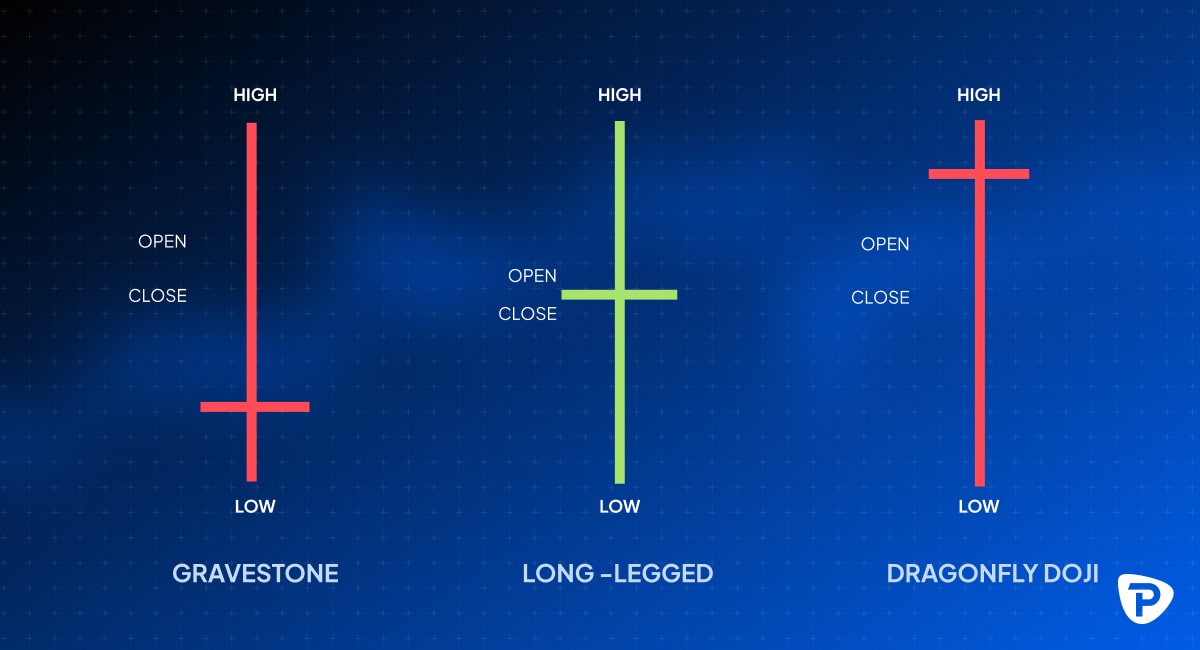
Doji Stars (Gravestone, Long-Legged and Dragonfly)
As a reminder, a standard Doji features a very small or non-existent body, with the opening and closing prices nearly identical. Its wicks (or shadows) are typically of moderate length.
Gravestone Doji
Features a very long upper wick and a much shorter lower wick, with the body positioned near the bottom of the candle. It is a bearish reversal pattern that often appears at the end of an uptrend. This pattern indicates that while the bulls pushed the price higher, they couldn't sustain it, allowing the bears to bring the price back down to close near the open, low, and close levels. This behavior can signal a potential reversal in price direction. Conversely, if a Gravestone Doji is found in a downtrend, it may suggest the continuation of the downward movement.
Long-Legged Doji
Has a very small body, like a standard Doji, but features much longer upper and lower wicks. This shows that prices fluctuated widely during the session but closed near the opening level. It indicates a higher level of indecision and volatility than a standard Doji. The long wicks suggest buyers and sellers pushed prices to extremes but failed to maintain that momentum, leading to a close near the opening price. This pattern often signals a stronger potential reversal or a major trend shift, especially when it appears after a significant directional move.
Dragonfly Doji
The opposite of a Gravestone Doji. It is a bullish signal, featuring a very long lower wick, a much shorter upper wick, and a small body near the top of the candle. The open, high, and close prices are all close in a Dragonfly Doji. While this pattern can occur in both uptrends and downtrends, it is more significant when it appears at the bottom of a downtrend, often suggesting an upcoming price reversal. In an uptrend, a Dragonfly Doji may indicate a continuation of the current trend. It signifies that sellers initially drove the price lower, but buyers stepped in to push it back up, closing near the opening price.
Typical questions asked about candlestick patterns at an intermediate level.
What are the most reliable candlestick patterns for trend reversals?
Again, it is mainly subjective in trading. However, the following is generally accepted:
- Engulfing Pattern (Bullish and Bearish)
- Hammer and Hanging Man
- Morning and Evening Star
- Shooting Star
- Doji (numerous types)
How can I use candlestick patterns in conjunction with support and resistance levels?
Identify Key Levels: Mark major support and resistance levels on your chart using horizontal lines drawing lines to identify the overall trend.
Watch for Candlestick Patterns: Look for recognisable candlestick patterns forming near these key levels.
Confirm with Moving Averages: Check if the pattern is near important moving averages, such as the 50-day or 200-day moving average.
Look for Confluence: If a bullish pattern forms near support and a rising trend line and aligns with a moving average, this confluence increases the probability of a successful trade.
Volume Confirmation: Ensure the pattern is confirmed with increased trading volume, strengthening the reversal signal.
Can I combine candlestick patterns with Fibonacci retracement levels?
The most commonly used Fibonacci retracement levels are 23.6%, 38.2%, 50%, 61.8%, and 78.6%. These levels indicate potential support or resistance during a trend's pullback or correction. Optimal trading opportunities often occur when a candlestick pattern forms near a Fibonacci retracement level, as this heightens the chances of a trend reversal or continuation.
How do I interpret candlestick patterns in volatile markets and avoid common mistakes?
- Focus on Strong Patterns: Rely on proven reversal patterns like Bullish/Bearish Engulfing, Morning/Evening Star, Hammer, and Shooting Star.
- Confirm with Volume: High volume supports the pattern’s strength, while low volume suggests a weaker signal.
- Use Larger Time Frames: Larger time frames help identify clearer trends and minimise volatility noise.
- Combine with Technical Indicators: Use tools like moving averages, RSI, and Bollinger Bands to validate candlestick signals.
- Establish Key Levels: Look for patterns near support and resistance for more reliable signals.
- Consider Market Sentiment: Be mindful of news and events that drive volatility and use patterns to interpret market reactions.
- Risk Management: Implement tight stop-losses and adjust position sizes to manage risk in volatile markets.
- Look for Similarities: Seek multiple confirmations, such as across time frames and with other indicators.
- Watch for Long Wicks: Long wicks indicate price rejection and potential reversals.
- Be Patient and Disciplined: Avoid overtrading; wait for confirmation before trading.
New to trading? Why not check out Pepperstone's beginners guide on what are candlestick charts and how to read them.
.Final thoughts on candlestick chart patterns
Intermediate traders can combine these patterns with other technical tools, such as trend lines, moving averages, and support and resistance levels, for more informed trading decisions. Recognising these patterns helps traders anticipate potential market reversals and trend continuations. You can explore these candlestick patterns and other technical indicators through your Pepperstone live or demo account.
The material provided here has not been prepared in accordance with legal requirements designed to promote the independence of investment research and as such is considered to be a marketing communication. Whilst it is not subject to any prohibition on dealing ahead of the dissemination of investment research we will not seek to take any advantage before providing it to our clients.
Pepperstone doesn’t represent that the material provided here is accurate, current or complete, and therefore shouldn’t be relied upon as such. The information, whether from a third party or not, isn’t to be considered as a recommendation; or an offer to buy or sell; or the solicitation of an offer to buy or sell any security, financial product or instrument; or to participate in any particular trading strategy. It does not take into account readers’ financial situation or investment objectives. We advise any readers of this content to seek their own.