- English
- عربي
A wild week of trading: US stocks worst day since the 1987 crash

Circuit breakers hitting twice in US indices, 30% one day moves in Oil and the worst percentage decline day on the US market since 1987 can barely sum up the market turmoil we have seen this week. Thursday saw multiple worldwide indices enter bear market territory with declines past 20%, forcing policy makers around the world to introduce their own targeted stimulus plans to help slow the market turmoil.
Circuit breakers hit American indices market wide
The S&P 500 was halted on Monday 9 March and Thursday 12 March in the US session following a 7 percent decline in market value in response to the current global pandemic of the coronavirus outbreak. Circuit breakers act as a level in which the exchange gets halted or closed during times of extreme market movements. These levels are calculated by taking the previous daily close and calculating the percentage difference. Once level one is breached at a 7% decline, the market will close for 15 minutes, designed to let liquidity catch up with the fast move and potentially stave off further panic selling. If the market then continues to freefall, level two will be triggered at 13 percent, with another 15-minute halt. Level 3 triggers at a 20 percent decline which causes a complete closure for the rest of the day.
VIX hits fresh highs
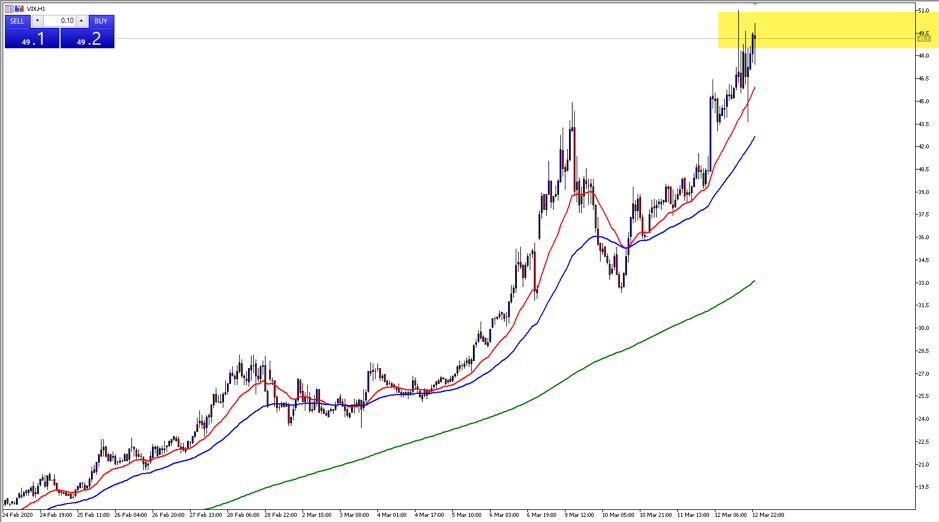
The VIX (volatility index) continues to make a series of higher highs and higher lows, spiking to unprecedented levels since the GFC. On Monday we saw levels greater than 40 breached, but during the second circuit breaker on Thursday, the US VIX spiked as high as 51. (the area highlighted in yellow in the chart above)
ASX 200 breaks monthly trend line and enters a bear market
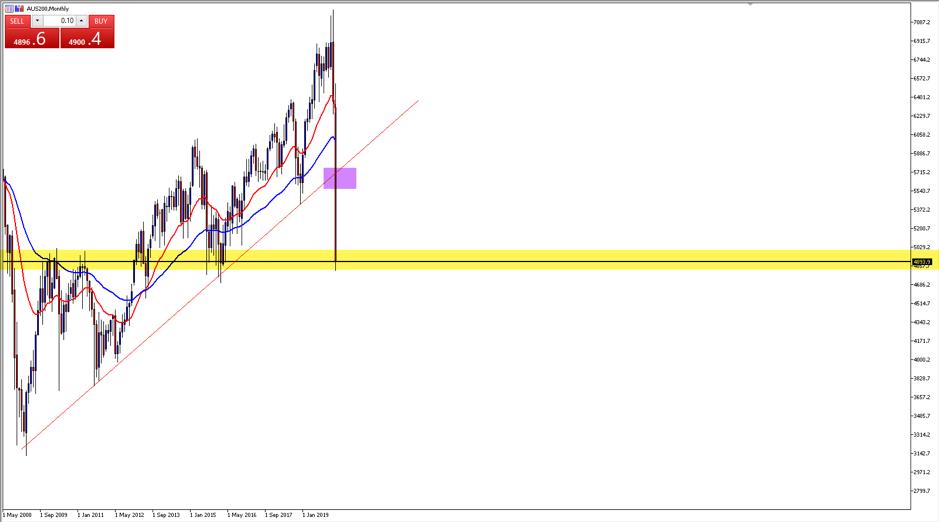
The ASX 200 has had one of the largest falls since the GFC this week, with the last 14 days spanning a potential decline of 2200 points from top to bottom if the futures open as currently predicted. The strong monthly trend line (highlighted in purple) which has been in place since the financial crisis lows and has acted as a support level since is now broken. We are now looking at a key support zone around 4800 on the index, (highlighted in yellow) a zone which has provided solid support and resistance during large market moves since the GFC.
S&P 500 breaks 200 moving average and enters bear market
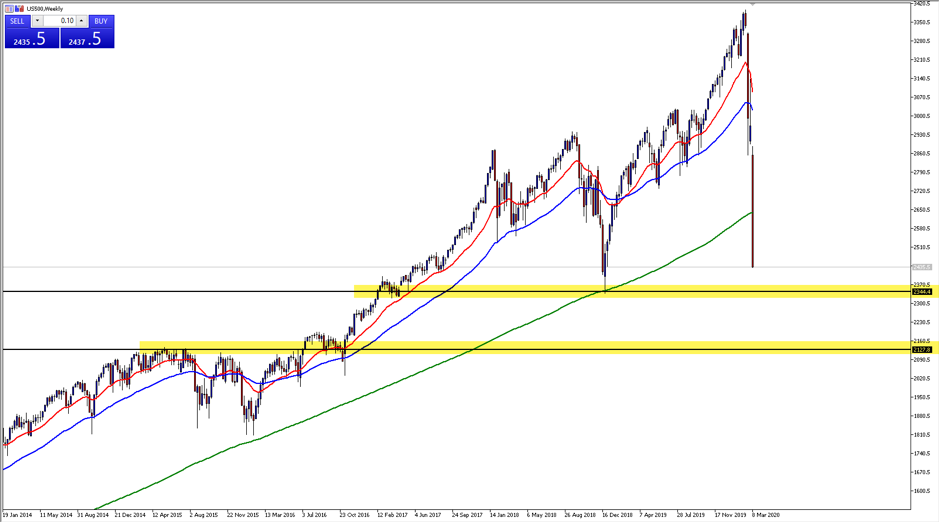
The decline on 12 March has seen the S&P 500 enter a technical bear market, with a 20 percent fall from the top to the current price. Yesterday the market fell over 9 percent in the biggest crash since 1987, with price smashing through the weekly 200 moving average, (green line) an indicator which has held the general market crashes since the 2009 lows. The levels at around 2340 and 2120 (highlighted in yellow) are the last technical support zones that may potentially slow the bearish momentum.
The DAX 30 breaks through support in double top formation
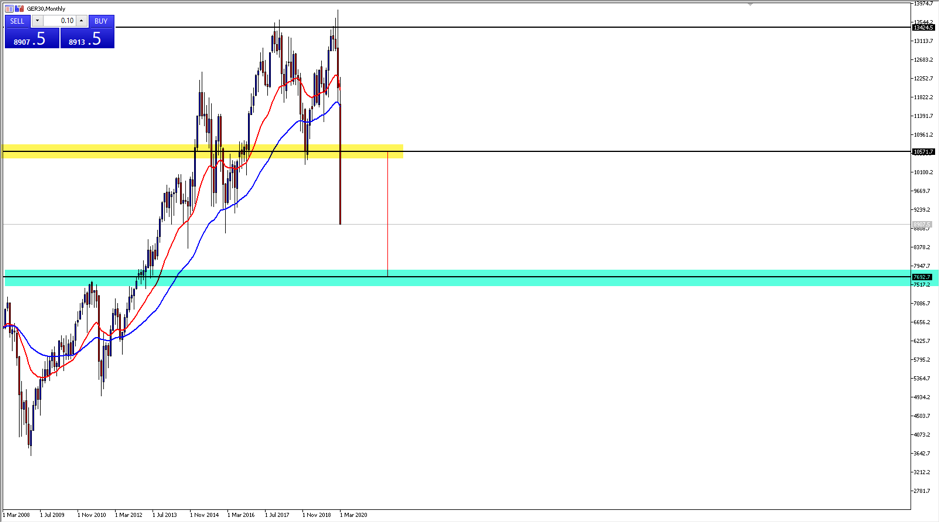
The German index (DAX) has now closed below the intervening trough of 10,500 as shown in the yellow highlighted area above. This close now signals a potential move of the index into the green highlighted area at around 7,700 where the DAX previously traded in 2010.
Into the unknown
The Fed fund rate futures are now pricing in an entire emergency rate cut of 1 percent at the meeting next week. This would take interest rates to 0 percentage points and will be designed to try and help the US economy weather the coronavirus threat. Elsewhere central banks and Governments are announcing emergency stimulus packages but until now have not helped stave off market selling.
Ready to trade?
It's quick and easy to get started. Apply in minutes with our simple application process.
The material provided here has not been prepared in accordance with legal requirements designed to promote the independence of investment research and as such is considered to be a marketing communication. Whilst it is not subject to any prohibition on dealing ahead of the dissemination of investment research we will not seek to take any advantage before providing it to our clients.
Pepperstone doesn’t represent that the material provided here is accurate, current or complete, and therefore shouldn’t be relied upon as such. The information, whether from a third party or not, isn’t to be considered as a recommendation; or an offer to buy or sell; or the solicitation of an offer to buy or sell any security, financial product or instrument; or to participate in any particular trading strategy. It does not take into account readers’ financial situation or investment objectives. We advise any readers of this content to seek their own advice. Without the approval of Pepperstone, reproduction or redistribution of this information isn’t permitted.