- English
- عربي
.jpg?height=93&quality=100)
Has the yellow metal lost its shine? Gold has been in a slow grinding trend lower, losing around 17% since its $2075 high back in August of 2020. This weaker price action is quite typical during the growth recovery stage, as safe-haven investment flows rotate out of gold into other assets with a higher beta to risk-on. According to Deutsche Bank, ETF holdings have unwound around 1/3 of the accumulation since the start of 2020. They believe a full unwind of these ETF holdings could take gold down to $1500. I definitely think cryptocurrencies and Bitcoin have benefited at the expense of gold, as cryptocurrencies solidify their position as a digital gold alternative. The wider institutional interest and adoption of cryptocurrency certainly hasn’t helped stem flows away from gold. There was a decent pop higher in net speculator positioning from 175.2k to 180.2k net long, however, the larger trend in positioning remains to the downside. Gold has faced other headwinds in recent months as central bank demand wanes and EM jewelry demand hasn’t been as robust as same may have expected. Lockdown fears in Europe, may attract some safe-haven flows, but only minor in my opinion as markets will be looking through this. However, the flip side of that is a more sluggish global inflation picture (disinflation) and a stronger dollar as the euro weakens further, both applying pressure to upside moves in gold.
As a non-interest bearing asset, there is an opportunity cost to hold gold as yields rise. Jerome Powell, the Fed Chairman certainly hasn’t thrown gold bulls a bone by allowing the market to take the back end of the yield curve higher and higher. Real yields (yields after inflation has been removed) have also been moving higher, moving by about 40 bps from -1% to circa -60% YTD. The chart below highlights this key relationship and how closely correlated the two instruments are.
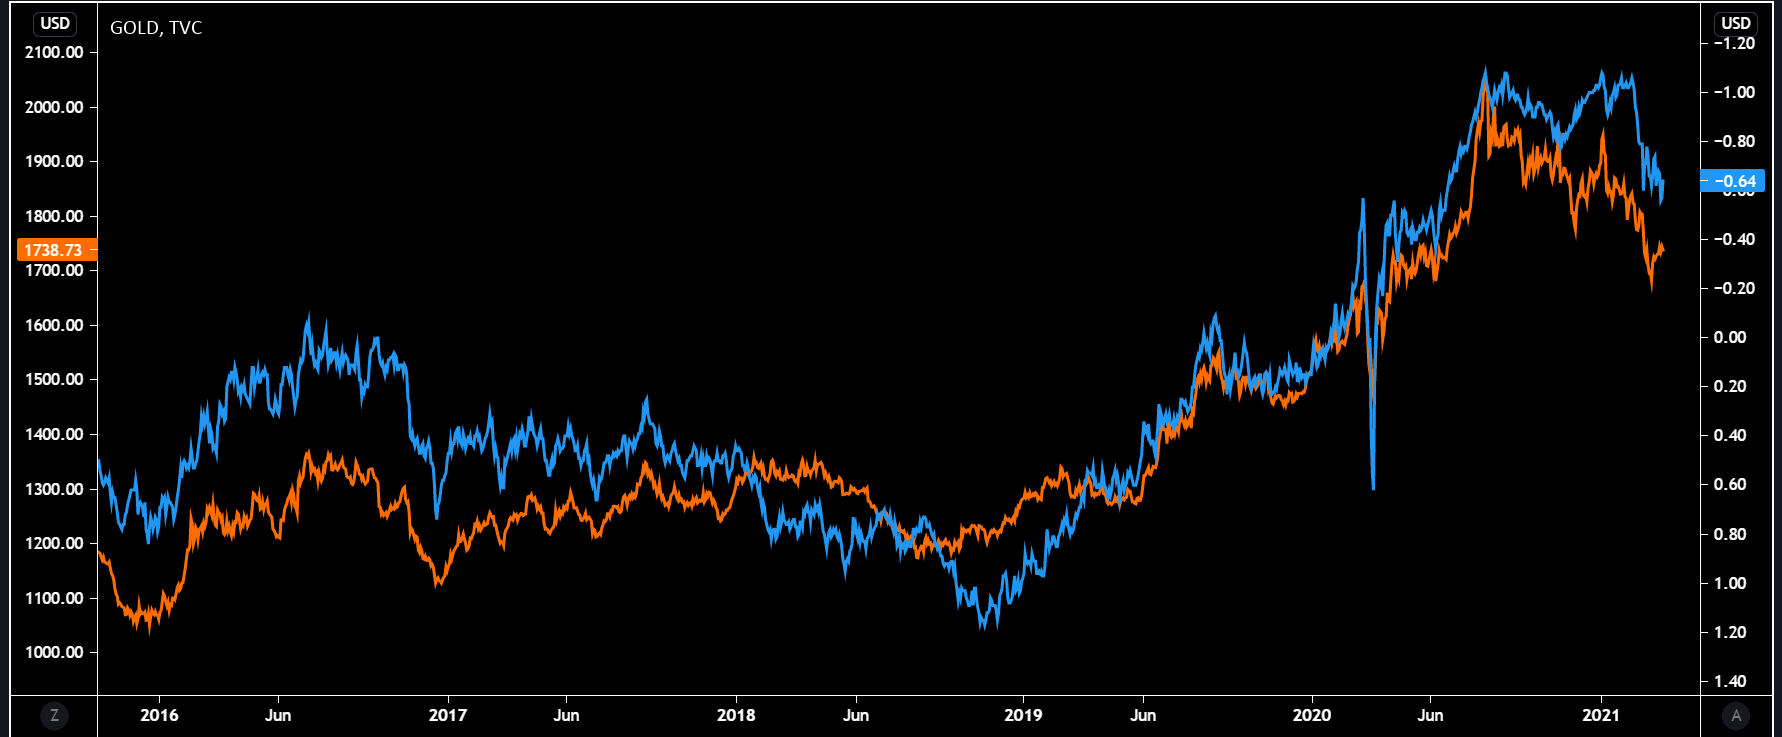
Blue line - 10-year real yields and Orange Line - Gold price. Left-hand scale is gold price and righthand scale is the inverted 10-year real yield.
It would be remiss to not mention the spectre of inflation while analysing gold, given its importance in driving the price of the yellow metal. Inflation is one of the most important topics being debated in markets currently – will it be transitory or secular. The chart below from the recent BofA fund survey shows this is the biggest tail risk for the market according to these fund managers.
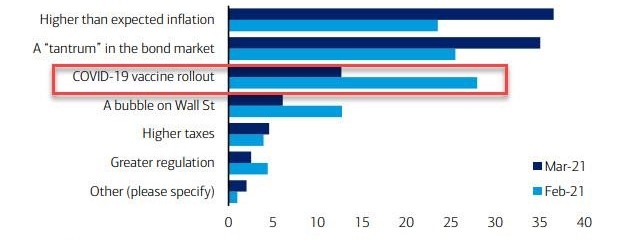
Source: BofA
BofA expects a disinflationary scenario to prevail in the second half of 2021 as supply chain disruptions prove temporary, work-from-home leads to smaller rebounds in restaurants, in-person retail, and business travel, plunging global birth rates, etc. Alternatively, Bridgewater believes that we are on the precipice of a secular inflationary wave. Each point of view has its merits. As traders, there is a handy gauge which can be used to monitor the markets’ views on the duration of inflationary pressures – breakevens. Breakevens measure the difference between TIPS (Treasury Inflation Protected Securities) and nominal Treasury yields. So for example if the 10-year breakeven is printing a reading of 2.5%, this means that CPI inflation is expected to average 2.5% over the next 10 years by the market. Currently, shorter duration breakevens are trading at a premium to longer duration breakevens, implying that the market shares the view of the Fed that inflation will be transitory as opposed to a larger and longer shock.
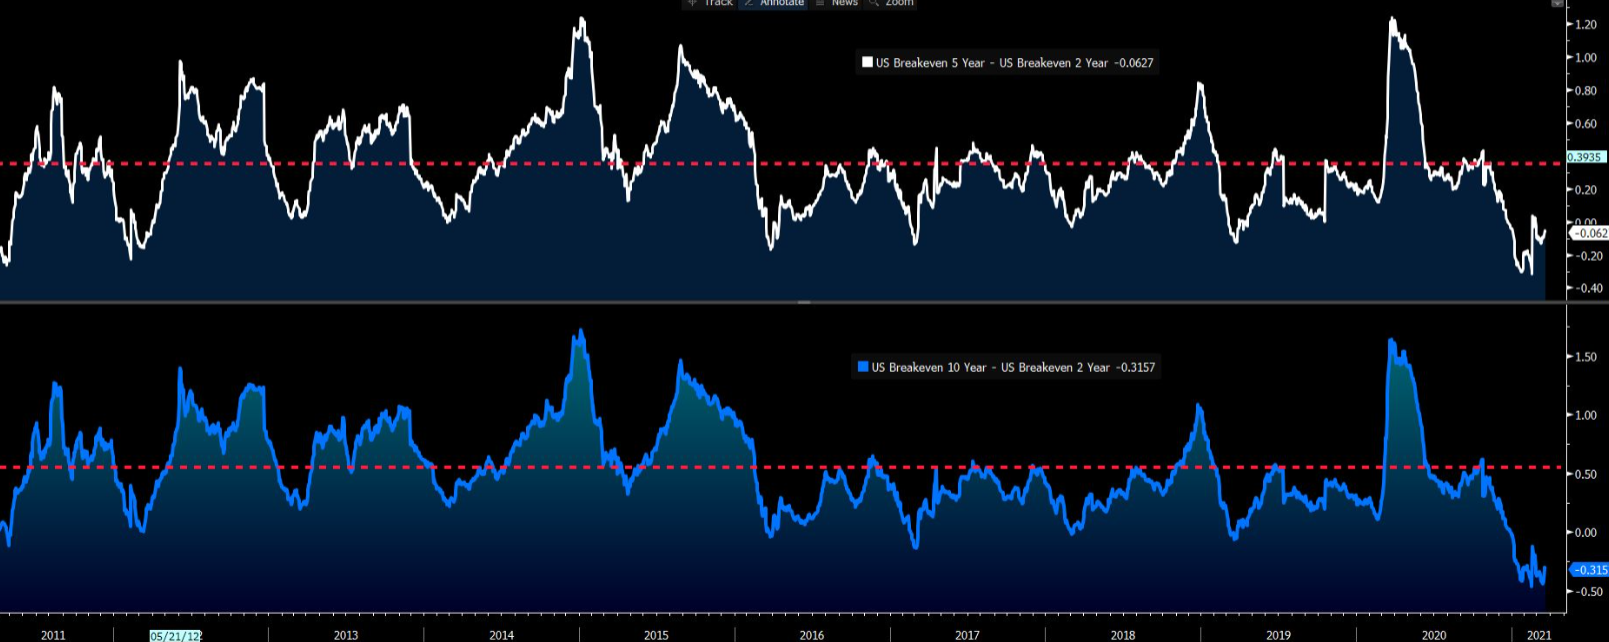
Source: Bloomberg
The fun and games will begin should this dynamic flip the other way. Rate hike bets would become more aggressive as the market see the Fed behind the curve warranting policy tightening to be brought forward much faster. The key question the market will need to answer is which effect has the larger influence on the price of gold - inflation scare dynamics (positive for gold) or larger and faster rate hikes (negative for gold).
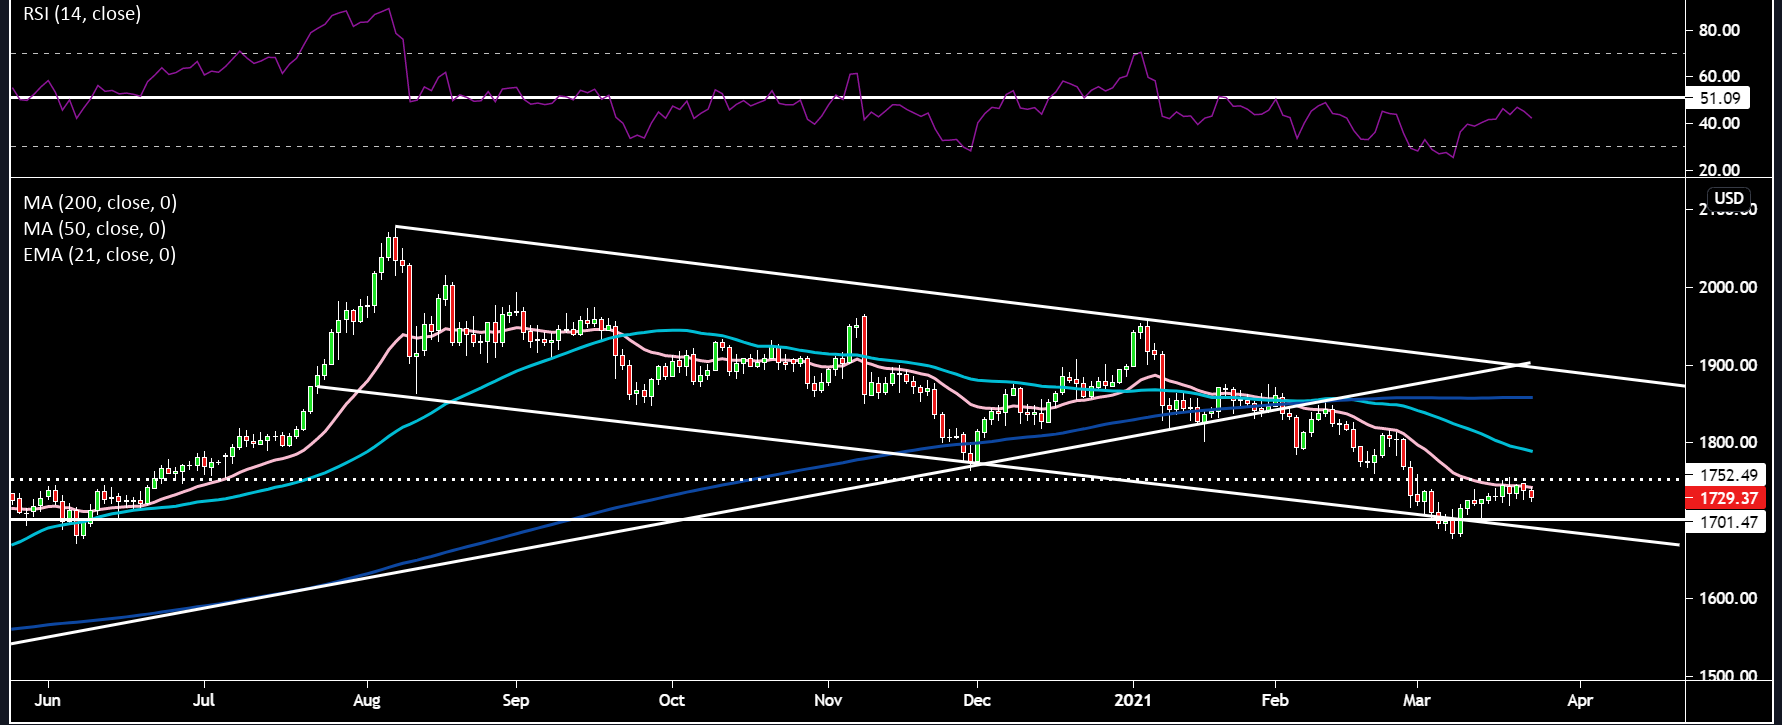
Price action in gold remains choppy and currently is below all 3 moving averages. Price is down a chunky -0.77% at the time of writing, on the back of dollar strength. There is minor support around the $1725 region and minor resistance around $1750 (coinciding with the 21-day EMA). The RSI has failed around the 51 resistance level and looks to have rolled over. Price may follow with the $1700 zone being eyed by short sellers as a first initial price target. There is strong support at that level – horizontal white line and lower line of the ascending channel. Below that we have the 8th of March low around $1675. If price can overcome the minor resistance at $1750 then gold could be magnetized towards the $1790 region (50-day SMA).
Related articles

.jpg?height=420)
Ready to trade?
It's quick and easy to get started. Apply in minutes with our simple application process.
The material provided here has not been prepared in accordance with legal requirements designed to promote the independence of investment research and as such is considered to be a marketing communication. Whilst it is not subject to any prohibition on dealing ahead of the dissemination of investment research we will not seek to take any advantage before providing it to our clients.
Pepperstone doesn’t represent that the material provided here is accurate, current or complete, and therefore shouldn’t be relied upon as such. The information, whether from a third party or not, isn’t to be considered as a recommendation; or an offer to buy or sell; or the solicitation of an offer to buy or sell any security, financial product or instrument; or to participate in any particular trading strategy. It does not take into account readers’ financial situation or investment objectives. We advise any readers of this content to seek their own advice. Without the approval of Pepperstone, reproduction or redistribution of this information isn’t permitted.