- English
- عربي
Markets Reassess Risk After US Payrolls Revisions and Rising Left-Tail Risk

Within the US employment report, two considerations that really stood out were that nearly all the job growth has been concentrated to the healthcare sector; subsequently, if we remove the job growth seen in the HC space, the past three NFP prints would have come in at -33k, -45k and -300. Secondly, the massive 285k revision to the prior two payrolls prints have been most intently debated - and rightly so, given that outside of the Pandemic era, the revisions represented the largest 2-month revisions on record.
Questioning the data and our ability to efficiently price risk
For me, the US payrolls outcome simply reinforces the focus on the significance and efficacy of the data sample, driven notably by the decade+ structural decline observed in the response rates. Many also question the methodology used to capture the data, which again appears increasingly out of touch with the evolution in technological shifts. Trump’s move to dismiss the head of the BLS may be seen by many as erratic, but it speaks to concerns on the validity of the data, and not just in payrolls, but in many other important touch points to which the Fed set policy too, and that makes the job of pricing risk and economics incredibly challenging for markets players too.
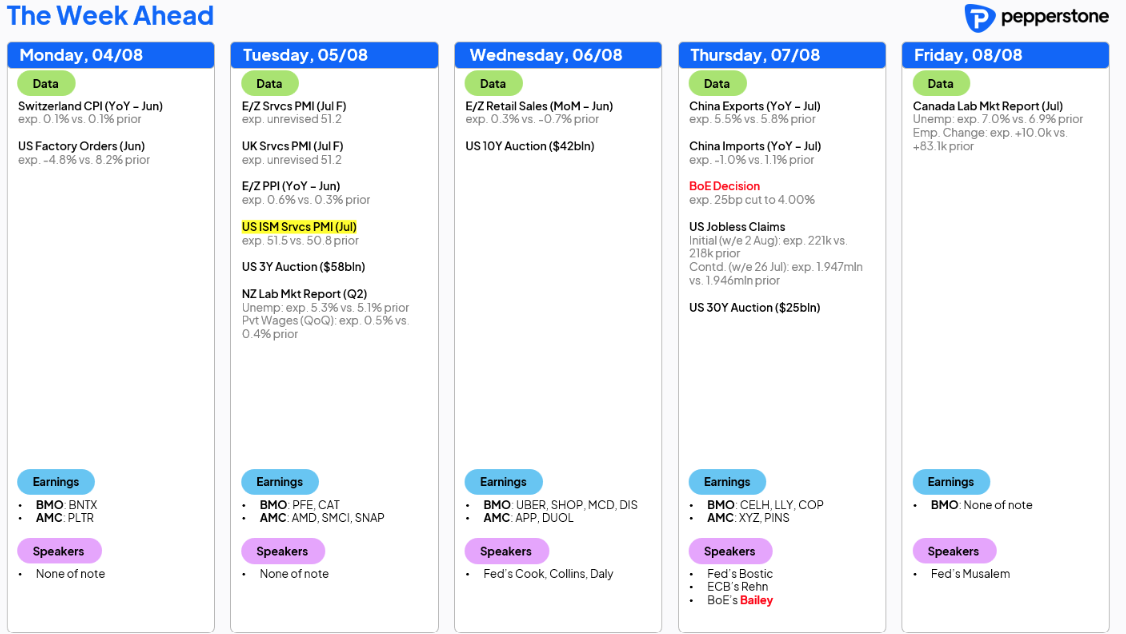
Friday’s payrolls report has pulled the markets thought process to the re-emergence of left-tail (growth) risk into the equation, and this comes at a time when the consensus call is for US core PCE to rise to 3.2% by Q4. The next US NFP report is not released until 5 September, but it goes without saying that there will be an incredible focus and positioning around this date, and one even questions the possibility that some could start debating a 50bp cut in the September FOMC meeting – a scenario that would require a lot to go wrong in the near-term economic data points, and would almost certainly require a far lower than expected core CPI print (due on 12 Aug).
Risk Markets: A crisis in need of a catalyst
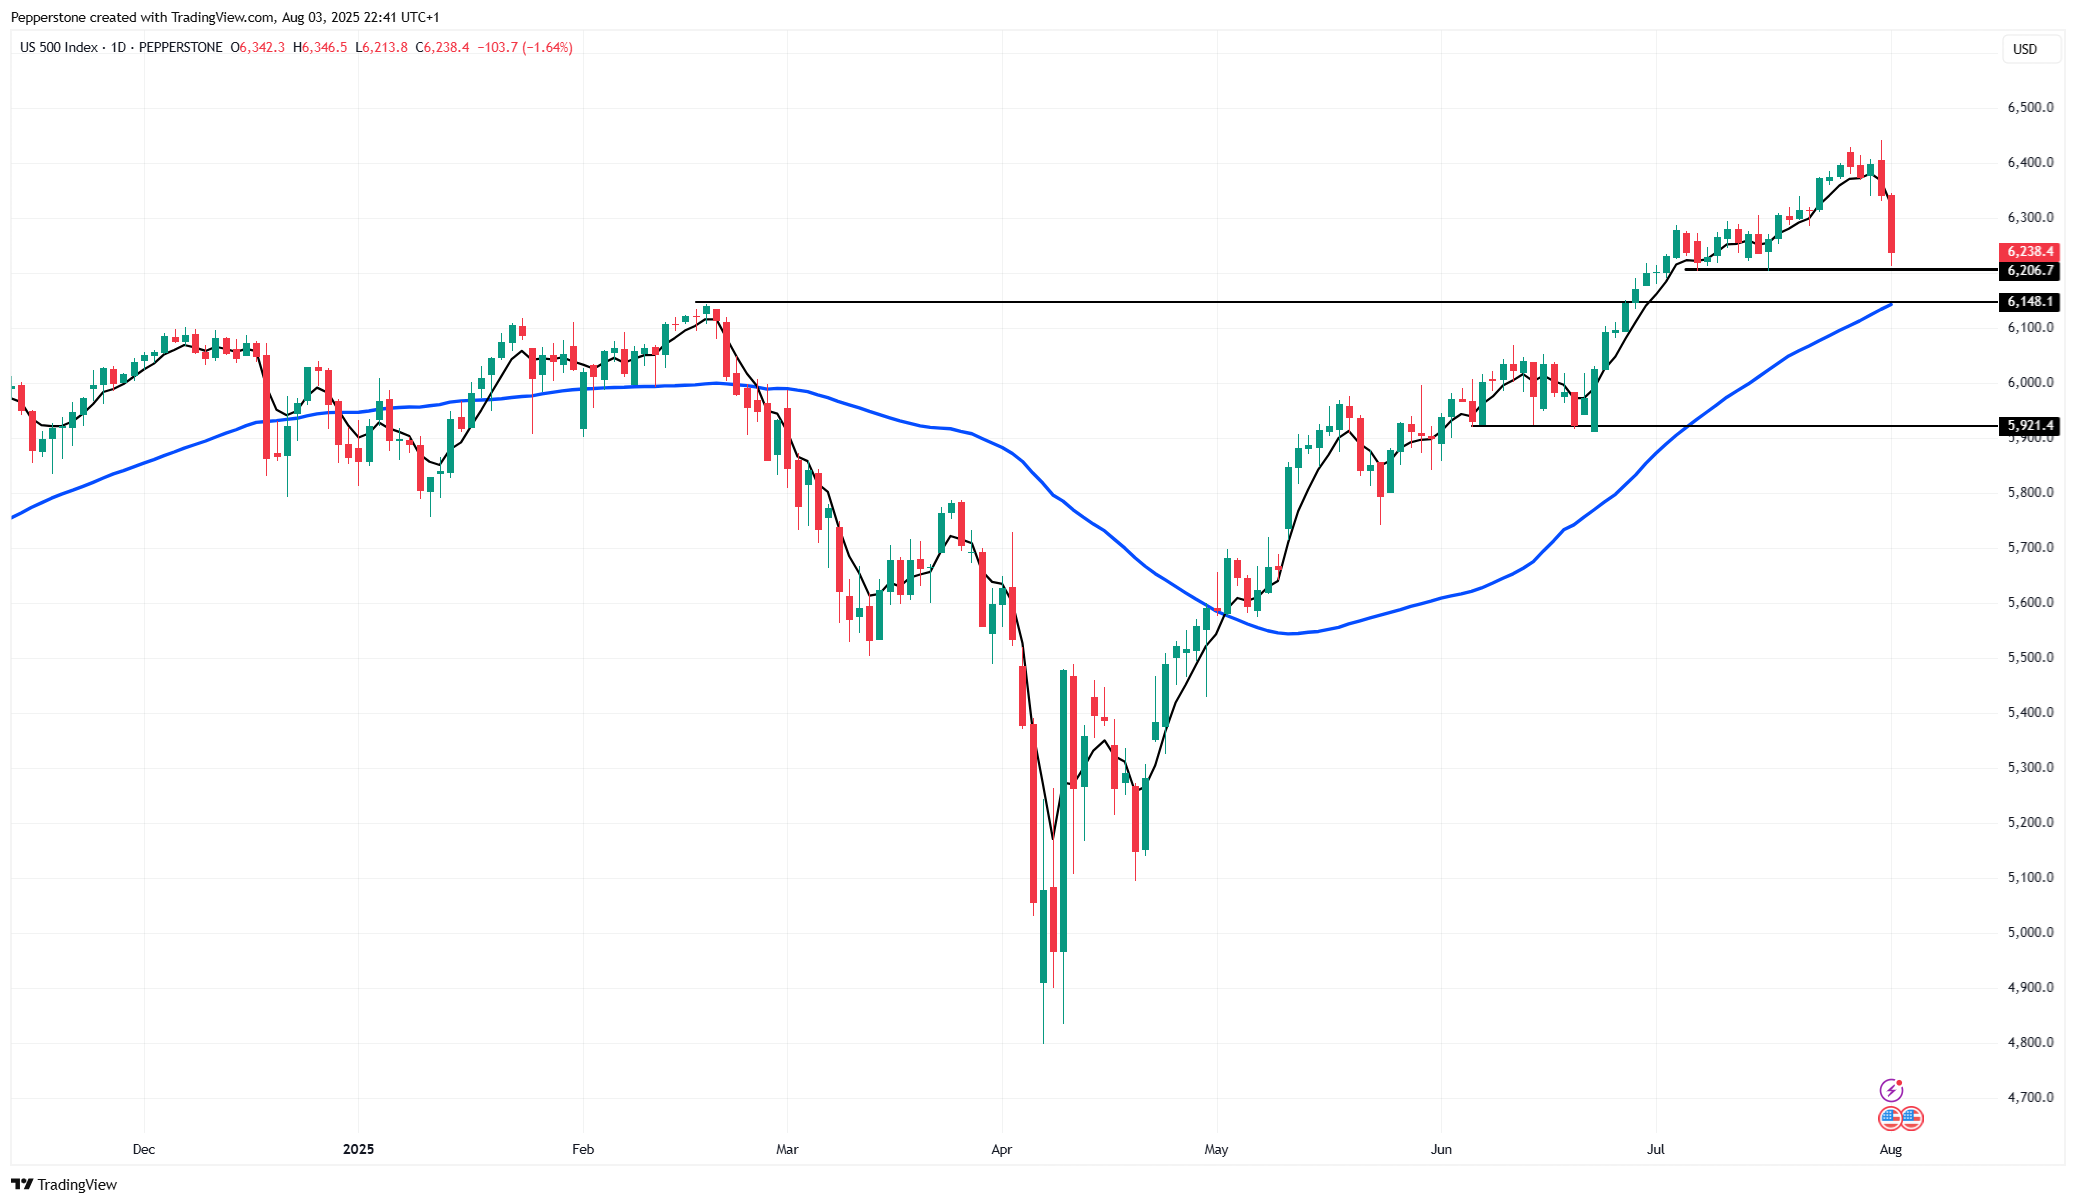
Factions within the investment community had loosely viewed risk markets (S&P500 for ex) as an impending crisis in need of a catalyst, but the steady grind higher in the S&P500 and NAS100 on very low realized vol meant having to chase the market higher ….while the US Treasury market did put out a strong message on Friday, I’m still not convinced that we yet have that catalyst. However, there could realistically be a shift in portfolios towards more defensive portfolio construction, with increased hedging flows and higher skew lifting cross-asset vol and seeing volatility-dynamic and risk parity funds taking down equity exposure.
The buy-the-dip crowd won’t have changed their tactical view and will be looking at their next entry points to support. However, there are reasons to believe the S&P500 could see a further 3-5% downside from here – while there has been a solid build-up of leverage in the system, we also know that traders/investment funds have piled into short volatility exposures, resulting in options dealer’s holding a punchy long gamma exposure – subsequently, a further decline in equity will see them have to manage that accordingly. CTAs would then possibly take down their length should US equity index futures fall through their set trigger levels.
Another issue in the markets thought-process is that while Trump’s tariff rates are now better known, there is a strong view that the massive investment commitments pledged by a number of the major economic nations lack a robust and transparent framework, and over time, could be viewed in a similar light as China’s pledge to buy $200b of US goods in the 2022 Phase One Deal – where, essentially, China made no purchases. US High Yield (HY) credit could offer a more defined guide on how the tariff regime and unfolding economics are impacting margins and the competitiveness of the lower quality US corporate landscape. If the market takes the view that they now have the required visibility to act, HY credit spreads could guide and become a more impactful driver of equity returns and possibly also for the USD and gold...
Liquidity in focus
We can also consider the poor seasonal effects for risk as we head into the August Northern Hemisphere Summer period. With the likely reduced liquidity seen through the order books, this could materialise at a time when system liquidity may also fall and become an increased headwind for risk, with the formal start to the US Treasury TGA rebuild process set to result in a $400b+ reserve drain from the system. Market Views Price is the first derivative here, as always, and a falling S&P500 (cash/futures) would only perpetuate the selling, with vols also driving repositioning flows - with many holding a max long equity position, taking a few chips off the table seems somewhat prudent … a high-volume closing break of 6241 in S&P500 futures will guide on this, but this development would only accelerate the near-term drawdown and see utilities & low vol equity factor outperforms, with low quality, high short interest names and even US small caps underperforming.
In rates, a break of 3% in SOFR futures (reds) would be an important signal that US rates traders are pricing a higher US recession risk, which is currently implied at a 15%-20% probability – this development (should it comes) takes gold to new highs and into a possible trending regime – for now, it feels as though the US data due through this week shouldn’t add to the perceived emergence of left tail risk, and one suspects that US IR swaps are now fairly priced given the implied 87% chance of a cut in September.. that said, the USD faces further near-term downside risk with USDJPY possibly eyeing a move into 144/143… EURUSD to 1.1700, with EU-US real rate and 1Y1Y differentials lifting the perceived fair value. Last week's unpredictable actions by Trump may have also increased the demand for hedging USD exposure among foreign investment managers.
Good luck to all.
The material provided here has not been prepared in accordance with legal requirements designed to promote the independence of investment research and as such is considered to be a marketing communication. Whilst it is not subject to any prohibition on dealing ahead of the dissemination of investment research we will not seek to take any advantage before providing it to our clients.
Pepperstone doesn’t represent that the material provided here is accurate, current or complete, and therefore shouldn’t be relied upon as such. The information, whether from a third party or not, isn’t to be considered as a recommendation; or an offer to buy or sell; or the solicitation of an offer to buy or sell any security, financial product or instrument; or to participate in any particular trading strategy. It does not take into account readers’ financial situation or investment objectives. We advise any readers of this content to seek their own advice. Without the approval of Pepperstone, reproduction or redistribution of this information isn’t permitted.