- English
- عربي
Weak US consumer confidence was the trigger and the equity market had enough, the bid came out of the market, short-sellers sensed the order book changed and down price went – with Crude re-claiming its former April uptrend and breaking $111 it was odd to see a weakening of US inflation expectations (i.e ‘breakevens’ – the average expected inflation rate over a set duration – you can see these on TradingView – T10YIE) and the end result was US real Treasuries (or TIPS) lifted 4bp to 69bp.
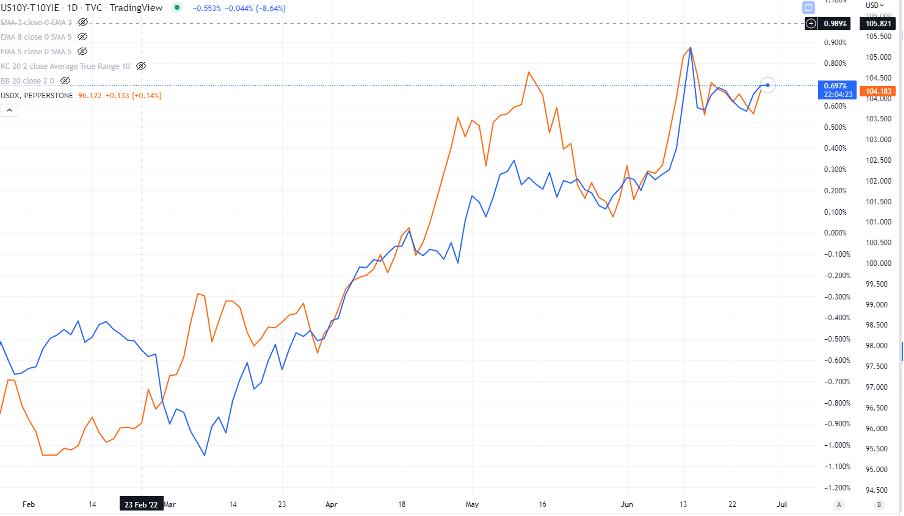
US real rates drive everything in markets right now and if they're going up then so is the USD and down goes equity – we can see the 1-month rolling correlation (assessed by value, not percentage) between US 10-yr real rates and the USDX at +0.94 – so there is an incredibly strong relationship.
Blue - US 10yr real rates, orange – USDX

(Source: TradingView - Past performance is not indicative of future performance.)
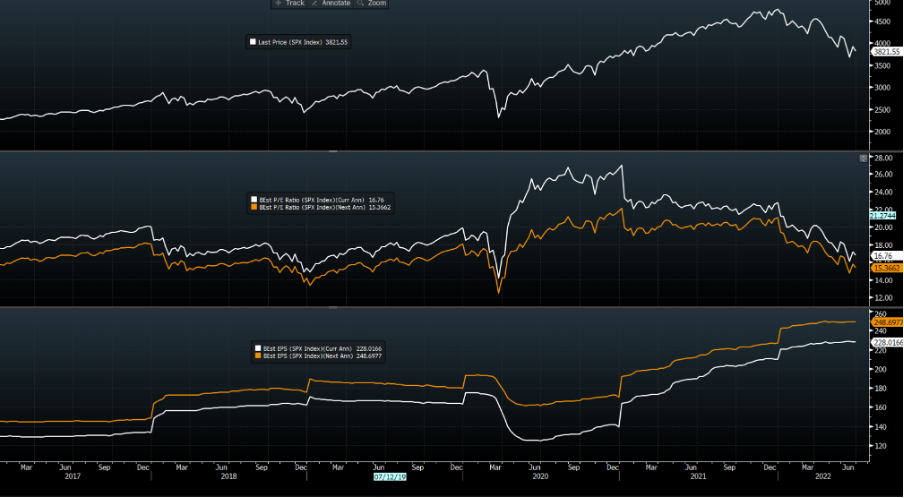
This is also true of equities where the US real rate (that is we deflate the 10yr Treasury for expected inflation) holds a rolling 1-month correlation with the US500 of -0.92 and NAS100 -0.89. We know consensus earnings expectations haven’t really fallen at all as we eye the US Q2 earnings season (14 July – JP Morgan starts proceedings) – the 12-month forward price-to-earnings multiple of the market, which has fallen from 27x to 16.7x, has all been driven by rising rates and a stronger USD.
When we do get the consensus earnings revisions, which seems a matter of time, then the consensus forward multiple will rise which could cause a further wave of selling in equity. That final push should clear the decks for a sustained rally in risk, in my opinion.
Consensus earnings and P/E ratio for this full-year and next-year

(Source: Bloomberg - Past performance is not indicative of future performance.)
Higher real rates act as the true cost of capital – they are the handbrake on economic activity that the Fed need to be more cognisant of than anything. If 10yr real rates are going to 1%, and if this relationship holds, then I think the DXY re-tests the 15 June highs, although we are seeing real support for EURUSD, and the US500 likely heads to 3400 – 3200.
It's here where most see a trough in the market and where we bake in a true recession – not just a technical one, but one where we see broad-based layoffs. As it is, a recession is certainly probable, but will the economy talk itself into something far more pronounced that really impacts consumption?
Traders can see these rates on TradingView by typing TVC:US10Y-FRED:T10YIE – into the search function – this is the 10yr real rate, but you can change to TVC:US05Y-FRED:T5YIE for the 5-year.
Related articles
Ready to trade?
It's quick and easy to get started. Apply in minutes with our simple application process.
The material provided here has not been prepared in accordance with legal requirements designed to promote the independence of investment research and as such is considered to be a marketing communication. Whilst it is not subject to any prohibition on dealing ahead of the dissemination of investment research we will not seek to take any advantage before providing it to our clients.
Pepperstone doesn’t represent that the material provided here is accurate, current or complete, and therefore shouldn’t be relied upon as such. The information, whether from a third party or not, isn’t to be considered as a recommendation; or an offer to buy or sell; or the solicitation of an offer to buy or sell any security, financial product or instrument; or to participate in any particular trading strategy. It does not take into account readers’ financial situation or investment objectives. We advise any readers of this content to seek their own advice. Without the approval of Pepperstone, reproduction or redistribution of this information isn’t permitted.

