- English
- عربي

Unemployment has now risen from 5.1 percent in December 2019 to 5.3 percent in January 2020. The main reason for this change has been an increase in the amount of people searching for a job rather than a substantial amount of jobs being lost. The real story could be the under-employment stats, with the rate rising from 8.3 percent to 8.6 percent over the same period. This rise of the new under employment phenomenon has started to put pressure on the Reserve Bank of Australia (RBA) to try and come up with ideas on how to boost the economy, with further rate cuts or even quantitative easing becoming options if the economic outlook remains weak.
The lead up to the weaker than expected unemployment data AUDUSD
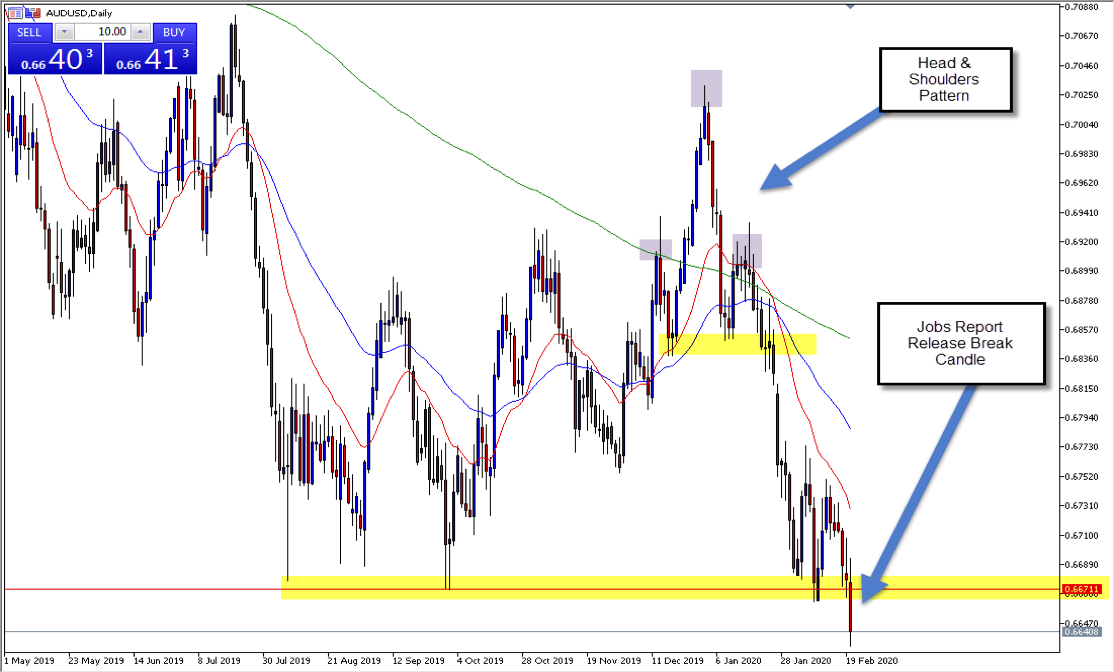
Even before the weak 20 February jobs report, we saw a strong pattern on the AUDUSD. This is a great example of a head and shoulder pattern with a clean formation of both shoulders at a similar size to each other. What made this head and shoulder pattern even stronger was the rejection candle at the neckline that came off the moving averages, which indicates bearish momentum. The story since then has been mostly weakness for the AUDUSD but on the release of the jobs report, we’ve seen a key support level at 0.6670 broken owing to increased speculation of another rate cut or monetary stimulus from the RBA due to the weak economic figures.
Where to next for the Aussie
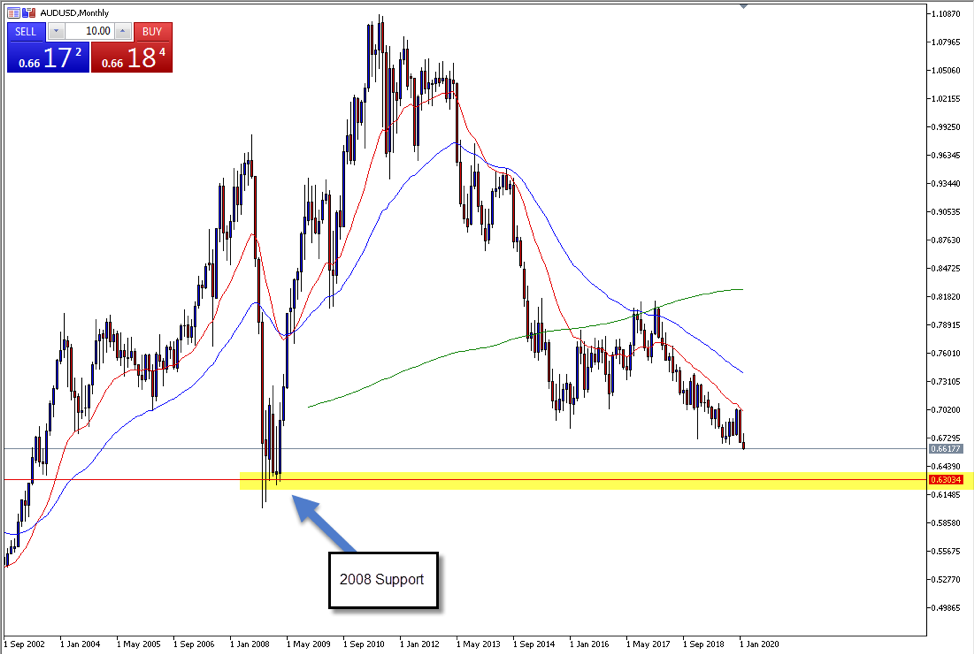
The chart above shows that a new lower low is forming on the AUDUSD monthly chart, exposing the AUDUSD to further weakness. The 2008 monthly support level at 0.6300 (highlighted in yellow) could become the next level of significant support in the coming months.
The story of slowing global growth and economic uncertainty
The story of weakness in the Australian job figures, coupled with slowing inflation is not exclusive to Australia. Other world powers such as Europe, Japan and even China are experiencing economic slowdown, and this has caused many investors to look for alternative stores of wealth to hedge against such uncertainty. Gold has long been one of these investments, and often has an inverse relationship with Indices, especially during market crashes. What’s interesting about the current financial climate is that as the S&P 500 reaches record highs, a very bullish case for gold has emerged with investors flocking to the precious metal and pushing it to a multiyear high.
The break above 1600, an important psychological level
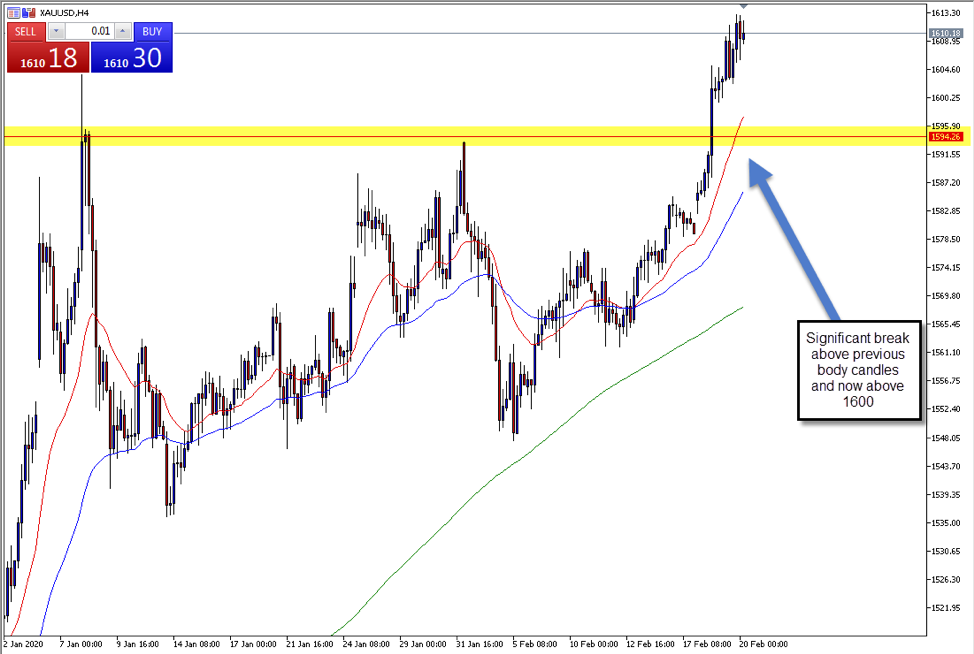
The chart above displays the break above the 1594 resistance level (highlighted in yellow) and the acceleration to new highs not long after. The close above 1594 was very significant as it was the first close where the body of a candle was above the zone on a 4hr chart. This close acted as confirmation that XAU/USD was firmly in the bull’s control and it has since continued rising with strong momentum.
What does this mean for gold longer-term?
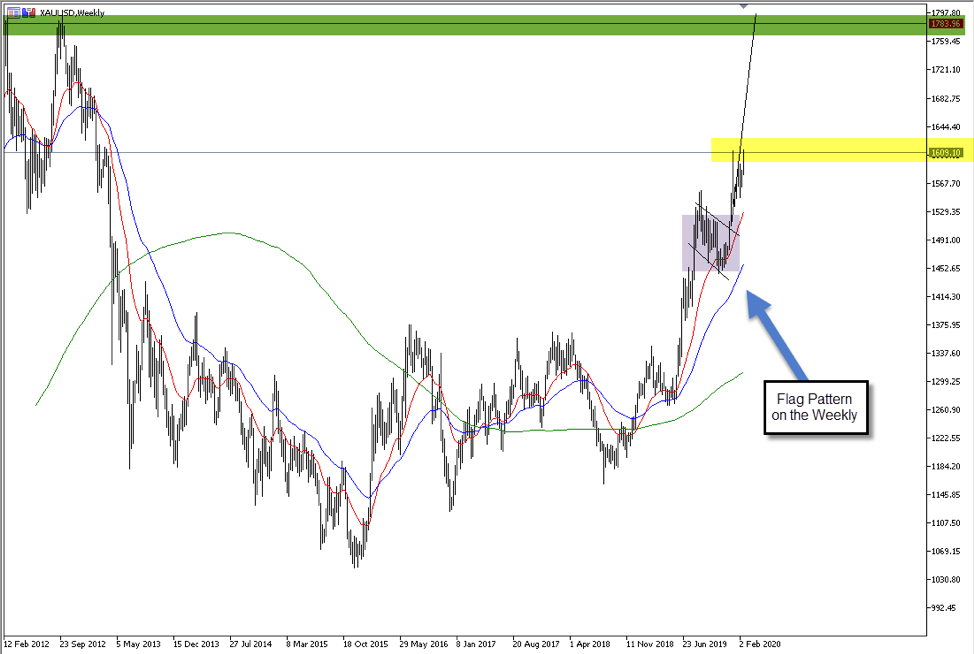
The break above 1600 from a technical analysis standpoint is very important as it confirms the momentum of the bullish flag pattern formed last year. The flag formed between 1550 and 1450, and has a pole length that can be forward projected to the price of 1780. As is so often the case, this price also happens to be the significant resistance point of the 2012 high, and is a logical zone for gold to gravitate to over the coming months now we have seen this breakout.
What’s next for the global economy?
Trading breakouts can be hard and sometimes counterintuitive for many traders. The importance of trading a great breakout often lies in recognising key areas that generally require a series of events to occur before being broken. In a time of economic uncertainty, the only thing we can be certain of is that price will be one of the leading indicators.
Ready to trade?
It's quick and easy to get started. Apply in minutes with our simple application process.
The material provided here has not been prepared in accordance with legal requirements designed to promote the independence of investment research and as such is considered to be a marketing communication. Whilst it is not subject to any prohibition on dealing ahead of the dissemination of investment research we will not seek to take any advantage before providing it to our clients.
Pepperstone doesn’t represent that the material provided here is accurate, current or complete, and therefore shouldn’t be relied upon as such. The information, whether from a third party or not, isn’t to be considered as a recommendation; or an offer to buy or sell; or the solicitation of an offer to buy or sell any security, financial product or instrument; or to participate in any particular trading strategy. It does not take into account readers’ financial situation or investment objectives. We advise any readers of this content to seek their own advice. Without the approval of Pepperstone, reproduction or redistribution of this information isn’t permitted.