- English
- عربي
Taking Stock Of The Equity Market Slump: Gauging Where A Turning Point May Lie

In many ways, it can be something of a fool’s errand attempting to pick a top, or a bottom, in the equity market. Chances are, unless through sheer luck, one will never sell the exact high tick, or buy the precise low tick. Attempting to do so seldom ends especially well.
That said, it can be, and often is, valuable to assess where markets stand in the grand scheme of things, and whether a turning point could be on the horizon.
Context
To start, let’s zoom out. It’s been a dismal March, and downbeat start to the year, for most global equity benchmarks, as the outbreak of conflict in the Middle East has roiled risk appetite. Most European bourses have slipped into ‘technical corrections’, having fallen over 10% from recent highs, while both the Nasdaq 100 and the Russell 2000 have done the same. APAC stocks have fared worse, with the KOSPI recently declining into a ‘bear market’.
Fundamentals
Unsurprisingly, the reasons behind recent declines can be instructive when considering whether a tradeable equity bottom is in, and whether a turning point could be on the cards.
To recap, kinetic action in the Middle East has caused a surge in energy prices, chiefly crude, but others such as natural gas too. In turn, this has flipped the macro backdrop on its head, with participants and policymakers alike now forced to grapple with not only upside inflation risks, but also mounting growth headwinds stemming from the negative demand shock that will likely now play out.
As if that wasn’t enough, conflict continues to rage, and while the Trump Admin have signalled they are seeking to de-escalate the conflict, the distribution of potential outcomes from current goings-on remains as wide as ever, making it essentially impossible for participants to accurately price risk. With that, and the never-ending headline whiplash, the prevailing view has been to trim position sizes, take down risk levels, and seek shelter in safe havens, largely the greenback.
Ultimately, a durable turnaround in risk appetite is likely to require a turnaround in all of the above factors or, at the very least, concrete signs that de-escalation is indeed on the cards, and commodity flows through Hormuz are normalising.
_Mo_2026-03-31_11-23-48.jpg)
Internals
Along with the aforementioned fundamental factors, there are a range of technical & internal factors that one can lean on in determining whether a turning point may be near, particularly when we look back at prior market bottoms.
The first hallmark of such a turning point is that, typically, a major bottom would come after a ‘capitulation moment’, where bulls lose all remaining hope, surrendering longs, accepting any losses that may be incurred, having given up on any expectation of a rebound. Such an occasion not only typically sees one, or more, days of very heavy selling, but also a huge surge in volumes. It’s tough to say that this ‘maximum fear’ moment has been reached yet, particularly considering that the worst day for the S&P 500, thus far, has been a mere 1.75% decline.
_Daily_2026-03-31_11-25-08.jpg)
Momentum also helps here. While far from a perfect indicator, the 14-day RSI is a handy, if rudimentary, way to gauge things on this front. In prior instances of major market turning points, around 40-50% of S&P 500 constituents have traded in ‘oversold’ territory, with an RSI below 30; at the time of writing, only 10% of the index are in such a position. While that, in itself, doesn’t rule out this being a bottom, it would be at odds with the signals that we’ve seen historically.
_Daily_2026-03-31_11-43-47.jpg)
One can also look at the magnitude of the drawdown that we’ve seen from recent highs. Again, at the time of writing, the S&P is just under 10% off the record high set in late-January, compared to a typical drawdown of between 15% and 20%. This time could well be different, but it would once more be at odds with what we’ve seen before.
_Daily_2026-03-31_11-27-51.jpg)
Moving averages can also help here, in gauging the scale of the declines, and the dispersion of the downside that we’ve seen.
On the former, the S&P has now closed below the 200-day moving average for eight days in a row, which does represent the worst run since ‘Liberation Day’ last year, but is still some way off the 45 day median duration that the benchmark has spent below the 200-day since first closing below, going back to the turn of the century.
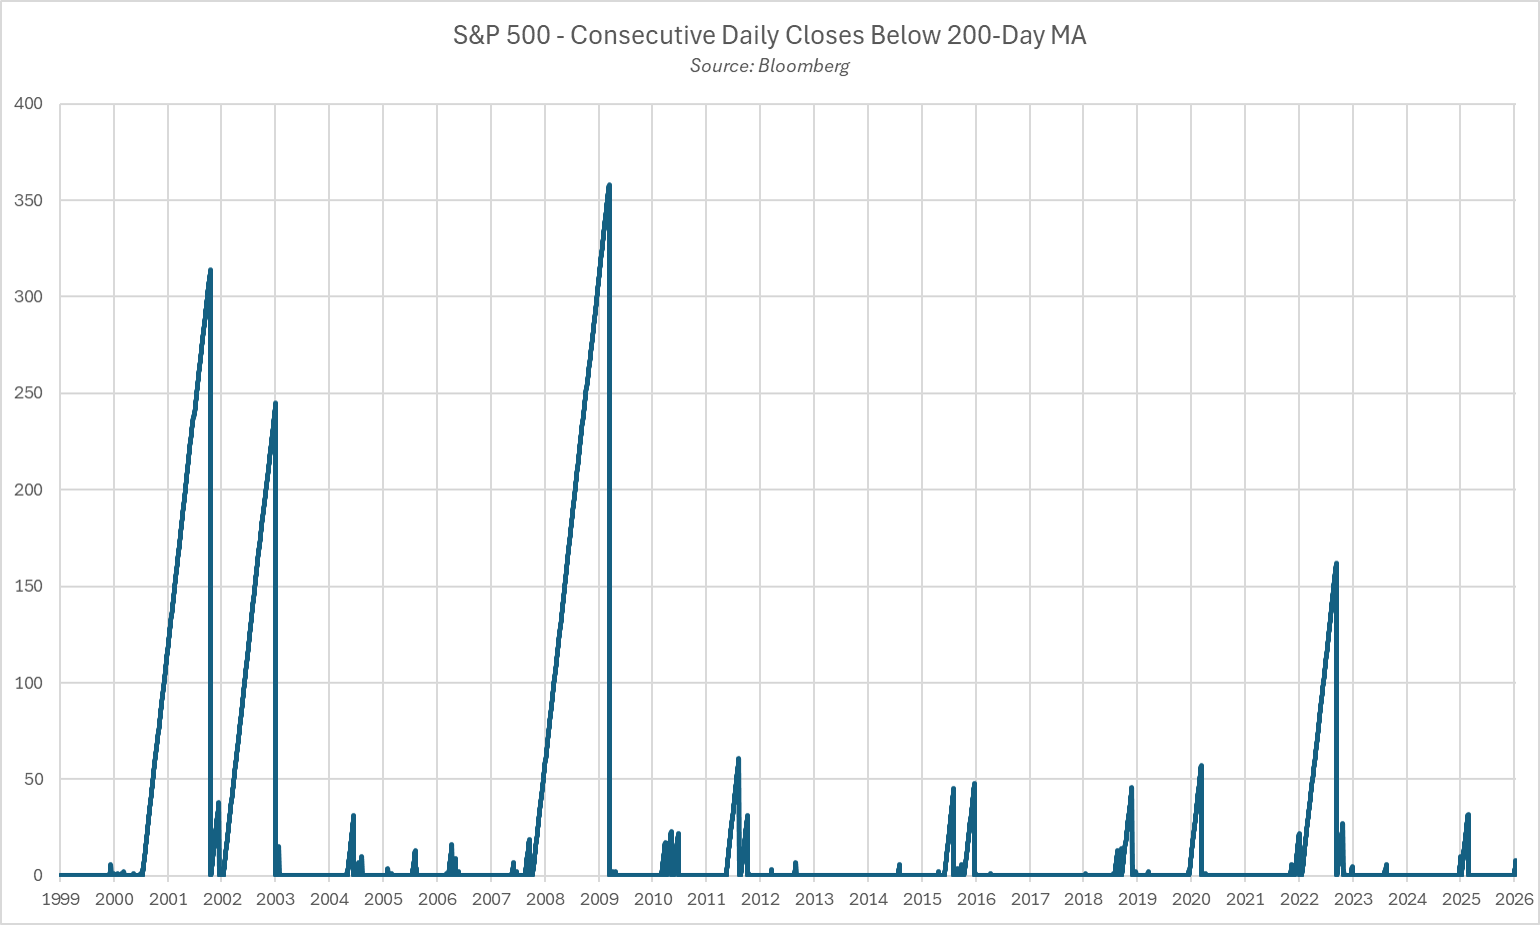
As for index constituents, around 44% of the S&P currently trade beneath their 200-day moving averages, compared to typically around 15% to 20% on the occurrence of prior significant turning points.
_Daily_2026-03-31_11-30-15.jpg)
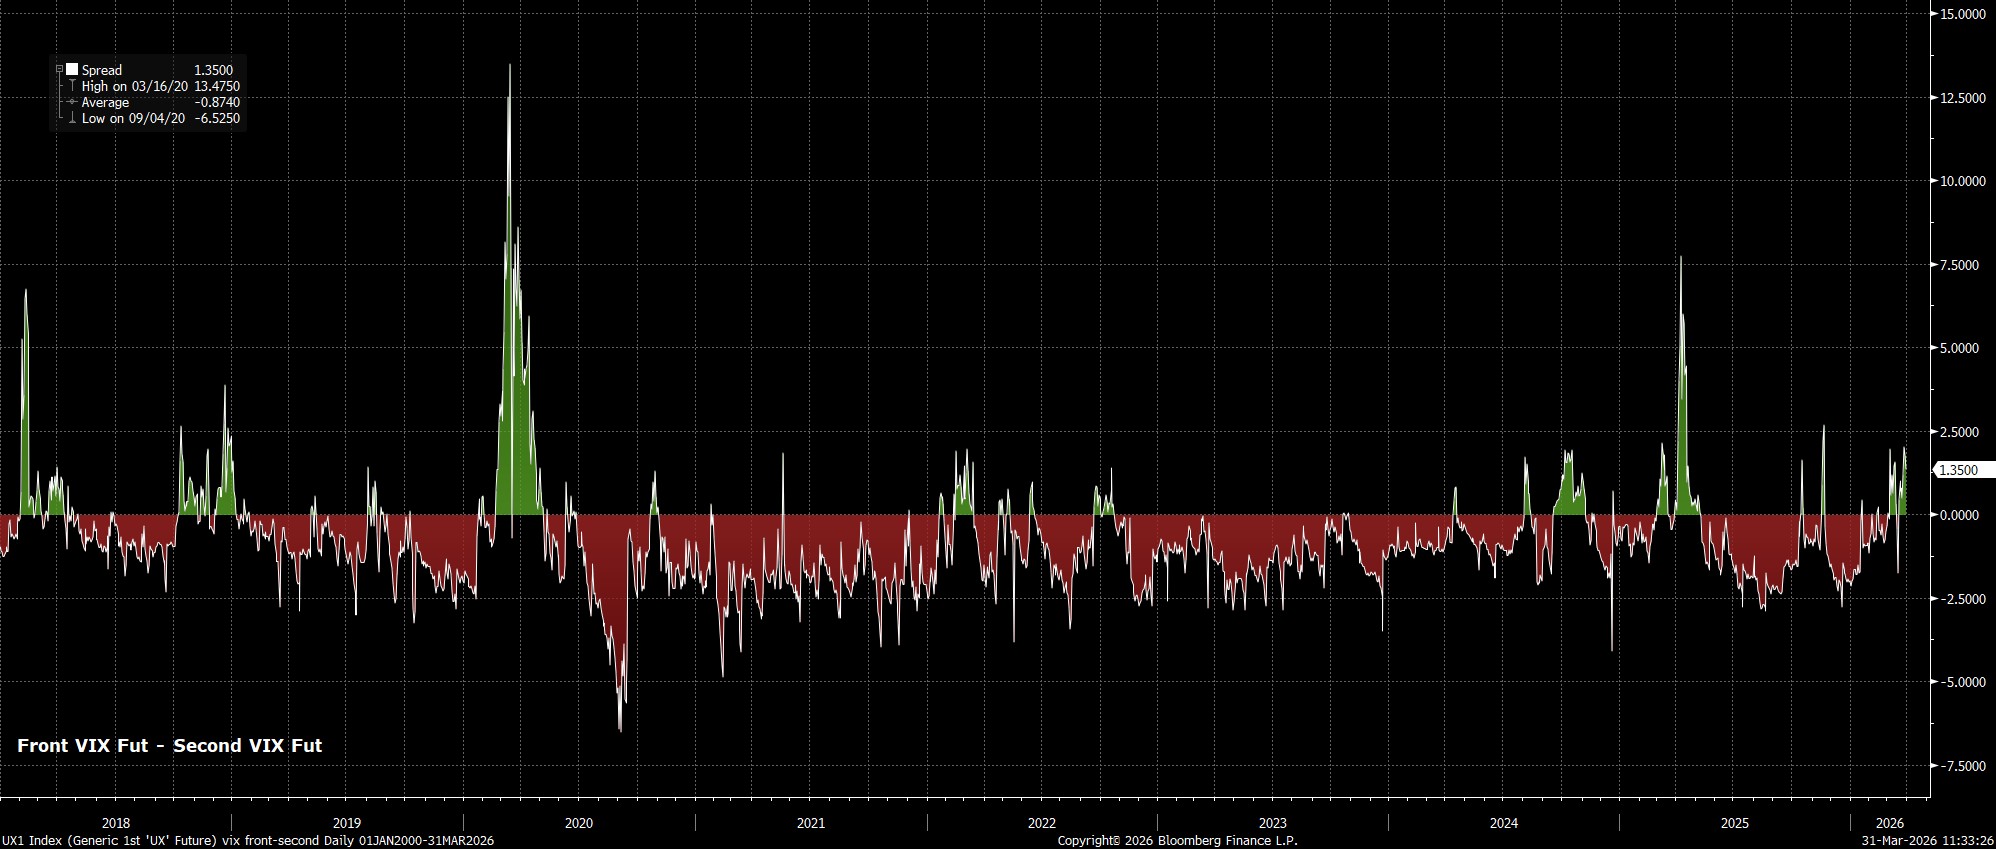
Volatility is also something to consider. Typically, the VIX curve trades in contango, whereby futures prices trade higher than spot, implying an expectation that vol will increase over time, largely reflective of the mean-reverting nature of the index.
At present, though, the curve is in backwardation, the opposite of the aforementioned dynamic, which implies that present market conditions are more uncertain than the future is likely to be, subsequently implying hedging to be more expensive too. That said, the degree of backwardation at present, while considerable, is far from being as extreme as seen in either the aftermath of Trump’s tariff announcements last year, or as seen during the pandemic.
Qualitative Observations
Moving from technical factors, to feelings, most market participants would probably agree that conditions have yet to feel ‘panicky’, or ‘disorderly’. While risk assets have sold-off, this selling pressure has been absorbed relatively easily, and has not been indiscriminate in nature, with the S&P 500 having seen just one day since conflict began where >80% of the index has closed in negative territory.
Conclusion
To be clear, none of the indicators or themes mentioned here are entirely foolproof, though at the current juncture, there are few parallels that one can draw between prevailing market conditions, and those which have been seen at prior turning points.
My own view is that it will be a fundamental catalyst that drives a rebound in risk appetite from here, most obviously a concrete indication that de-escalatory steps are being taken and/or the resumption of more ‘normal’ commodity flows through the Strait of Hormuz. Unless and until those indications appear, caution is likely to continue to prevail for the most part, with participants probably retaining a preference to sell rallies, instead of buying dips, in the short-term.
Zooming out, I retain my belief that ‘this too shall pass’. The global economy has weathered supply shocks, oil price surges, and growth headwinds before, and in all likelihood will do so once more. The same goes for global equities where, once geopolitical noise begins to be dialled down, the medium- and longer-run ‘path of least resistance’ continues to lead higher.
The material provided here has not been prepared in accordance with legal requirements designed to promote the independence of investment research and as such is considered to be a marketing communication. Whilst it is not subject to any prohibition on dealing ahead of the dissemination of investment research we will not seek to take any advantage before providing it to our clients.
Pepperstone doesn’t represent that the material provided here is accurate, current or complete, and therefore shouldn’t be relied upon as such. The information, whether from a third party or not, isn’t to be considered as a recommendation; or an offer to buy or sell; or the solicitation of an offer to buy or sell any security, financial product or instrument; or to participate in any particular trading strategy. It does not take into account readers’ financial situation or investment objectives. We advise any readers of this content to seek their own advice. Without the approval of Pepperstone, reproduction or redistribution of this information isn’t permitted.