- English
- عربي
S&P 500 Slides 2.1%: Is This the Start of a Deeper Market Pullback?

Key Technical Levels Now in Focus
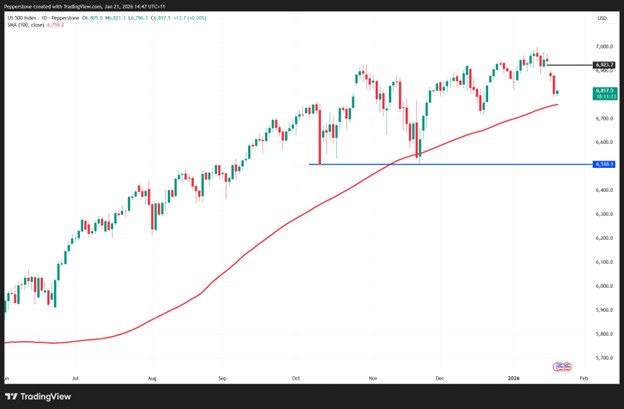
From a technical perspective, the inability to decisively break above 7000 proved pivotal. Sellers have since taken control, driving the index below the 50-day moving average at 6829 and through the 2 January swing low at 6820.
After gapping lower at the Tuesday open, those still long the index will be looking for a reversal and a gap fill toward 6923. However, traders must remain open-minded to the possibility that this proves to be a breakaway gap, which could see the index extend lower toward the 100-day moving average at 6745 and potentially test the 21 November low at 6508
Weak Market Internals Point to Elevated Downside Risk
The broader market internals paint a concerning picture. Poor breadth, elevated volume, the absence of dip buyers, and a close near session lows all suggest sustained selling pressure. On balance, the probability of further downside appears skewed higher than the prospect of a near-term reversal.
Rising Volatility Triggers Portfolio De-Risking
After an extended period of low volatility and complacent positioning, a 2.1% decline has clearly shaken the market. Cash equity volumes were around 30% above the 30-day average, indicating active portfolio management by money managers.
This has included reducing both core and non-core equity exposure, rotating into more defensive areas, increasing portfolio protection via S&P 500 puts or VIX futures, and adding gold as a hedge against growing geopolitical risks.
Earnings Season Set to Drive Further Volatility
With the US earnings season gaining momentum, single-stock volatility is expected to rise materially. Analysts are forecasting an impressive 13.6% increase in aggregate S&P 500 earnings in 2026, placing pressure on companies not only to meet expectations but to upgrade forward earnings projections.
After strong rallies and elevated valuations, the market is likely to show little tolerance for disappointment, with under-delivering companies vulnerable to sharp sell-offs.
Options Markets Price Record Earnings-Day Moves
Options pricing implies that the average S&P 500 company could move around +/-4.9% on its earnings day. If realised, this would mark the most volatile quarterly earnings season on record, underscoring the heightened risk environment for equity traders.
Macro and Rates Markets Add to the Risk Backdrop
Geopolitical risk remains a key catalyst, with markets focused on developments surrounding Trump’s claim on Greenland, the potential for US tariffs on European imports to rise from 10% to 25% by 1 February, and the likelihood of a European response.
Markets have also been unsettled by the sharp sell-off in long-end Japanese government bonds, with the move spilling over into European government bonds and US Treasuries. Traders continue to look for a response from Japanese authorities to stabilise the long end of the curve, though in the midst of a buyers’ strike, short sellers retain the upper hand.
MAG7 Stocks Drive Equity Market Weakness

The MAG7 stocks have been the primary drivers of the recent declines in both the S&P 500 and NASDAQ 100. The daily chart of the MAG7 basket is increasingly bearish, and investors appear to be reducing overweight exposure ahead of a heavy schedule of major technology earnings next week.
Good luck to all.
Related articles

The material provided here has not been prepared in accordance with legal requirements designed to promote the independence of investment research and as such is considered to be a marketing communication. Whilst it is not subject to any prohibition on dealing ahead of the dissemination of investment research we will not seek to take any advantage before providing it to our clients.
Pepperstone doesn’t represent that the material provided here is accurate, current or complete, and therefore shouldn’t be relied upon as such. The information, whether from a third party or not, isn’t to be considered as a recommendation; or an offer to buy or sell; or the solicitation of an offer to buy or sell any security, financial product or instrument; or to participate in any particular trading strategy. It does not take into account readers’ financial situation or investment objectives. We advise any readers of this content to seek their own advice. Without the approval of Pepperstone, reproduction or redistribution of this information isn’t permitted.